
How to Debug Adobe Forms in SAP
You cannot set a debugger directly in the SFP Adobe interface. To debug Adobe Forms in SAP, you set a breakpoint in the interface code and then run the generated global function module. This guide shows you how to choose between a global and a user-specific breakpoint, activate it, and step through the code in the ABAP Debugger.
Video: SAP Adobe Forms: How to Set Breakpoint in SAP Adobe Interface: Production & Development by SETUPORG (2024). All credit for the demonstration goes to the creator; watch the original on YouTube. The written guide below was generated from this video by Docsie. Creator? Request a change or removal.
You cannot set a debugger directly in the SFP Adobe interface. To debug Adobe Forms in SAP, you set a breakpoint in the interface code and then run the generated global function module. This guide shows you how to choose between a global and a user-specific breakpoint, activate it, and step through the code in the ABAP Debugger.
Prerequisites
Before you start, make sure you have:
- Access to SAP Form Builder and the interface you want to debug (for example,
ZADOBE_BREAKPOINT) - Access to transaction
SE37(Function Builder) - The name of the function module associated with your Adobe form (for example,
/1BCDWB/SM00000091)
Choose the breakpoint type
Because you cannot set a debugger directly in the interface, you use a breakpoint statement in the interface code. The statement you choose determines who it affects:
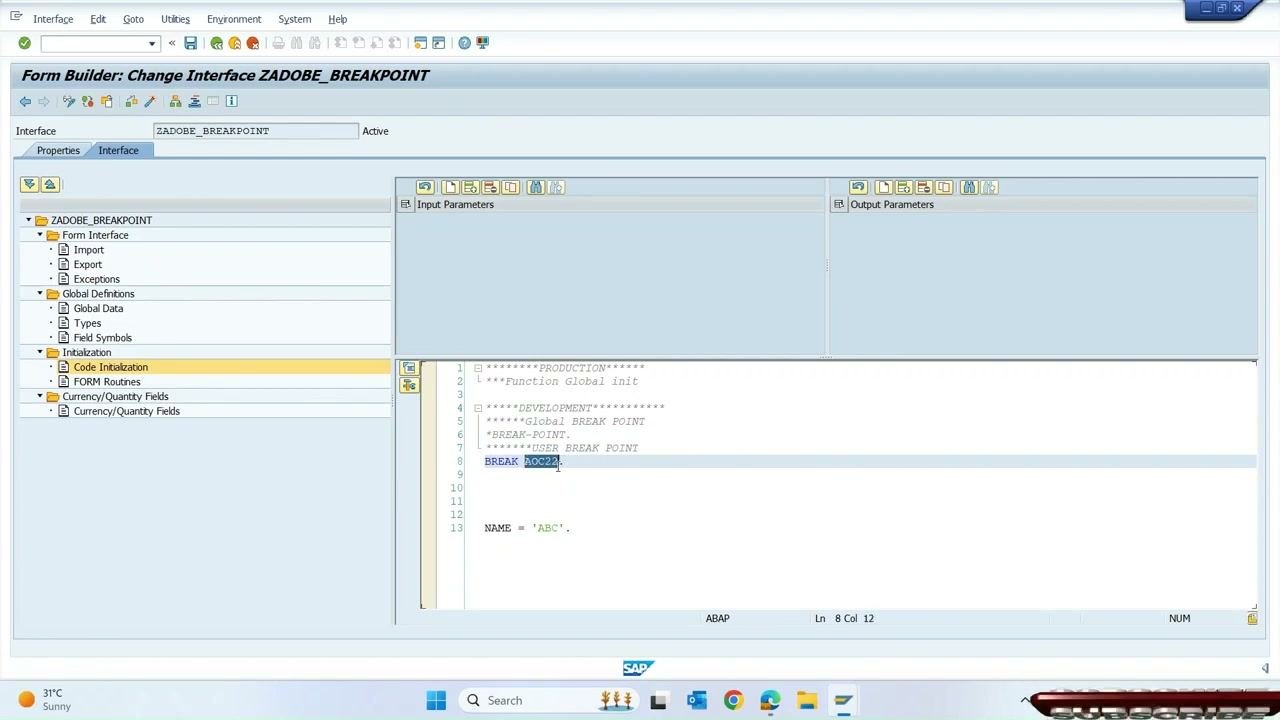
BREAK-POINT.triggers for all users running the program.BREAK <USER_ID>.(for example,BREAK ACC22.) triggers only for the specified user.
This distinction matters in shared or production environments, where you may not want to interrupt other users.
Open the interface in Form Builder
Launch SAP Form Builder and open your interface, for example ZADOBE_BREAKPOINT. Navigate to Initialization and select Code Initialization. Review the code area for comments and existing breakpoints.
The code area in this example looks like this:
******PRODUCTION******
***Function Global init

******DEVELOPMENT**********
******Global BREAK POINT
*BREAK-POINT.
******USER BREAK POINT
*BREAK ACC22.

NAME = 'ABC'.
Select the breakpoint line to use
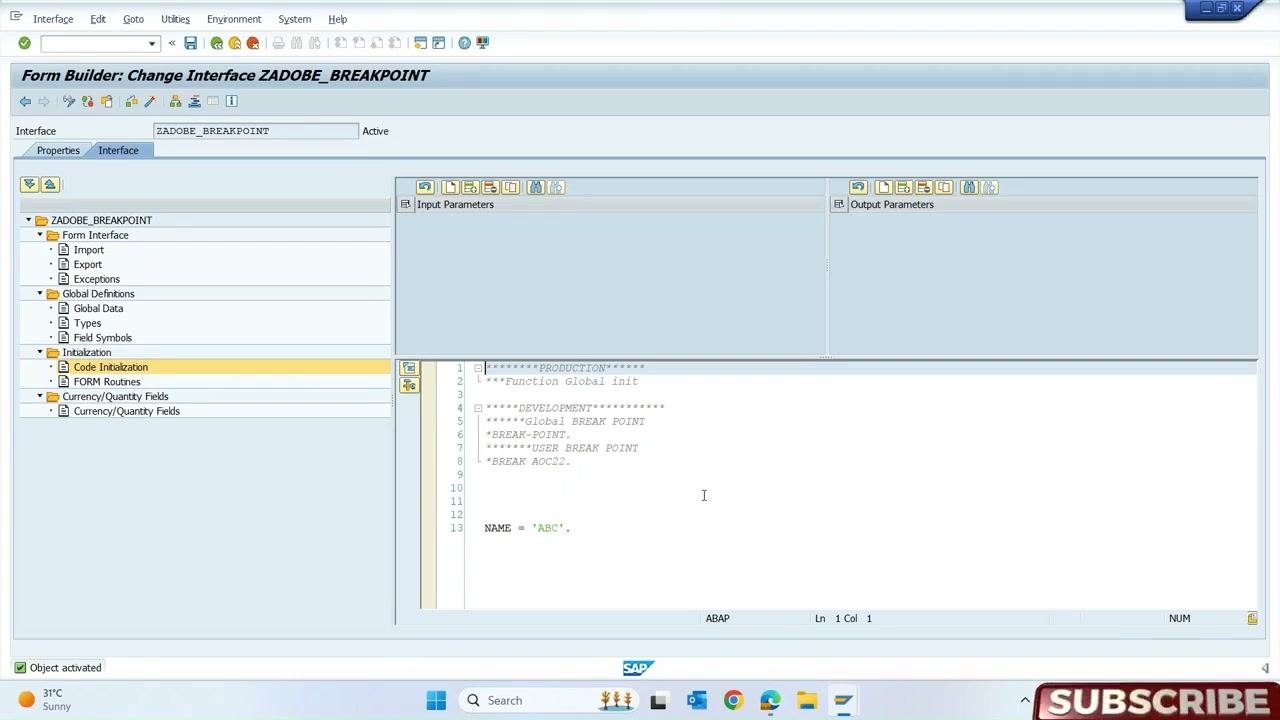
In the Code Initialization section, you comment or uncomment the breakpoint lines to match your debugging need:
- Uncomment
BREAK-POINT.for a global breakpoint. - Uncomment
BREAK <USER_ID>.(for example,BREAK ACC22.) for a user-specific breakpoint.
Use global breakpoints for broad debugging needs. Use user-specific breakpoints to limit the debugging session to your user ID and avoid disrupting others.
Activate the breakpoint
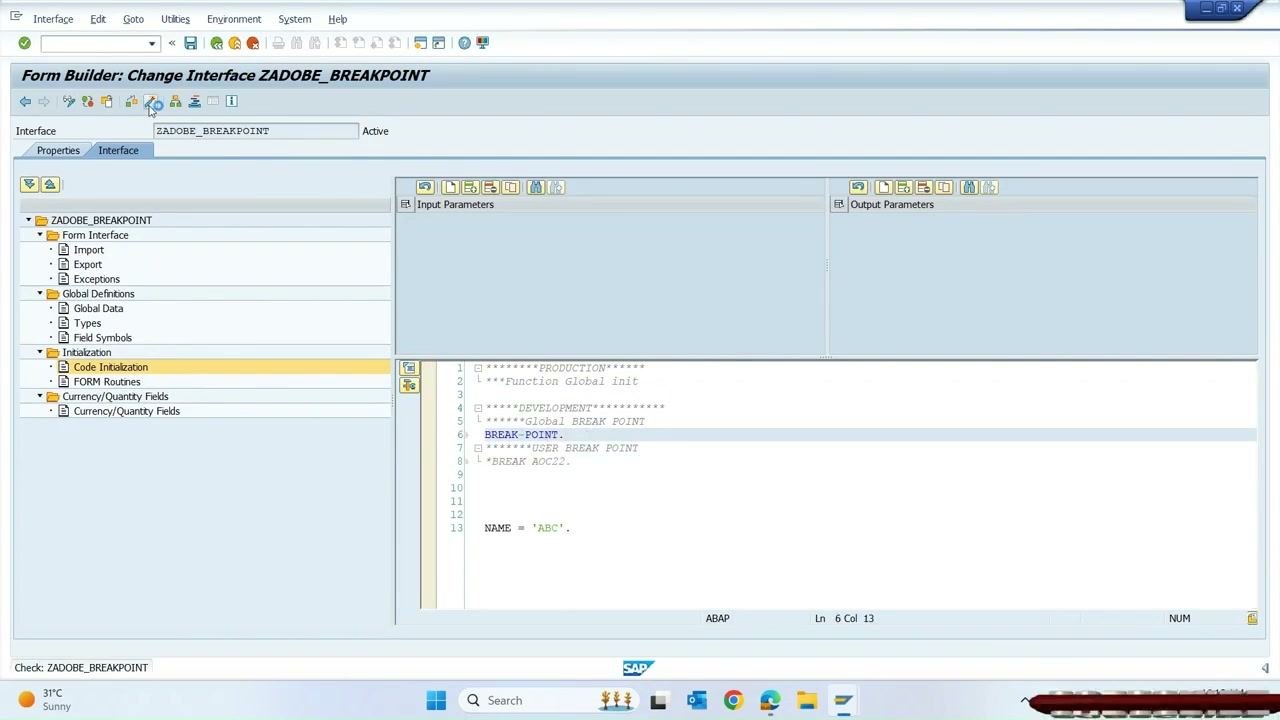
Make sure the breakpoint line you want is active, meaning it is not commented out. Then save and activate the interface object.
Open the function module in test mode
Select the function module associated with your Adobe form and open transaction SE37 (Function Builder). On the function module initial screen, enter the function module name, for example /1BCDWB/SM00000091. Make sure the Debugging option is checked if it is available.
Find the global initialization section
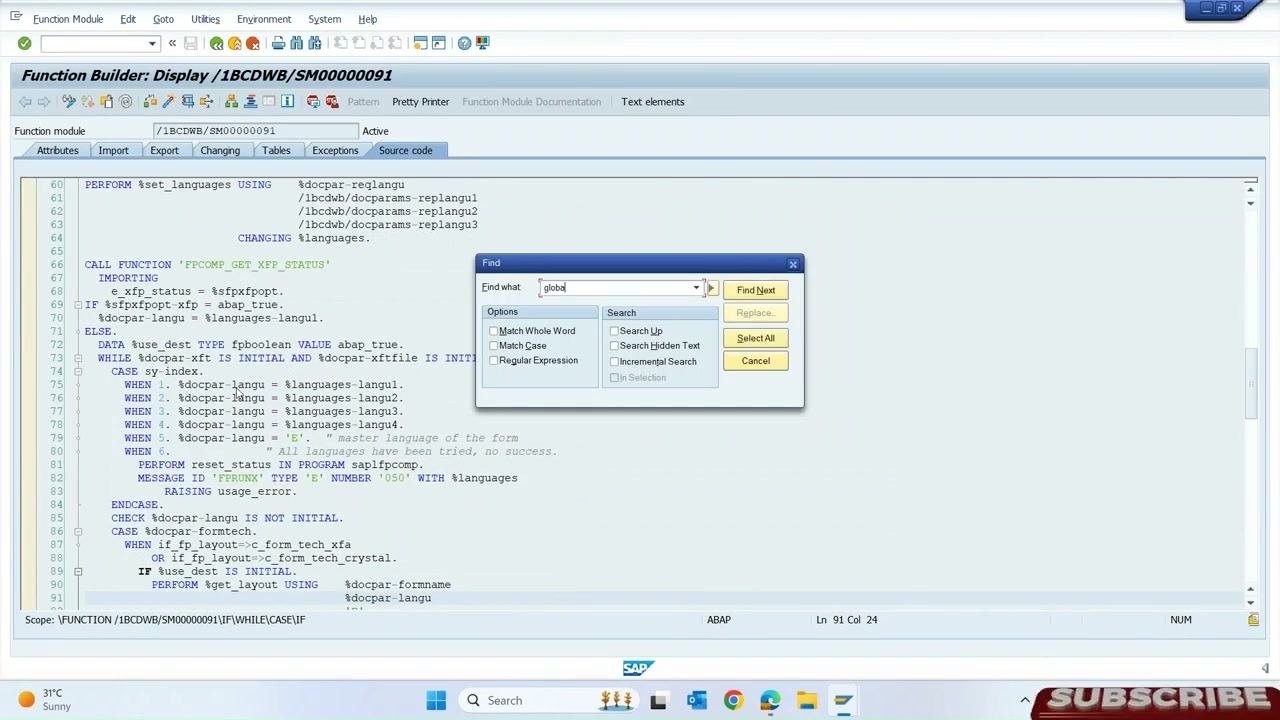
In the Function Builder, switch to the Source code tab. Use the Find dialog to search for the keyword global to locate the global initialization section.
Set a breakpoint in the global initialization
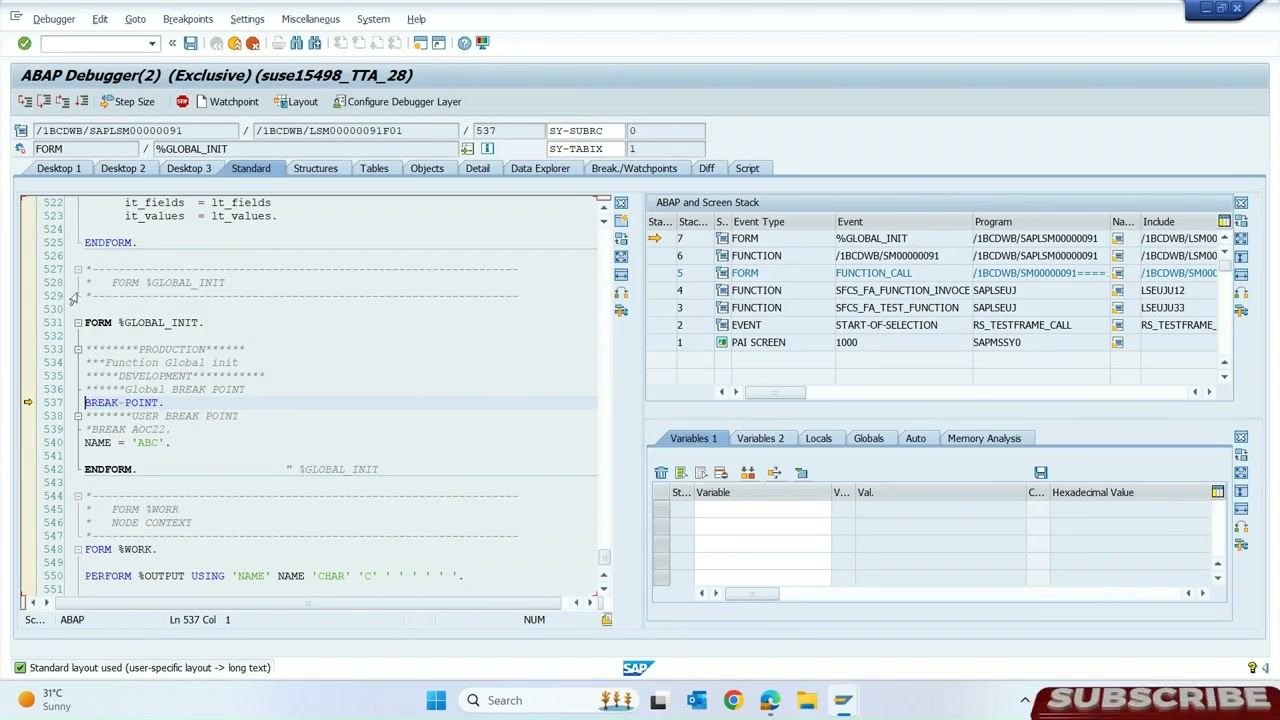
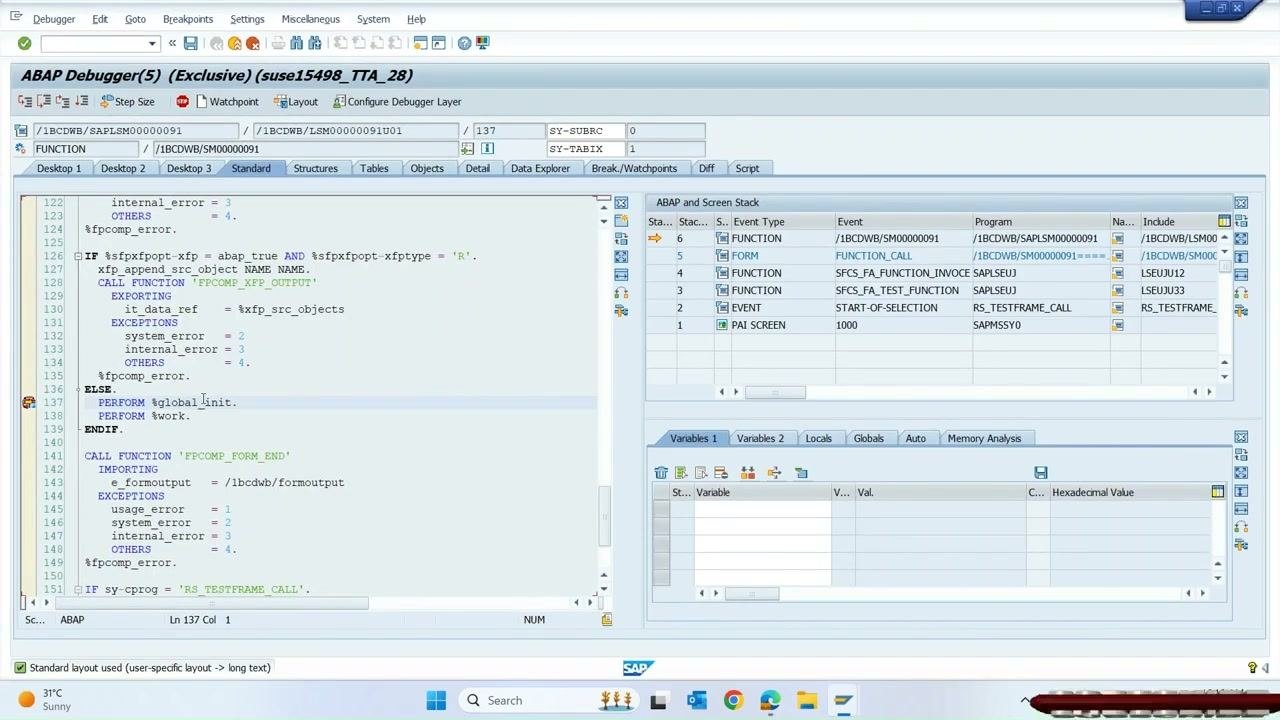
Locate the PERFORM global_init. line or a similar initialization routine, and set a breakpoint at this line. Confirm that the session breakpoint is set. A red marker should appear.
Run the function module with test input
Return to the Test Function Module screen and enter the required input parameters. For example, set NAME = TEST. Then execute the function module.
Verify the breakpoint in the ABAP Debugger
The ABAP Debugger opens when the breakpoint is hit. Confirm that execution stops at the global initialization section, and observe the variable values.
Step through the code and watch the variable change
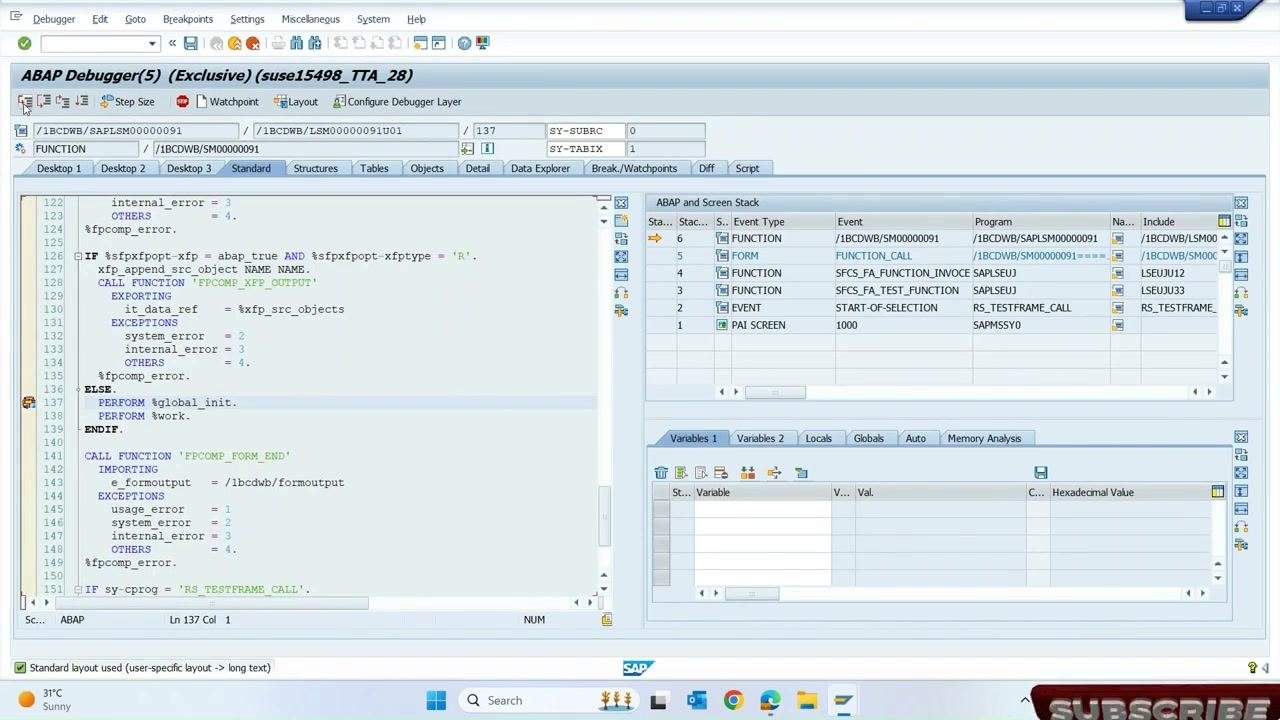
Press F5 to step through the code in the ABAP Debugger. Execution enters your interface, and the variable NAME changes from TEST to ABC. After execution, the value is displayed as ABC. This confirms that debugging works at the interface level.
Summary
You now know how to debug Adobe Forms in SAP even though the SFP Adobe interface does not support direct debugging. You choose a global or user-specific breakpoint, activate it in the interface, set a session breakpoint in the global function module, and step through the code in the ABAP Debugger.
Generation details: cost, quality tiers
Docsie billed 2,500 credits ($1.75) to analyze this 5-minute video at standard quality. The rewrite, template fill and Word/PDF exports were included. The same video at each quality tier:
| Quality | Frames sampled | Credits | Approx. cost |
|---|---|---|---|
| Draft | every 16-30 s | 1,250 | $0.88 |
| Standard (this guide) | every 8-15 s | 2,500 | $1.75 |
| Detailed | every 4-7 s | 5,000 | $3.50 |
| Ultra | every 1-3 s | 10,000 | $7.00 |
Credits priced at $0.70 per 1,000; plans include a monthly allowance. Enterprise customers on on-premise or bring-your-own-model deployments run this on their own inference and pay no per-video credits.
Generated by Docsie Video-to-Docs on 2026-11-15 from a 4-minute video. Screenshots are frames from the source video and belong to their creator, SETUPORG, whose original is embedded above. If you own this video and want the guide removed or credited differently, contact us and we will act within one business day.