
How to View Table Data with SE16N in SAP S/4HANA
This guide explains how to view table data with SE16N in SAP, using customer master general data as a working example. You'll learn how to navigate to transaction SE16N, filter records in the KNA1 table, control the maximum number of hits returned, and customize the output layout so only the columns you need are displayed.
Video: SAP S4 Hana sales | View the table data through t code SE16N by UdayaSAP. All credit for the demonstration goes to the creator; watch the original on YouTube. The written guide below was generated from this video by Docsie. Creator? Request a change or removal.
This guide explains how to view table data with SE16N in SAP, using customer master general data as a working example. You'll learn how to navigate to transaction SE16N, filter records in the KNA1 table, control the maximum number of hits returned, and customize the output layout so only the columns you need are displayed.
Prerequisites
- Access to the SAP GUI with valid login credentials.
- Authorization to use transaction SE16N and view table data.
Log in to SAP
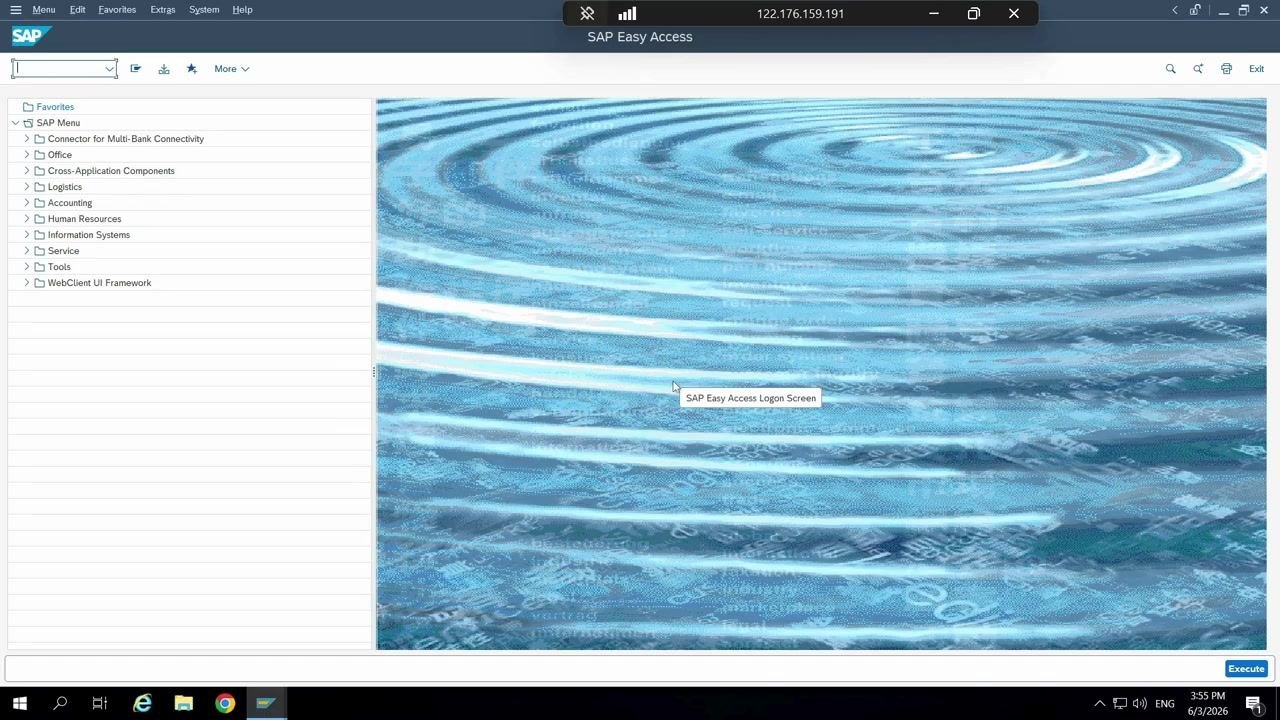
Launch the SAP GUI and log in with your credentials. Wait for the SAP Easy Access screen to appear before proceeding.
Navigate to transaction SE16N
Locate the command field at the top of the SAP Easy Access screen. Type SE16N into the field and press Enter to open the General Table Display transaction.
Enter the table name
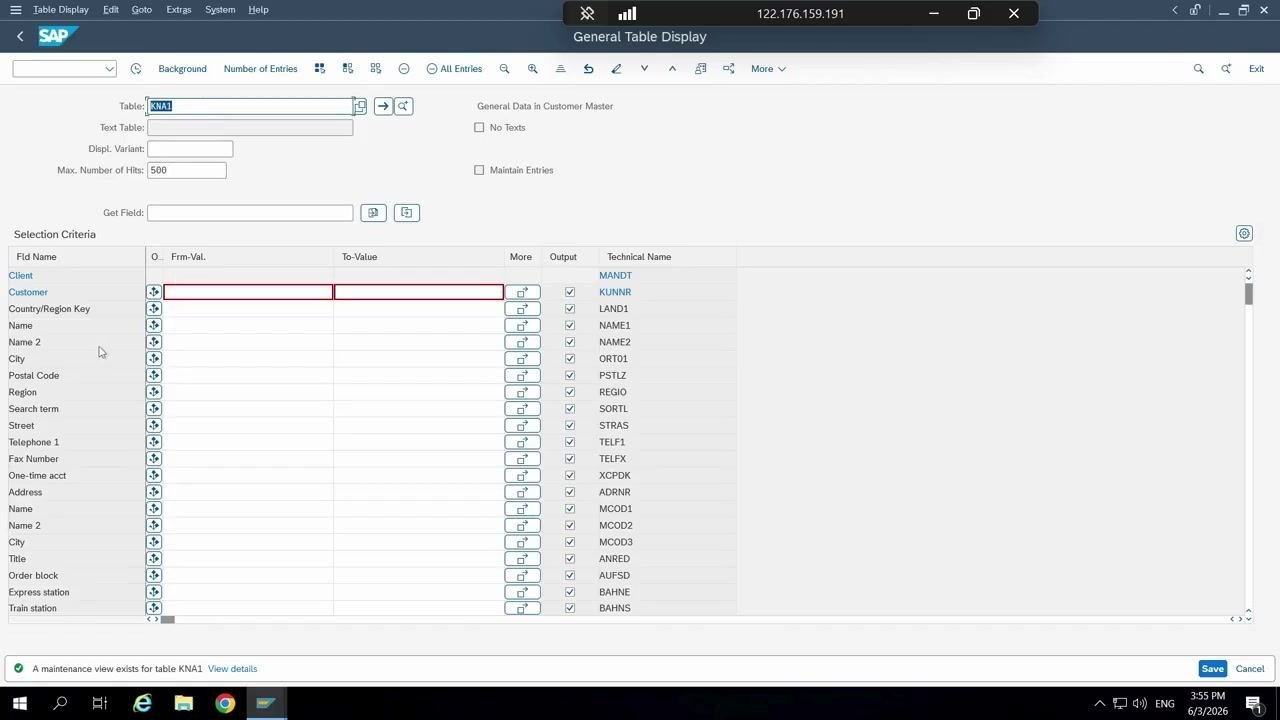
On the General Table Display screen, locate the Table field. Enter KNA1, the table that stores customer master general data, and press Enter to load the table's fields.
Review the default maximum number of hits
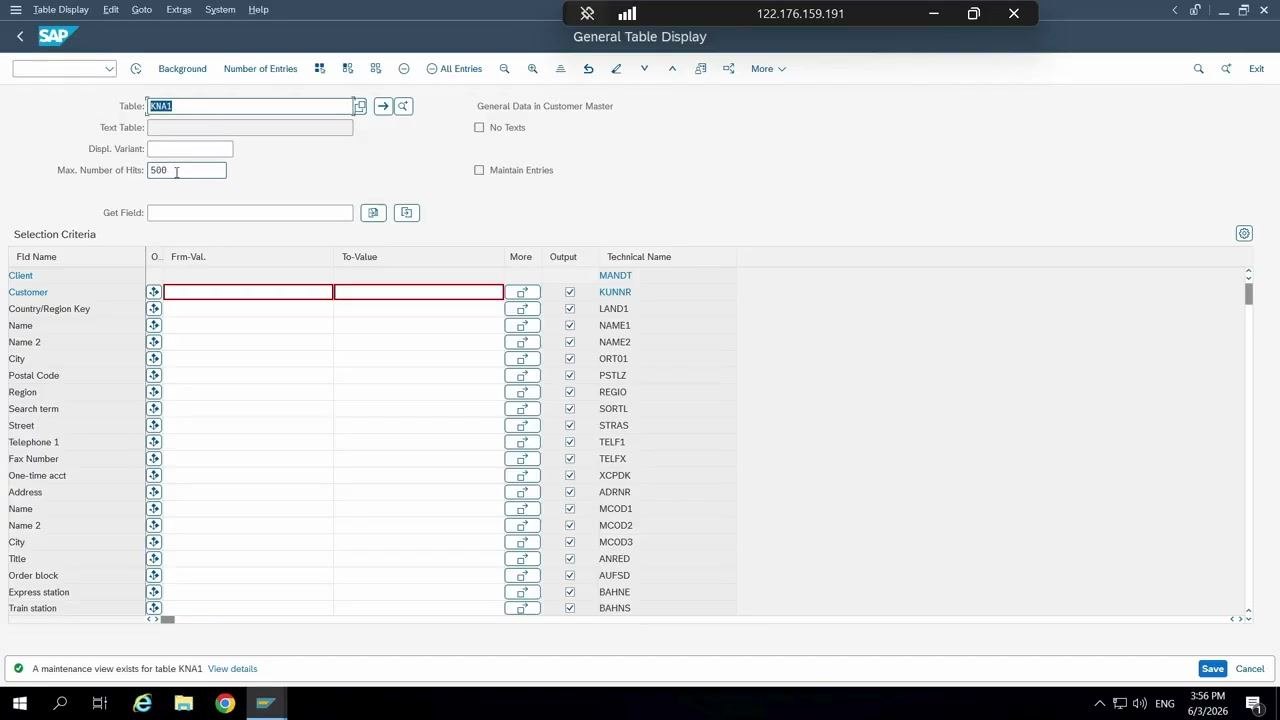
Check the Max. Number of Hits field, which is set to 500 by default. This setting limits the query to display only the first 500 entries when executed.
Adjust or remove the maximum number of hits
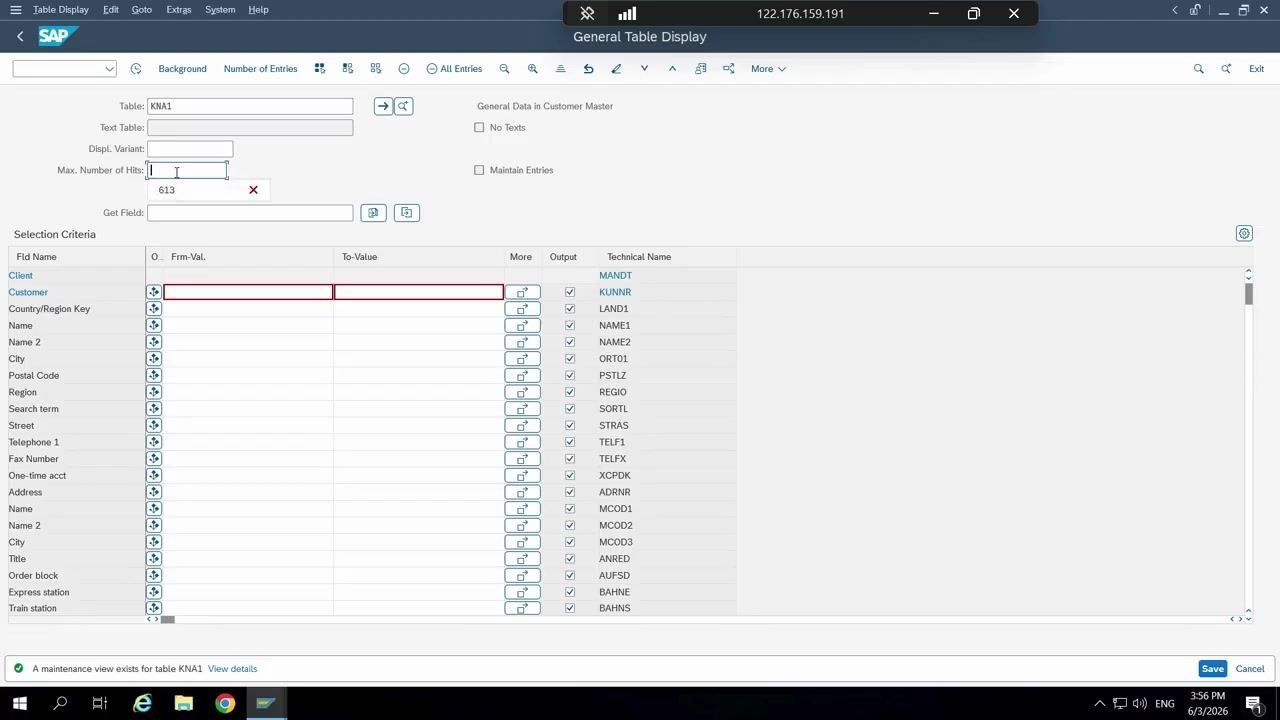
If you want to see all available entries, clear the Max. Number of Hits field by deleting its value. Alternatively, enter a different limit, such as 613, if you prefer to cap the results at a specific number.
Filter data by country
In the selection criteria, locate the Country/Region Key field (technical name: LAND1). Enter IN to filter for customers located in India. This narrows the results to only the customer master records created for that country.
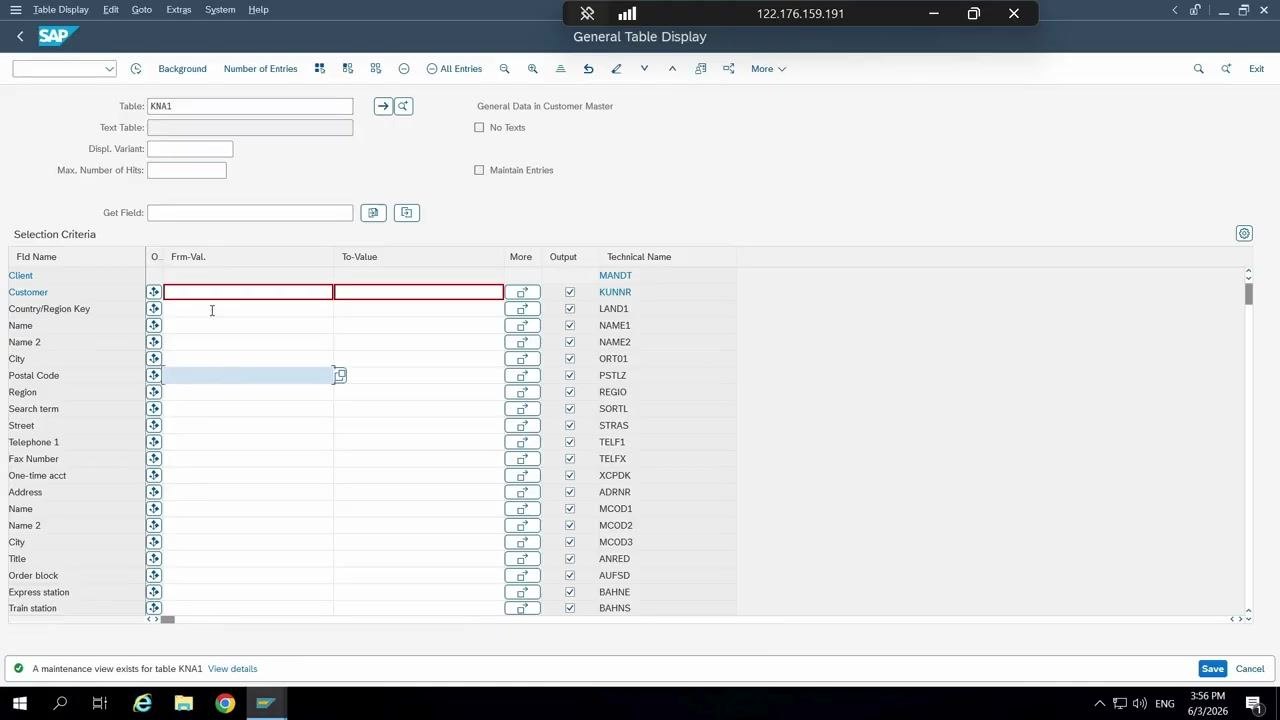
Display the number of filtered entries
Click the Number of Entries button at the top of the General Table Display screen. This shows how many customer records match your filter — in this example, 926 customers are found for India.
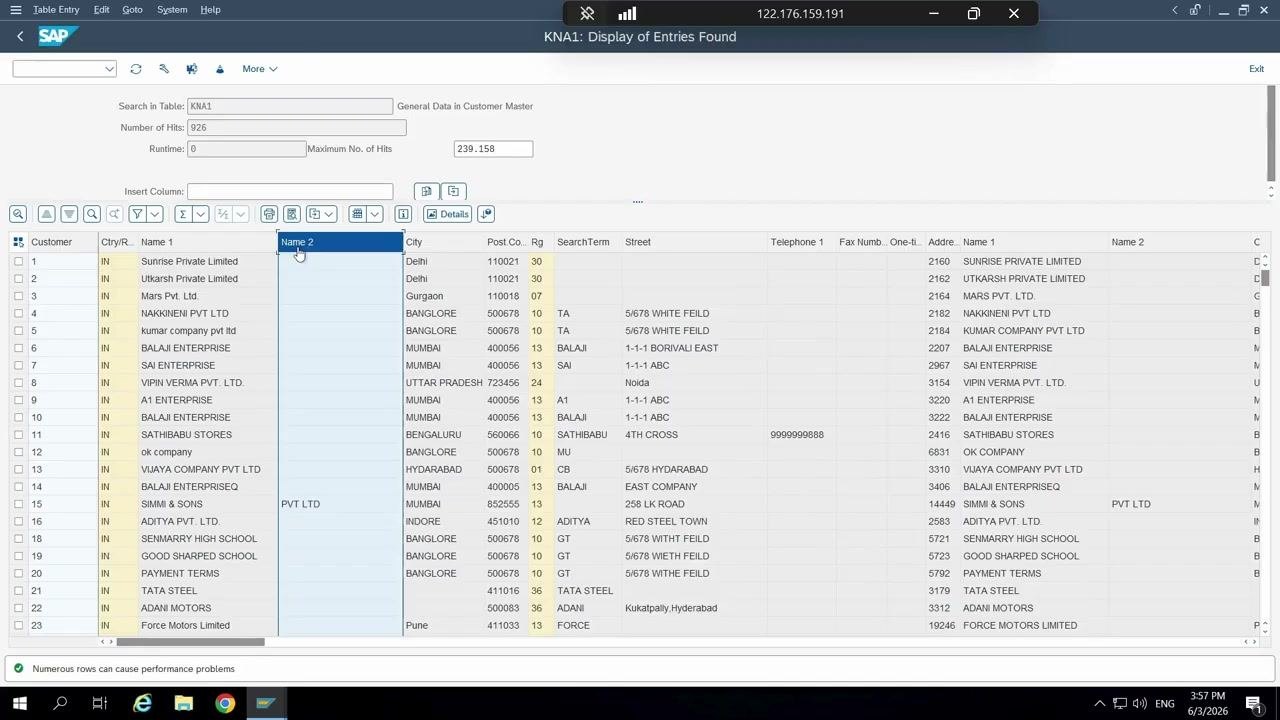
Execute the query to view the data
Press Enter or click Execute to display the filtered customer master data. The system lists all 926 matching entries, letting you review the number of records and the columns shown.
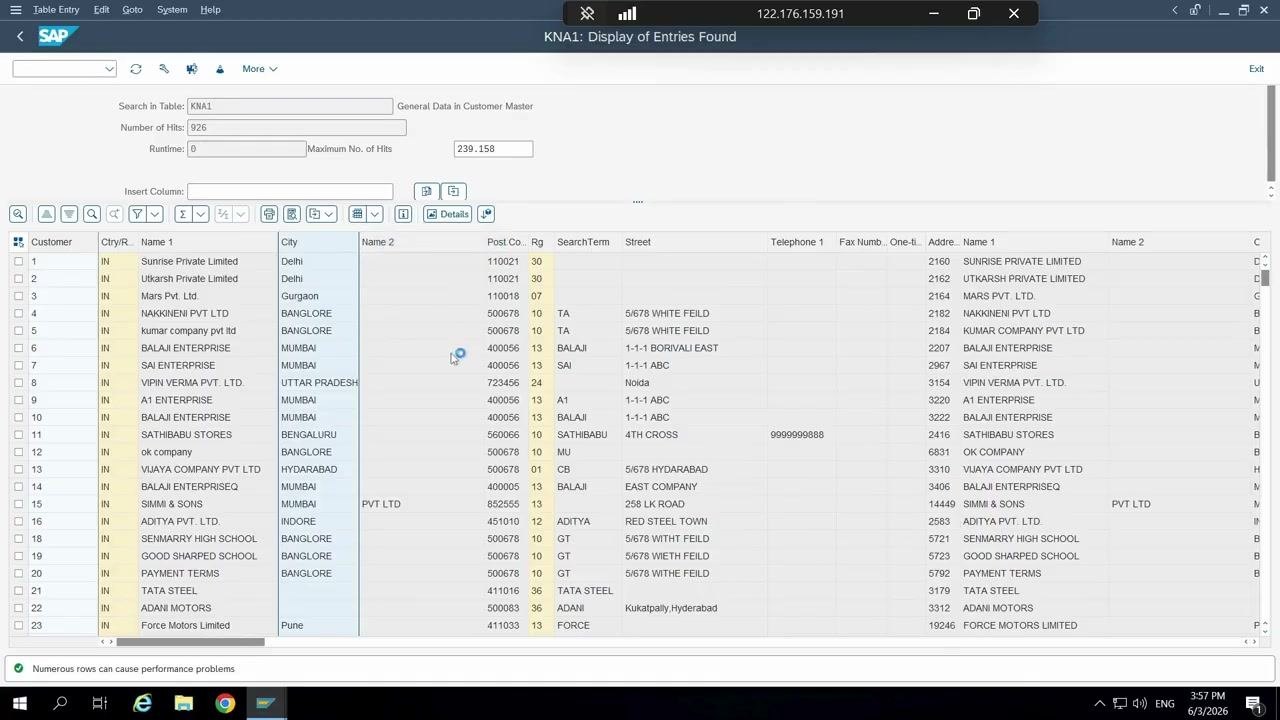
Rearrange or filter columns in the output
You can customize which columns appear in two ways:
- Drag and drop columns directly in the output table to rearrange their order.
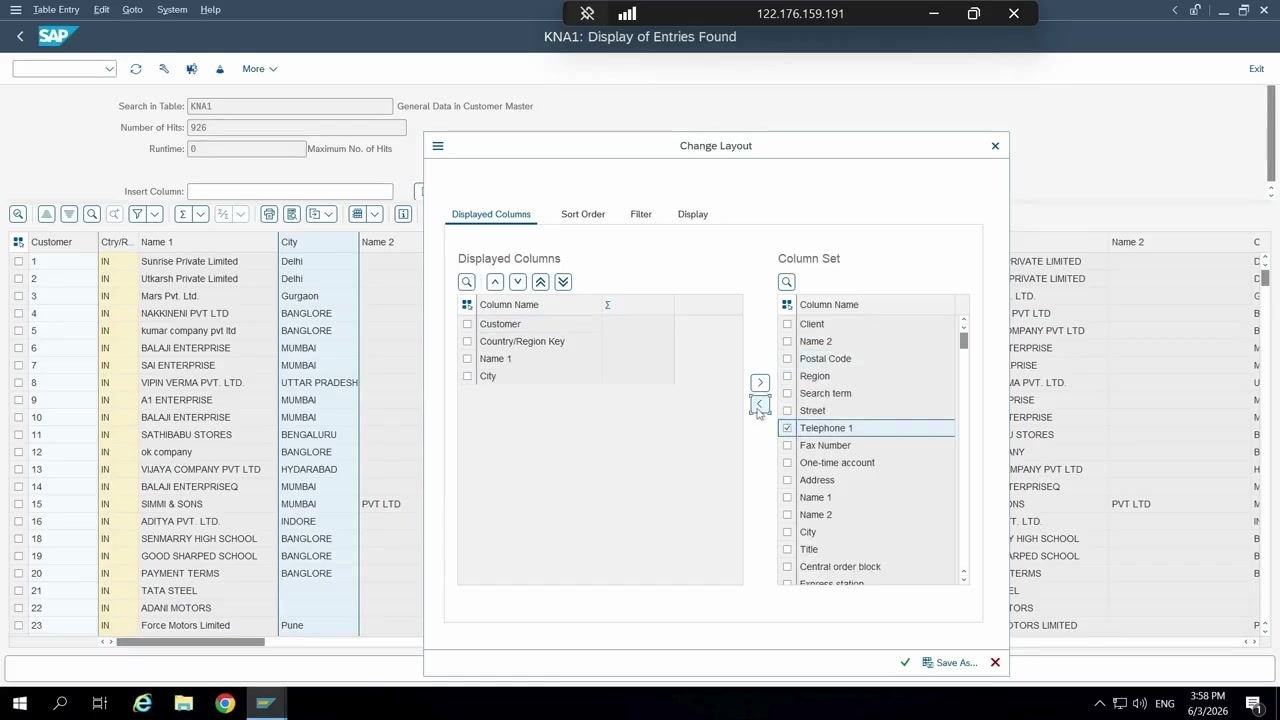
- Click Change Layout (represented by a layout or settings icon) to open the layout customization dialog.
Select only the required columns
In the Change Layout dialog, under the Displayed Columns tab, move the columns you don't need to the right-hand Column Set. Then select only the columns you want to keep, such as:
- Customer
- Country/Region Key
- Name 1
- City
- Telephone 1
Move these selected columns to the left-hand Displayed Columns list to include them in your output.
Finalize and apply the layout
After selecting the required columns, click Adopt (Enter) (the checkmark icon) to apply the new layout. The output table now displays only the selected columns, making the data easier to review and export.
Summary
You've learned how to view table data with SE16N in SAP by navigating to the transaction, entering a table name, applying selection filters, managing the maximum number of hits, and customizing the output layout. These steps let you quickly locate and display only the customer master data relevant to your needs, using the KNA1 table as an example.
Generation details: cost, quality tiers
Docsie billed 2,000 credits ($1.40) to analyze this 4-minute video at standard quality. The rewrite, template fill and Word/PDF exports were included. The same video at each quality tier:
| Quality | Frames sampled | Credits | Approx. cost |
|---|---|---|---|
| Draft | every 16-30 s | 1,000 | $0.70 |
| Standard (this guide) | every 8-15 s | 2,000 | $1.40 |
| Detailed | every 4-7 s | 4,000 | $2.80 |
| Ultra | every 1-3 s | 8,000 | $5.60 |
Credits priced at $0.70 per 1,000; plans include a monthly allowance. Enterprise customers on on-premise or bring-your-own-model deployments run this on their own inference and pay no per-video credits.
Generated by Docsie Video-to-Docs on 2026-10-06 from a 3-minute video. Screenshots are frames from the source video and belong to their creator, UdayaSAP, whose original is embedded above. If you own this video and want the guide removed or credited differently, contact us and we will act within one business day.