
How to Run a SQL Query in Oracle Fusion
You can run a SQL query in Oracle Fusion Cloud by using the built-in Reports and Analytics tools, so you don't need a third-party database tool. This guide shows you how to create a SQL Query data set in a Data Model, select a data source, extract journal header data, and preview the results. It also shows you how to view the output in Tree View and Table View.
Video: How to run SQL Query in Oracle Fusion|Oracle Cloud ERP by MY TECHNO JOURNAL (2022). All credit for the demonstration goes to the creator; watch the original on YouTube. The written guide below was generated from this video by Docsie. Creator? Request a change or removal.
You can run a SQL query in Oracle Fusion Cloud by using the built-in Reports and Analytics tools, so you don't need a third-party database tool. This guide shows you how to create a SQL Query data set in a Data Model, select a data source, extract journal header data, and preview the results. It also shows you how to view the output in Tree View and Table View.
Prerequisites
Before you begin, make sure you have:
- Access to Oracle Fusion Cloud (SaaS) and the credentials to log in.
- The exact backend table and column names for the data you want to extract, for example for the GL, AP, or Procurement modules. You need them to build an accurate, working query.
Steps
Log in to Oracle Fusion Cloud
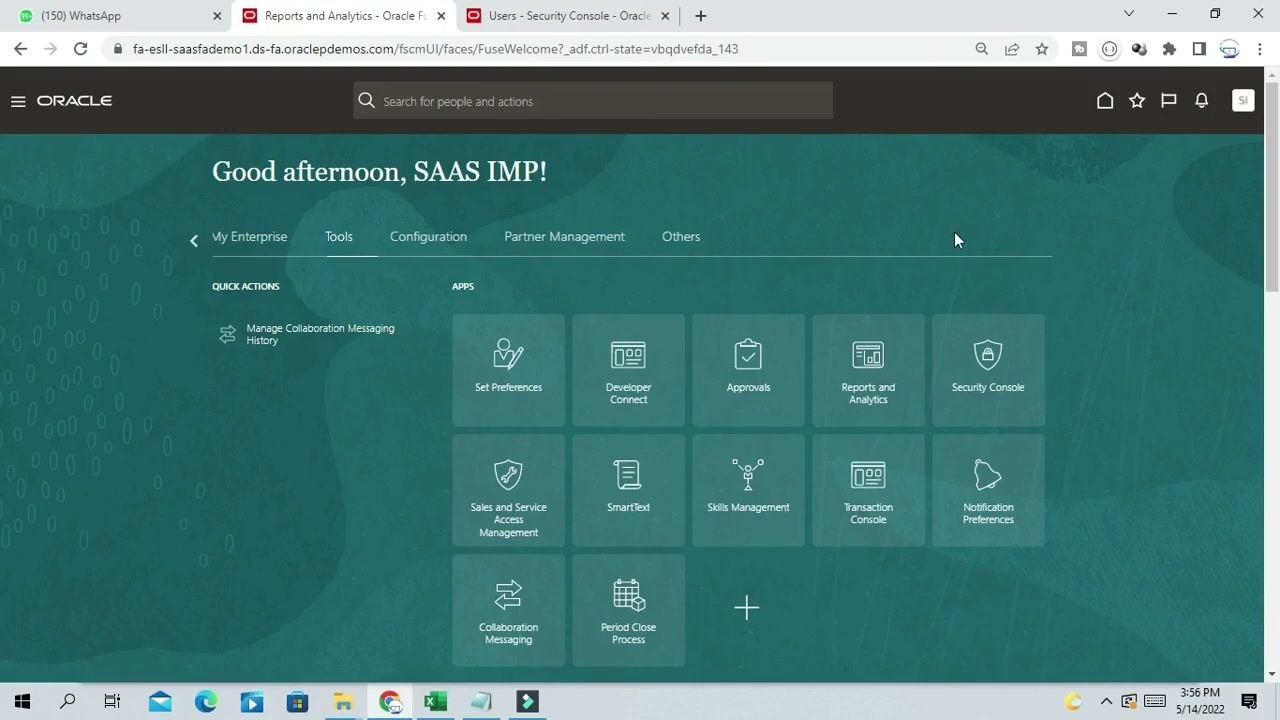
Log in and confirm that you are on the main dashboard. The screen shows a welcome message, such as "Good afternoon, SAAS IMP!", and a set of application tiles.
Open Reports and Analytics from the Tools tab
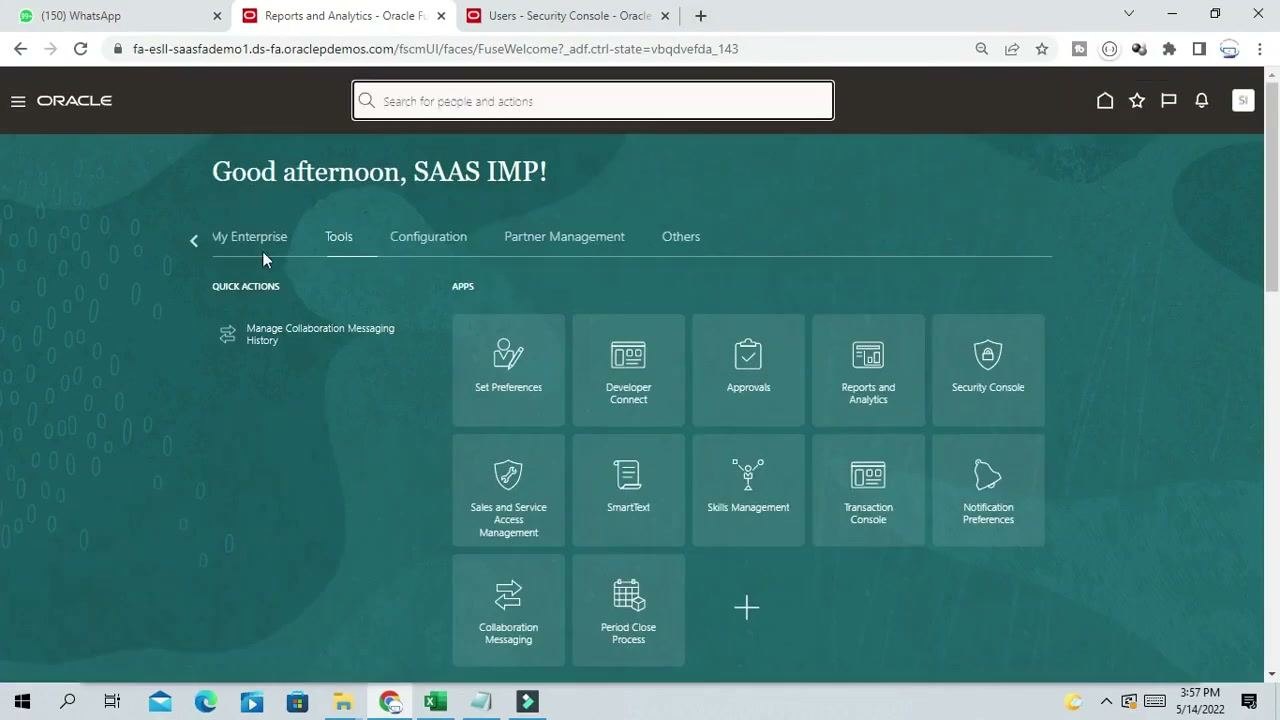
At the top of the dashboard, click the Tools tab. The application tiles appear under the "APPS" section. Find the Reports and Analytics tile and click it.
Start creating a new report
In the Reports and Analytics window, click the Create button on the left side of the screen. A dropdown menu shows two options: Report and Analysis. Click Report.
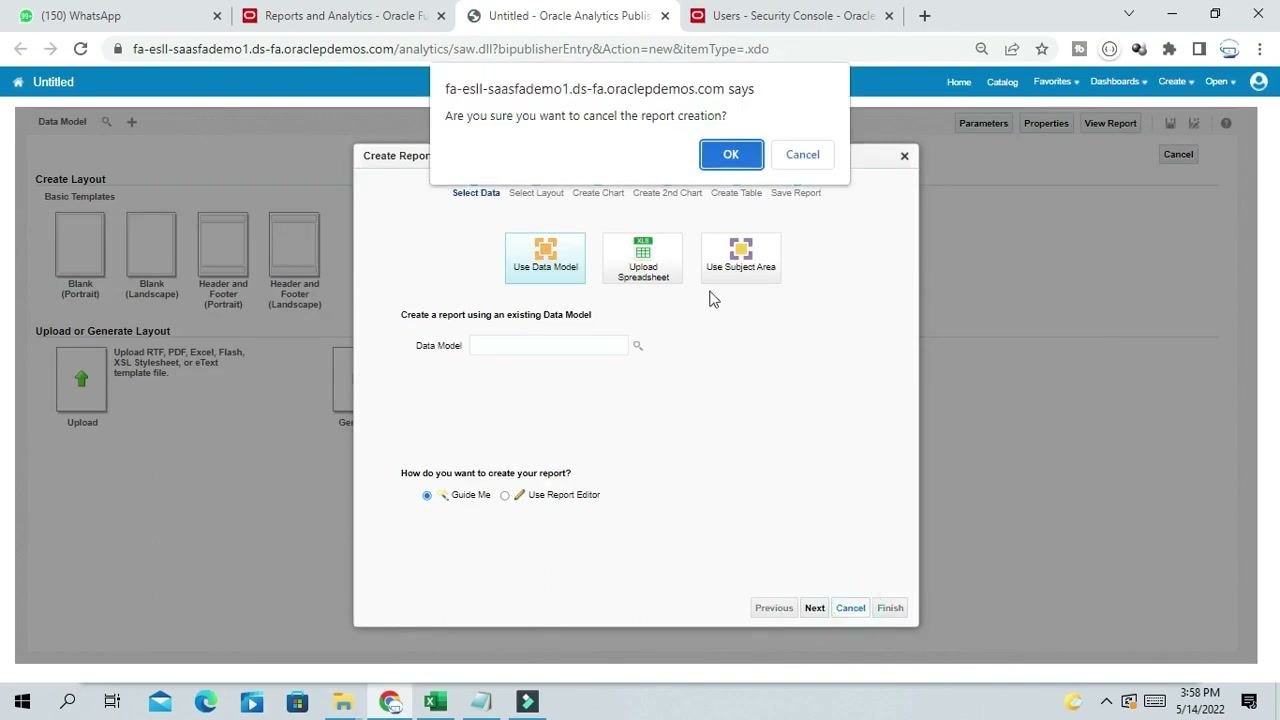
After you select Report, a new window opens and displays the Data Model screen. If you don't want to create a data model at this time, you can cancel the operation.
Cancel the default report creation
To continue with a custom Data Model, cancel the default report creation. When the system asks "Are you sure you want to cancel the report creation?", click OK.
Add a new data set on the Data Model screen
After you cancel, the Data Model screen opens. It shows layout options (Blank Portrait, Blank Landscape, Header and Footer) and options to upload or generate a layout. Locate the Data Model section at the top left and click the plus (+) button next to "Data Model".
A "Processing" dialog with "Loading" appears briefly while the system loads the Data Model properties. Wait until it disappears before you interact with the screen.
Add a SQL Query data set
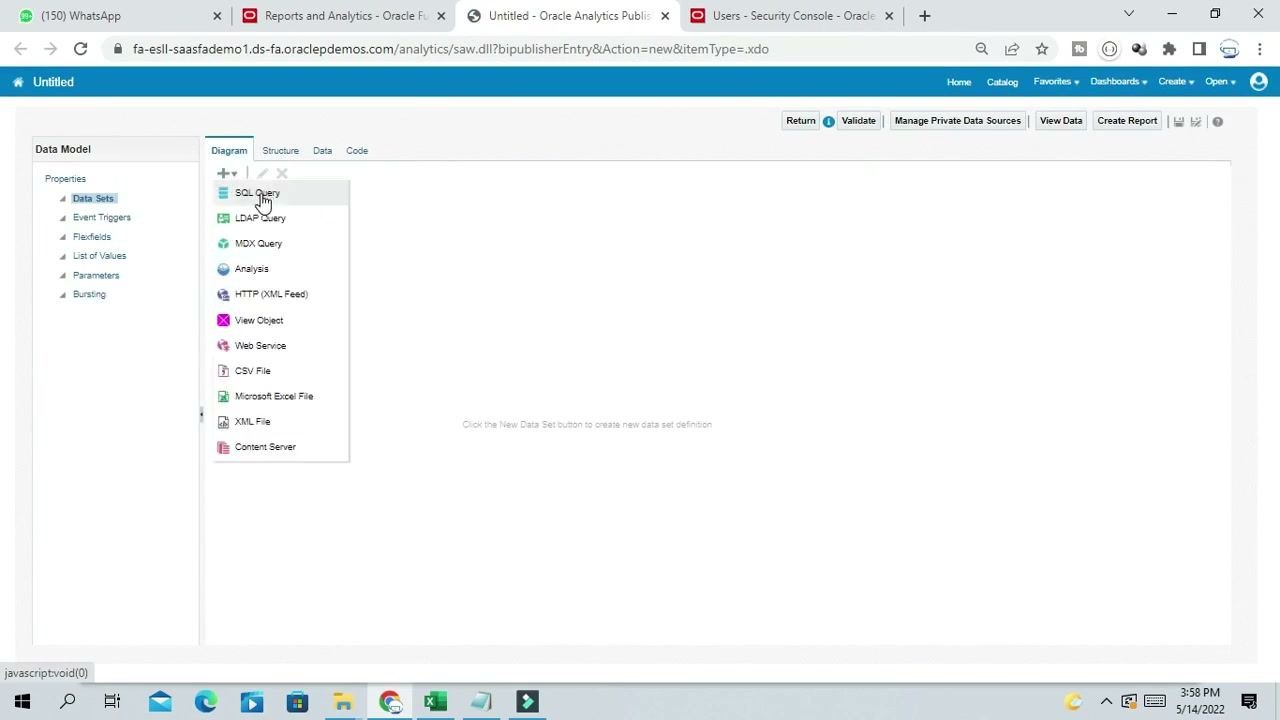
Make sure the Diagram tab is selected. In the left pane, click the plus (+) button under "Data Sets", and then select SQL Query from the dropdown menu.
Name the data set and set the SQL type
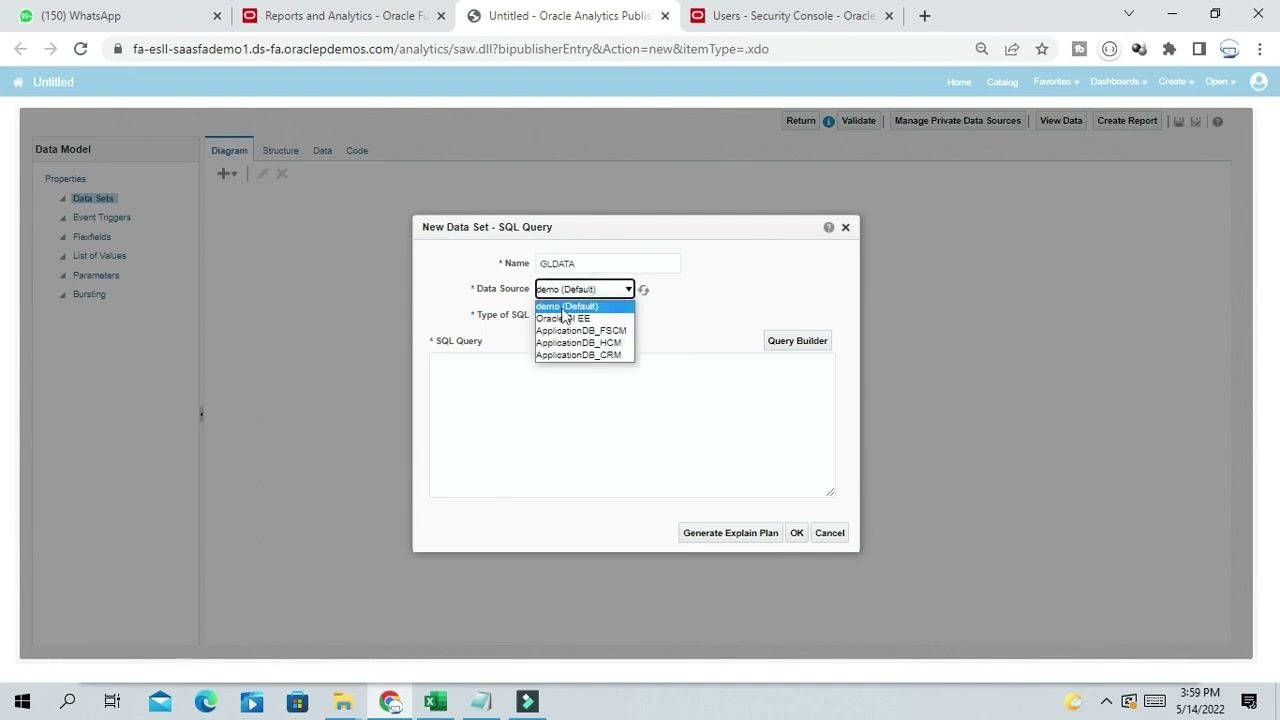
In the "New Data Set - SQL Query" dialog, enter the following details:
- Name: Enter a descriptive name. For example, type
GLDATAif you are extracting General Ledger data. - Data Source: Select the data source that matches your module (see the next step).
- Type of SQL: Leave it as
Standard SQLunless you need something else. - SQL Query: Leave this field blank for now. You enter the query in a later step.
Select the data source for your module
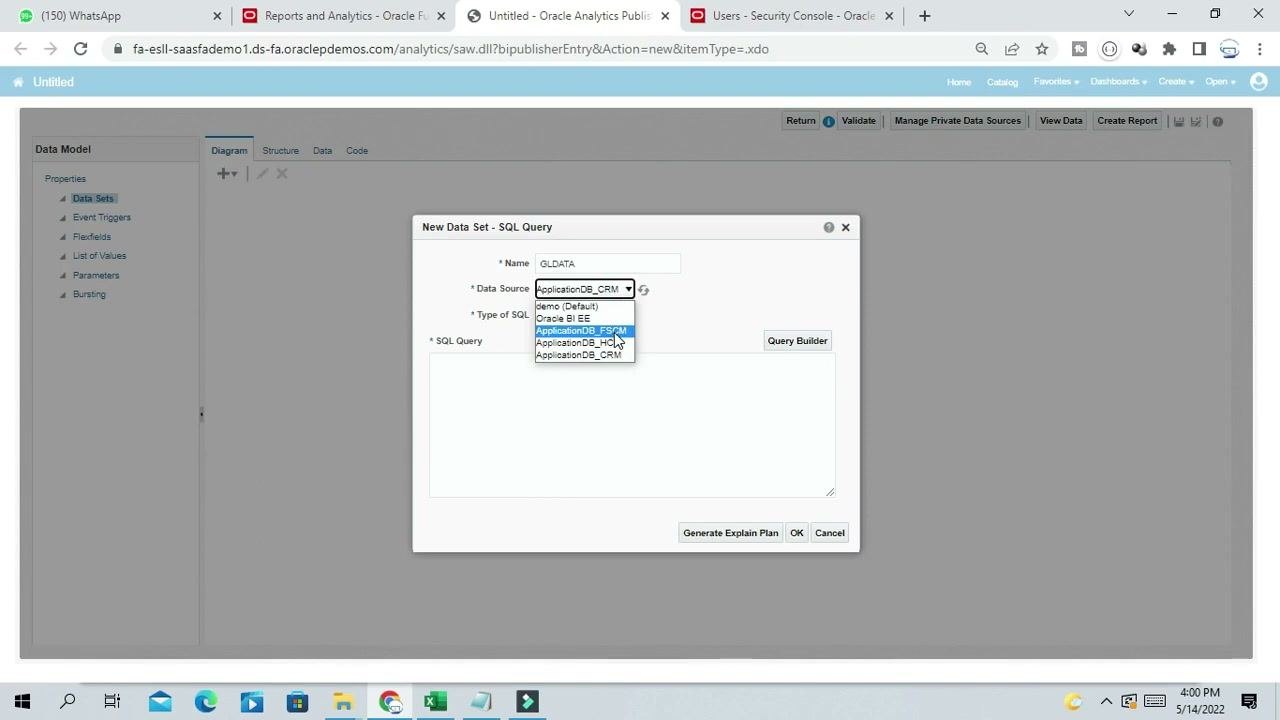
Open the Data Source dropdown and review the available options:
demo (Default)Oracle BI EEApplicationDB_FSCM(Finance/GL modules)ApplicationDB_HCM(Human Capital Management)ApplicationDB_CRM(Customer Relationship Management)
To extract data from Finance GL modules, select ApplicationDB_FSCM.
Enter the SQL query
In the SQL Query field, enter your SQL statement. For example, to extract all journal information from the journal header table, type:
SELECT * FROM GL_JE_HEADERS
Make sure the query references the correct table and columns for your reporting needs.
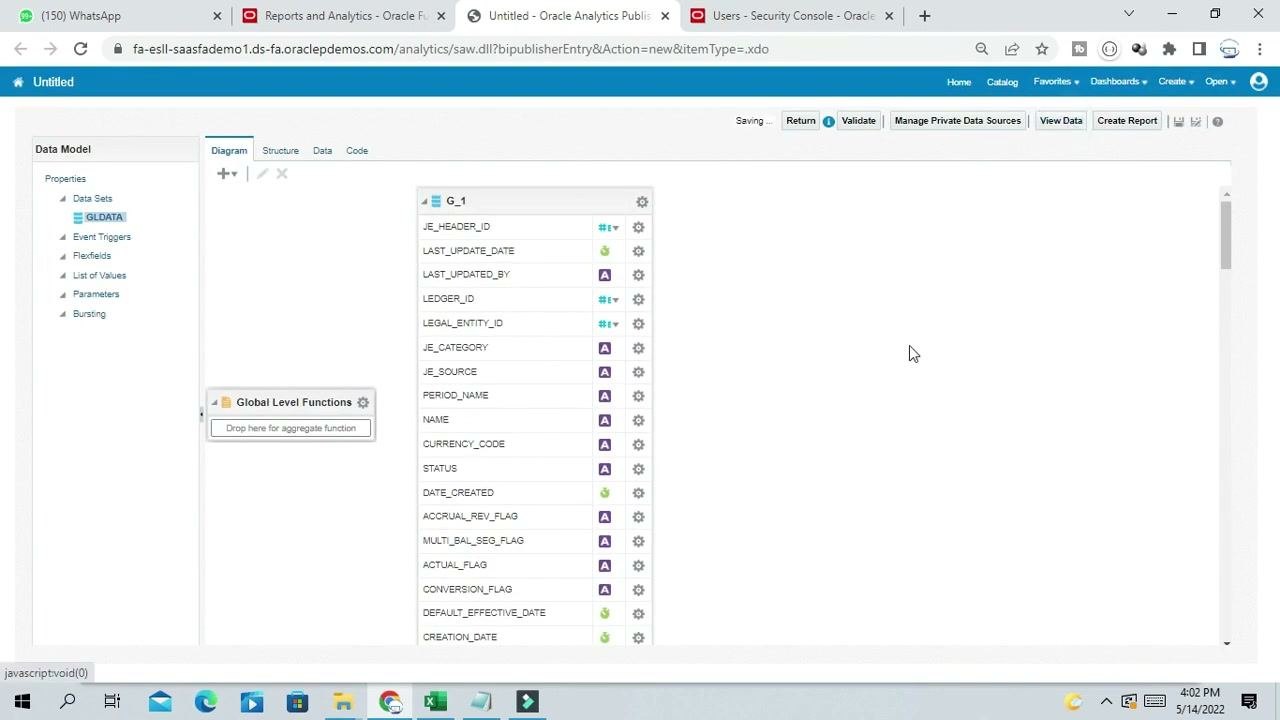
Review the available columns
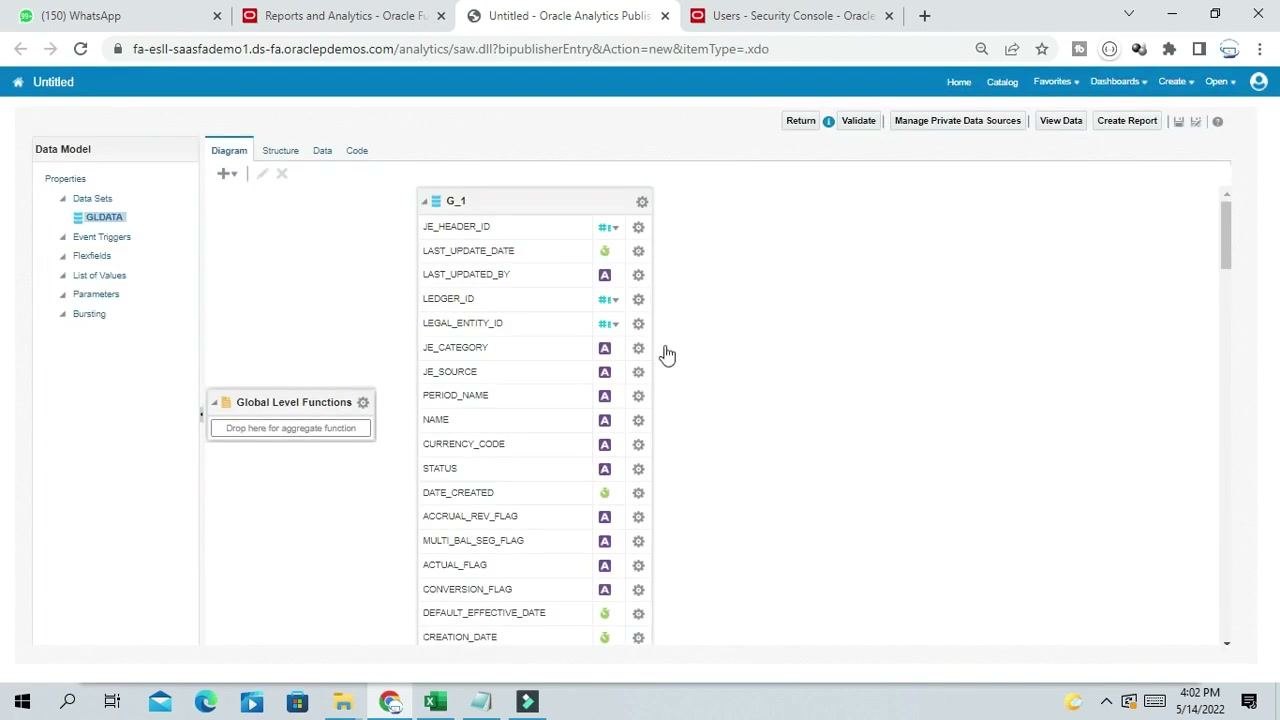
After you enter and confirm the query, the Diagram tab lists all columns from the GL_JE_HEADERS table in the GLDATA data set. They include:
- JE_HEADER_ID
- LAST_UPDATE_DATE
- LEDGER_ID
- LEGAL_ENTITY_ID
- JE_CATEGORY
- JE_SOURCE
- PERIOD_NAME
- NAME
- CURRENCY_CODE
- STATUS
- DATE_CREATED
More columns appear in the diagram.
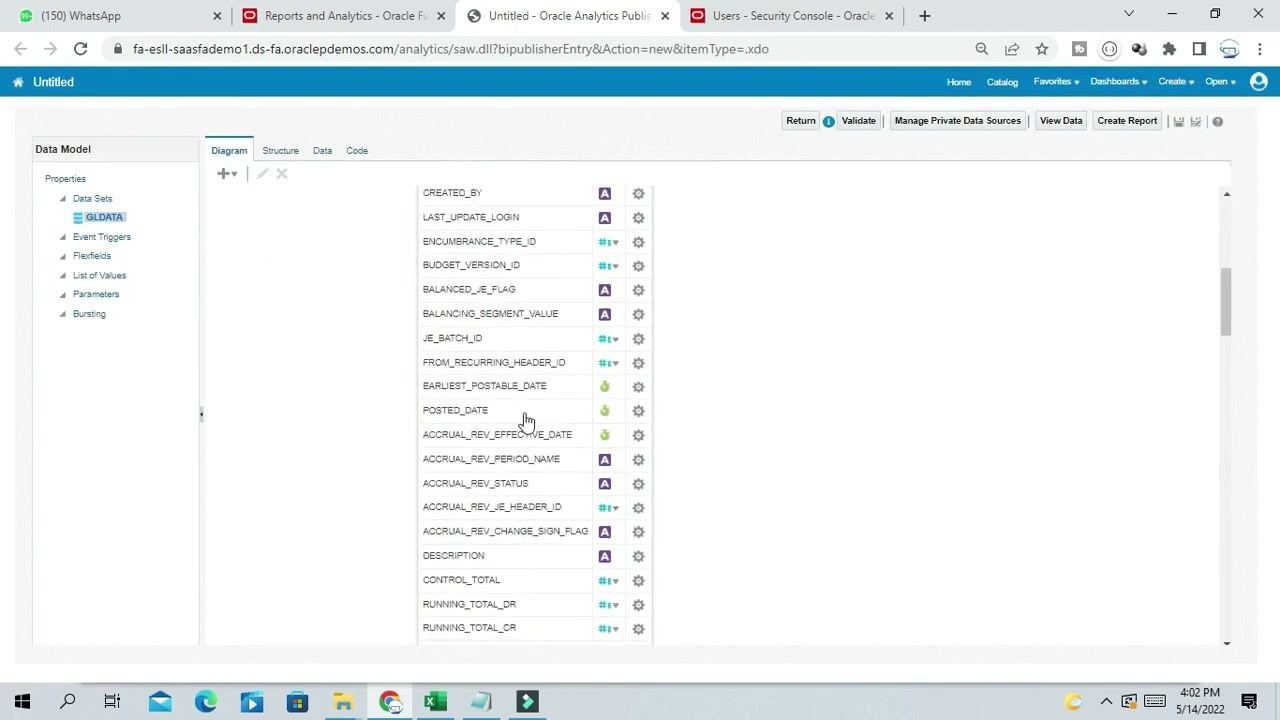
Scroll to see additional columns
Use the scroll bar to review every column in the data set. Make sure you identify all the fields that are relevant to your report.
Run the SQL query and preview the data with View Data
Click the View Data button at the top right of the Data Model screen to preview the results of your SQL query. Use the preview to verify that the correct data is extracted before you move on to a report layout or further configuration.
Open the Data tab
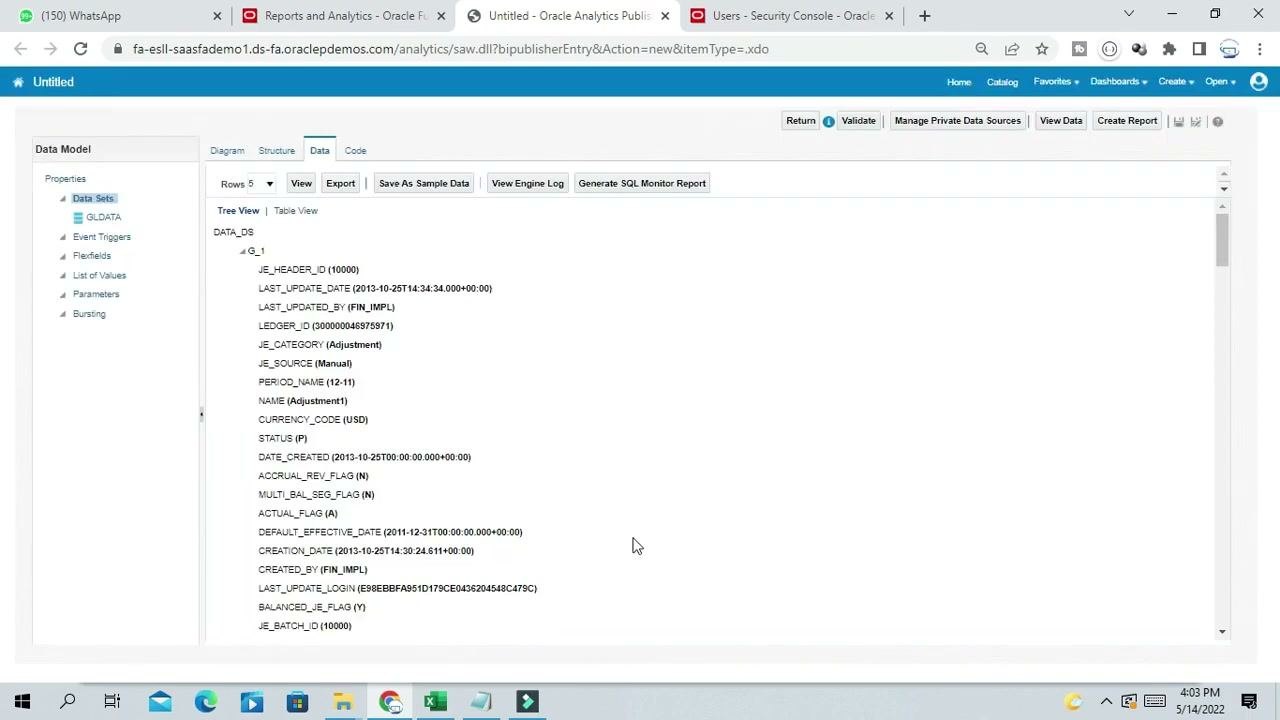
Go to the Data tab. The "Data Model" panel is on the left, with "Data Sets" expanded to show "GLDATA". The main area offers Rows, View, Export, Save As Sample Data, View Engine Log, and Generate SQL Monitor Report. The default view is "Tree View", and "Table View" is also available.
Read the results in Tree View
The query results load in a hierarchical structure under "DATA_DS". For example, the first record shows these fields and values:
- JE_HEADER_ID (10000)
- LAST_UPDATE_DATE (2013-10-25T14:34:34.000+00:00)
- LAST_UPDATED_BY (FIN_IMPL)
- LEDGER_ID (300000004675971)
- JE_CATEGORY (Adjustment)
- JE_SOURCE (Manual)
- PERIOD_NAME (12-11)
- NAME (Adjustment1)
- CURRENCY_CODE (USD)
- STATUS (P)
- DATE_CREATED (2013-10-25T00:00:00.000+00:00)
More fields and values are visible in the tree.
Switch to Table View
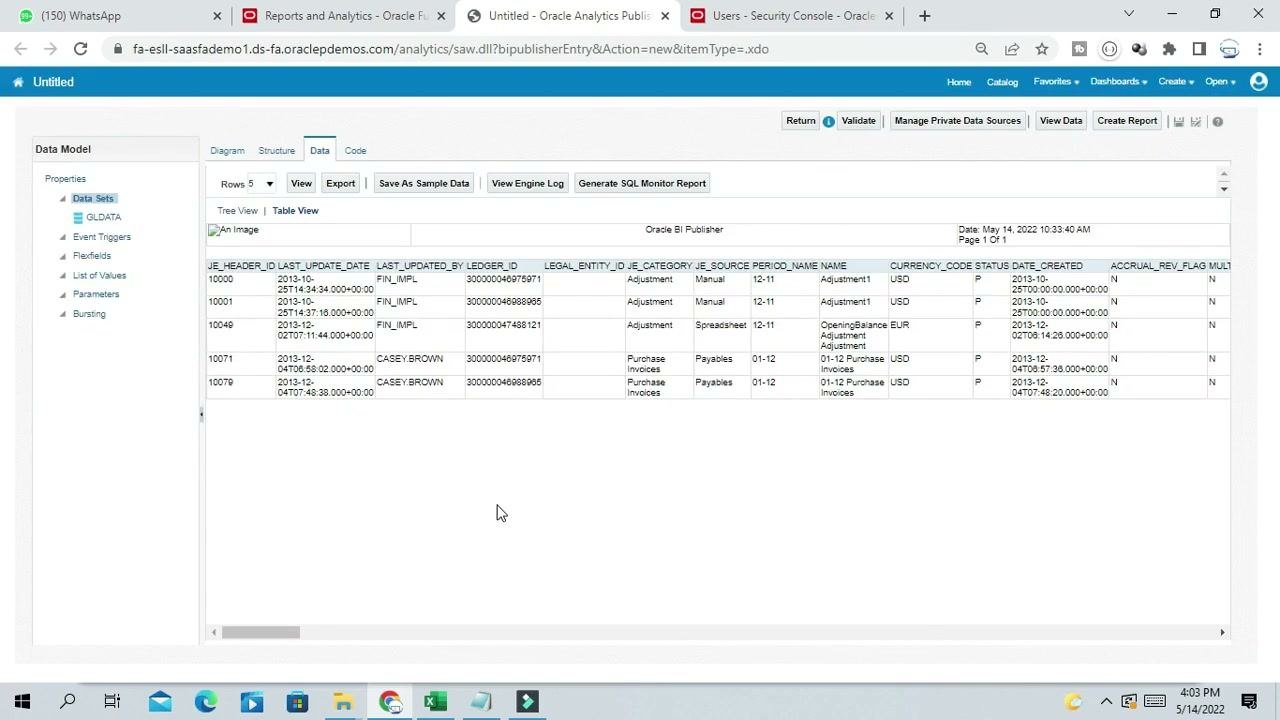
Click the Table View link next to "Tree View" to see the results in a table.
The table shows these columns:
- JE_HEADER_ID
- LAST_UPDATE_DATE
- LAST_UPDATED_BY
- LEDGER_ID
- LEGAL_ENTITY_ID
- JE_CATEGORY
- JE_SOURCE
- PERIOD_NAME
- NAME
- CURRENCY_CODE
- STATUS
- DATE_CREATED
- ACCRUAL_REV_FLAG
- MULTI_BAL_SEG_FLAG
Each row is a record from the journal header table. Sample rows look like this:
- 10000, 2013-10-25T14:34:34.000+00:00, FIN_IMPL, 300000004675971, Adjustment, Manual, 12-11, Adjustment1, USD, P, 2013-10-25T00:00:00.000+00:00, N, N
- 10001, 2013-10-25T14:37:16.000+00:00, FIN_IMPL, 300000004689865, Adjustment, Manual, 12-11, Adjustment1, USD, P, 2013-10-25T00:00:00.000+00:00, N, N
- 10046, 2012-11-14T14:00:00.000+00:00, FIN_IMPL, 300000004748121, Adjustment, Spreadsheet, 12-11, OpeningBalance Adjustment, EUR, P, 2013-10-25T00:00:00.000+00:00, N, N
- 10071, 2013-12-04T06:58:02.000+00:00, CASEY.BROWN, 300000004675971, Purchase Invoices, Payables, 01-12, 01-12 Purchase Invoices, USD, P, 2013-12-04T07:48:20.000+00:00, N, N
- 10070, 2013-12-04T07:48:33.000+00:00, CASEY.BROWN, 300000004689865, Purchase Invoices, Payables, 01-12, 01-12 Purchase Invoices, USD, P, 2013-12-04T07:48:20.000+00:00, N, N
Show more records
To see more data, open the Rows dropdown and choose a higher number. The default is Rows 5, and you can increase it as needed.
Export the data
To export the data, click the Export button above the data table. This area also offers Save As Sample Data, View Engine Log, and Generate SQL Monitor Report.
Return or validate the data model
When you are finished, use the Return or Validate buttons at the top to go back to the main menu or to validate your data model.
Summary
You now know how to run a SQL query in Oracle Fusion Cloud. You created a SQL Query data set, selected the ApplicationDB_FSCM data source, extracted journal header data with SELECT * FROM GL_JE_HEADERS, reviewed the columns, and previewed the results in Tree View and Table View.
What's next
You can refine your data set, or continue to report layout creation, using the same Data Model.
Generation details: cost, quality tiers
Docsie billed 3,500 credits ($2.45) to analyze this 7-minute video at standard quality. The rewrite, template fill and Word/PDF exports were included. The same video at each quality tier:
| Quality | Frames sampled | Credits | Approx. cost |
|---|---|---|---|
| Draft | every 16-30 s | 1,750 | $1.22 |
| Standard (this guide) | every 8-15 s | 3,500 | $2.45 |
| Detailed | every 4-7 s | 7,000 | $4.90 |
| Ultra | every 1-3 s | 14,000 | $9.80 |
Credits priced at $0.70 per 1,000; plans include a monthly allowance. Enterprise customers on on-premise or bring-your-own-model deployments run this on their own inference and pay no per-video credits.
Generated by Docsie Video-to-Docs on 2026-11-15 from a 6-minute video. Screenshots are frames from the source video and belong to their creator, MY TECHNO JOURNAL, whose original is embedded above. If you own this video and want the guide removed or credited differently, contact us and we will act within one business day.