
How to Create a BI Publisher Report in Oracle Fusion
This guide walks you through how to create a BI Publisher report in Oracle Fusion, starting from logging in to the application through building a data model with a SQL query, generating an RTF layout, and locating your finished report in the catalog. By the end of this guide, you will have a working data model and a saved report that you can run and manage from the Oracle Fusion catalog.
Video: How to create a BI Publisher report | Oracle Fusion for beginner | Oracle ERP by Oracle Fusion Technical. All credit for the demonstration goes to the creator; watch the original on YouTube. The written guide below was generated from this video by Docsie. Creator? Request a change or removal.
This guide walks you through how to create a BI Publisher report in Oracle Fusion, starting from logging in to the application through building a data model with a SQL query, generating an RTF layout, and locating your finished report in the catalog. By the end of this guide, you will have a working data model and a saved report that you can run and manage from the Oracle Fusion catalog.
Prerequisites
- Access to an Oracle Fusion Applications Cloud instance with a valid User ID and password.
- Permissions to create and save data models and reports in Reports and Analytics.
- A SQL query ready to use as the data source for your report.
Log in to Oracle Fusion Applications Cloud
Open your web browser and navigate to your Oracle Fusion instance login page. Enter your User ID in the provided field, then enter your password and click the login button.
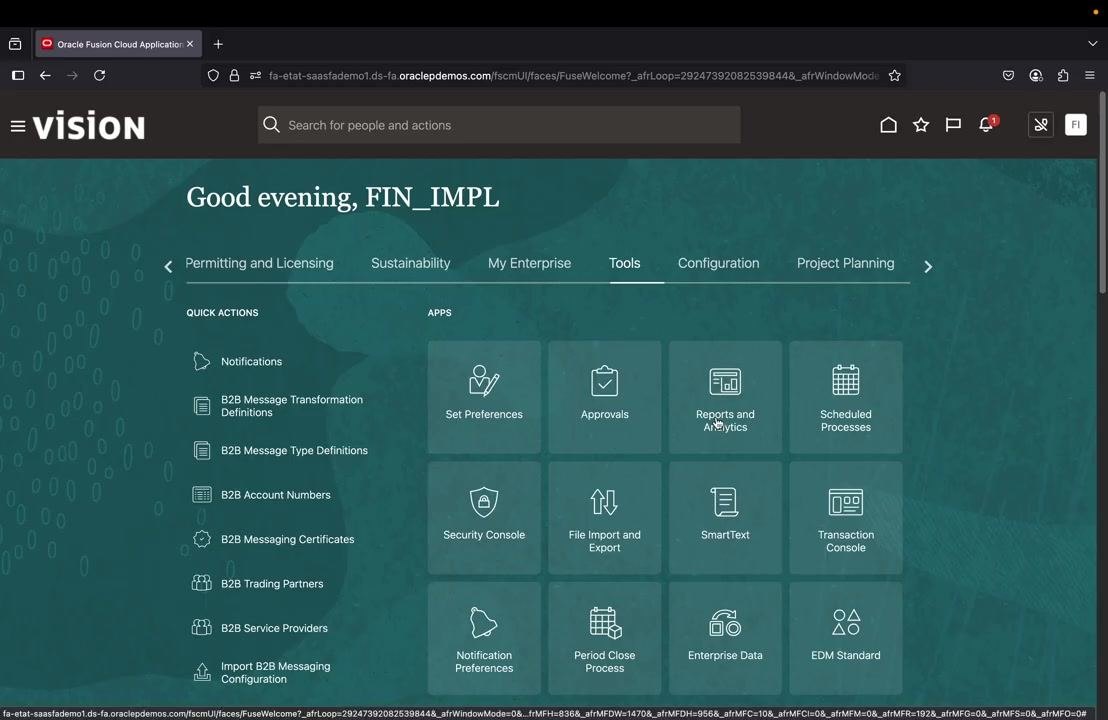
Confirm the home screen
After logging in, you land on the Oracle Fusion home screen. Confirm you are on the correct page by checking for a greeting message such as "Good evening, [Your User ID]."
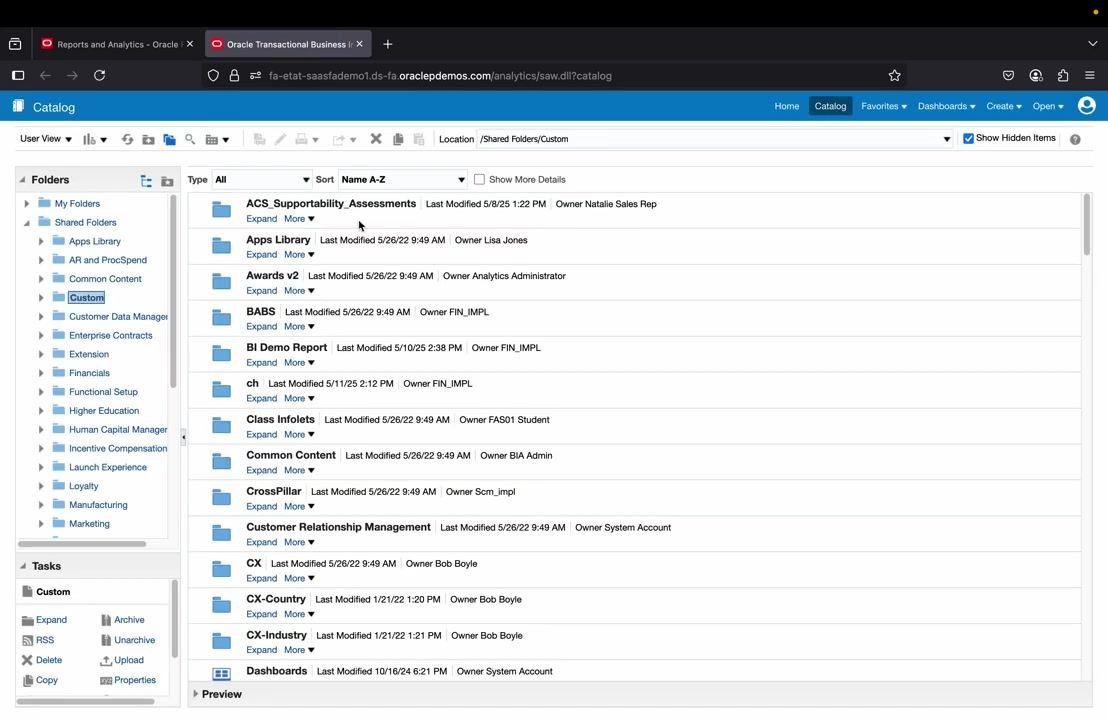
Open Reports and Analytics
On the home screen, locate the top navigation bar and click the Tools tab to expand the available applications. In the Tools section, find and click the Reports and Analytics tile.
Browse the catalog and select Data Model
Click Browse Catalog to open the catalog screen, which displays a list of folders and available reports and data models. In the left sidebar, under "Published Reporting," click Data Model to begin creating a new one.
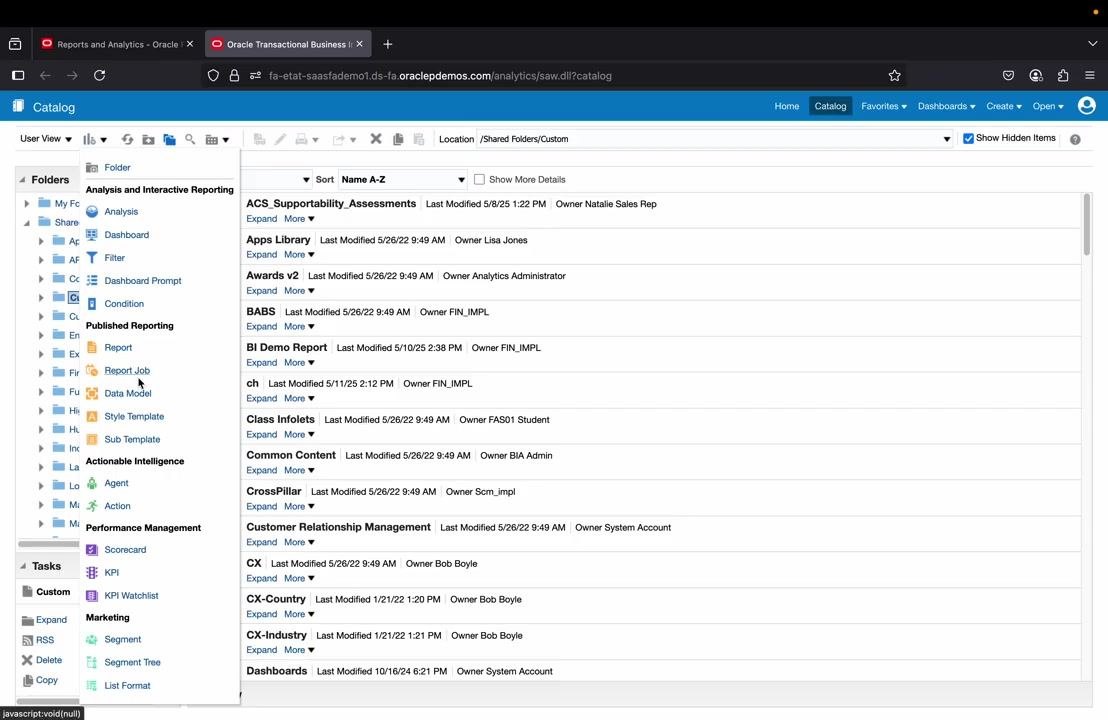
Add a new SQL Query data set
In the Data Model editor, click the plus (+) icon to add a new data set, then select SQL Query from the dropdown menu as the data set type.
Configure the SQL Query data set
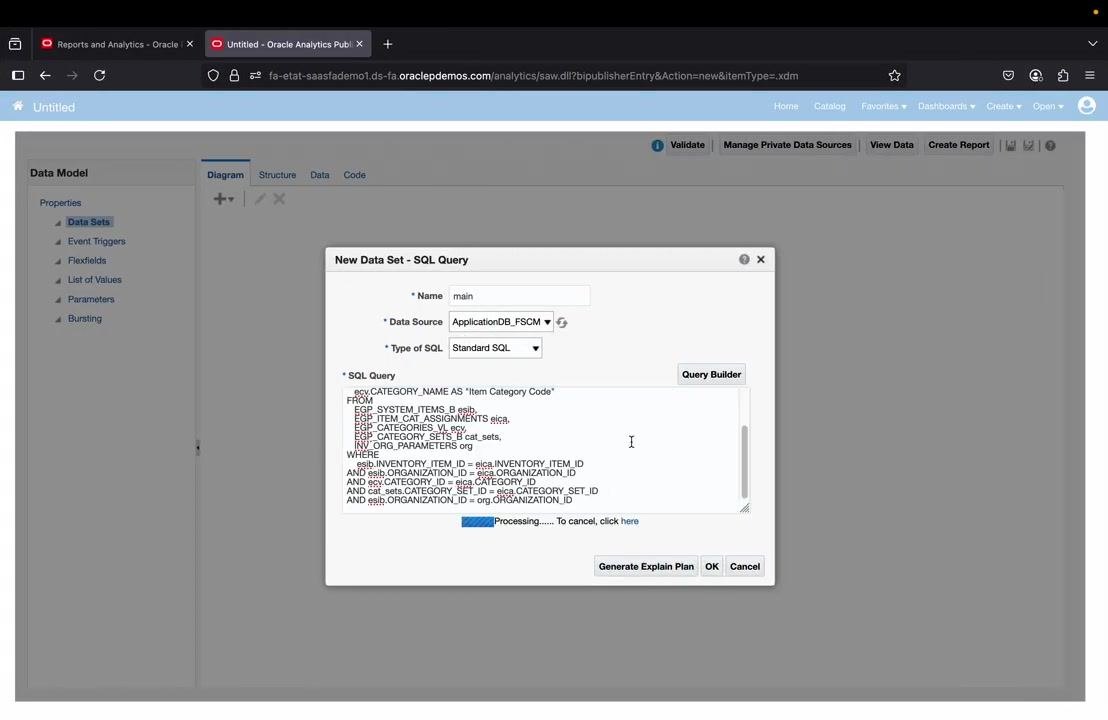
In the "New Data Set - SQL Query" dialog, fill in the following fields:
- Name: a descriptive name for your data set (for example,
main) - Data Source: the source to query (for example,
ApplicationDB_FSCM) - Type of SQL: the SQL type (for example,
Standard SQL) - SQL Query: your SQL code, entered in the text area
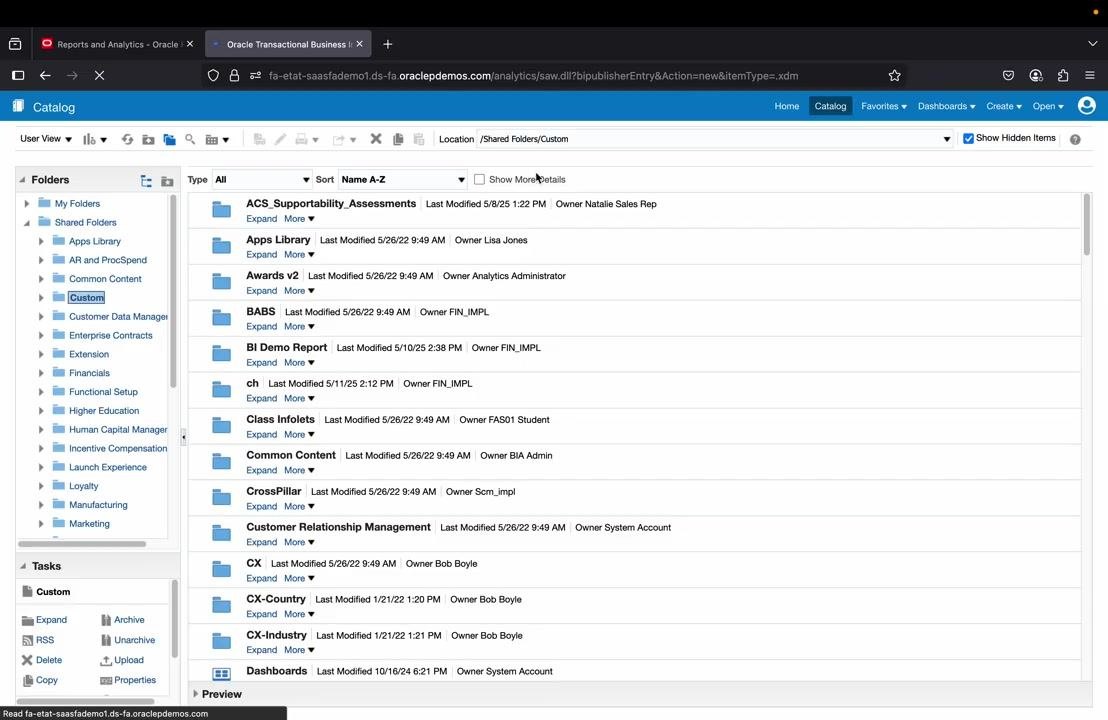
Save the data set
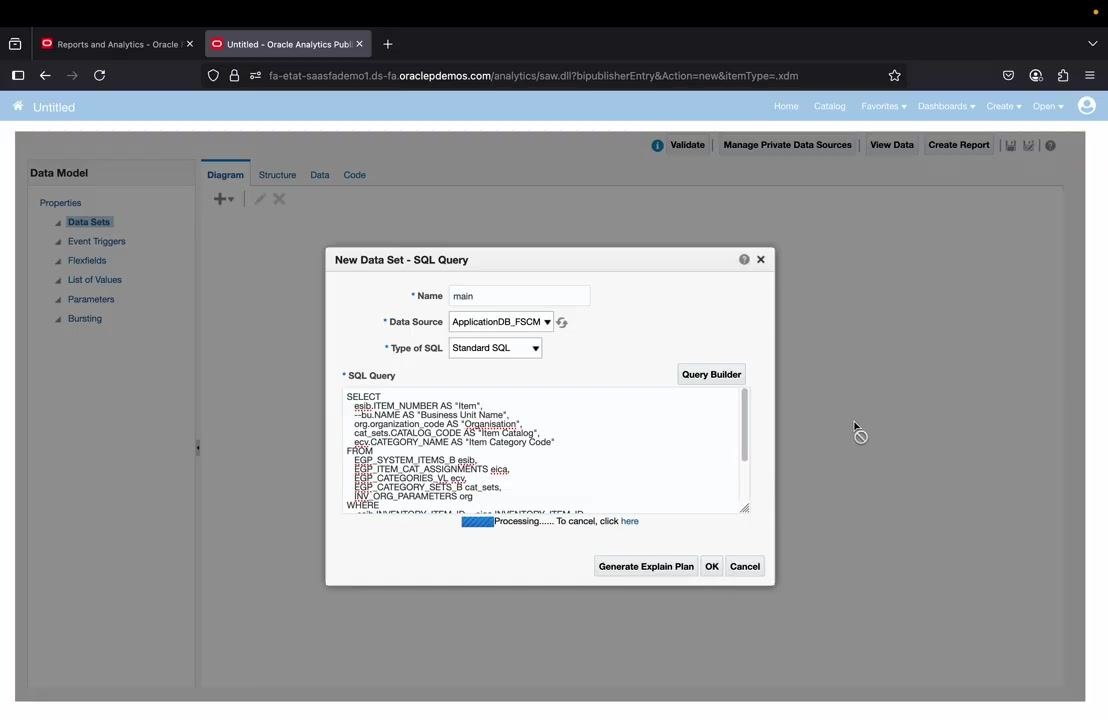
After entering your SQL query, click OK to save the data set. Wait for the system to process your request; a progress bar or message may appear while it does.
Save the data model
With your data set configured, save the data model. When the "Save As" dialog appears, select My Folders under "Save In" and navigate to your desired subfolder (for example, test). Enter a Name for your data model (for example, Item DM), optionally add a description, and click OK.
Verify the data model structure
After saving, confirm that your data set (for example, main) appears under "Data Sets" in the Data Model panel. The diagram view should display your data set structure, including fields such as Item, Organisation, Item_Catalog, and Item_Category_Code.
Preview the data in Tree View
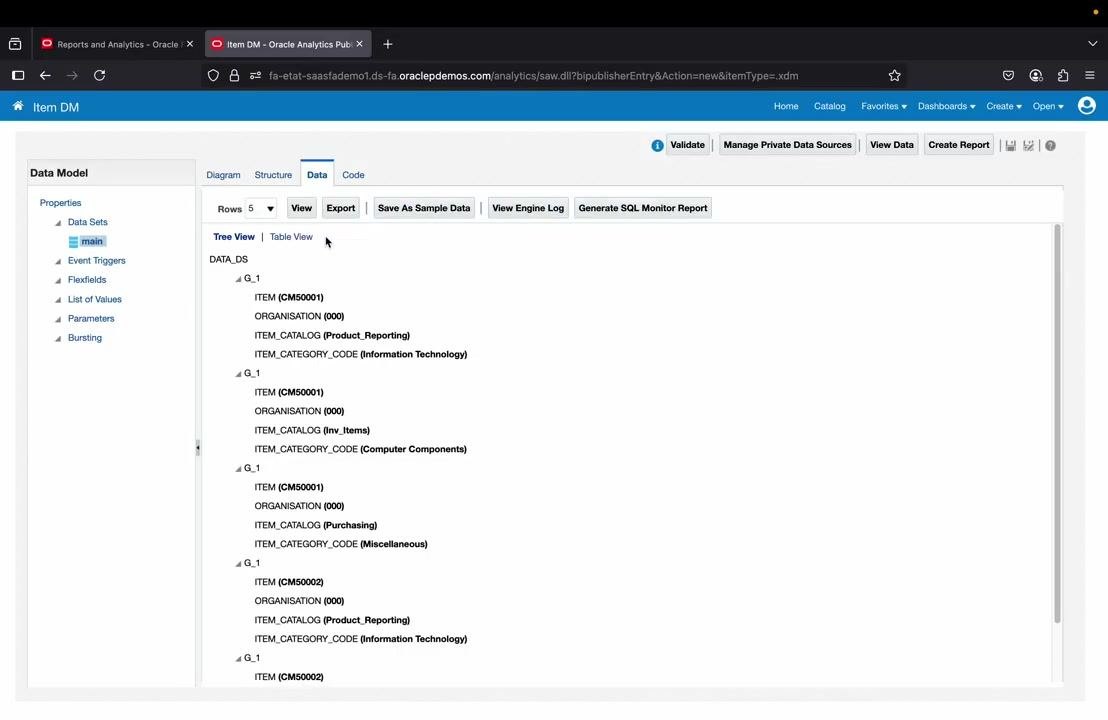
Click the Data tab to view the output of your SQL query, then click View to preview the data in Tree View. Review the sample data to confirm it matches your expectations, then click Save As Sample Data so it is available for report layout design.
Verify the data in Table View
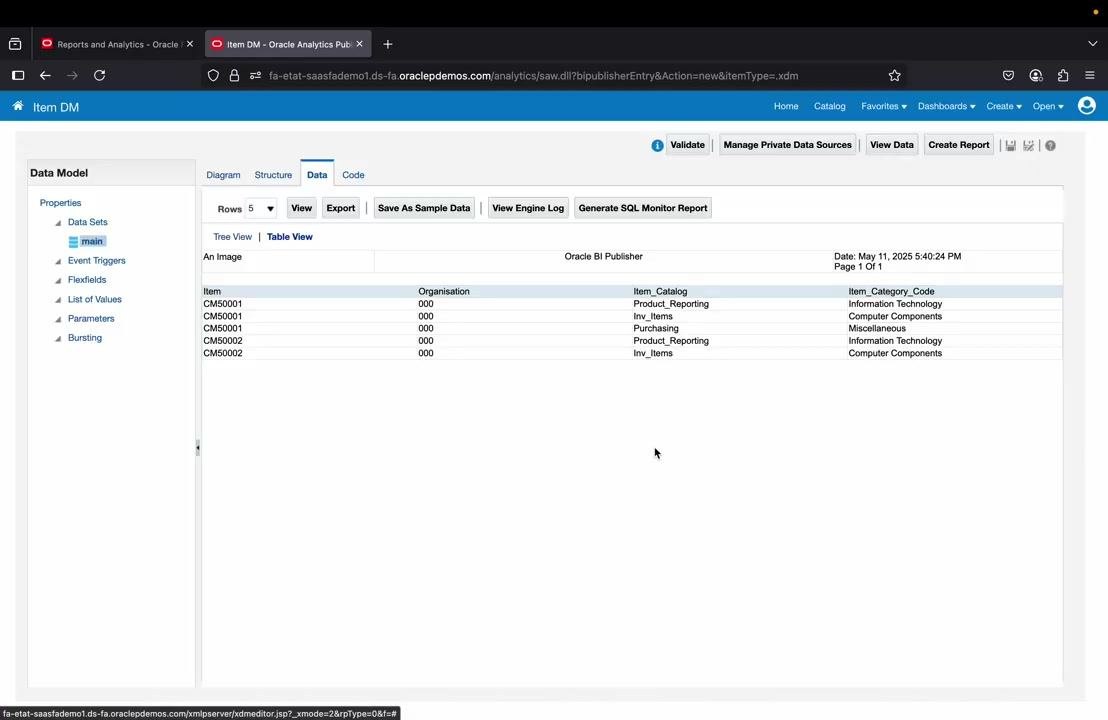
In the Data tab, select Table View to see the data in tabular format. Confirm that the columns (Item, Organisation, Item_Catalog, Item_Category_Code) and their values are correct.
Start creating a report from the data model
Click Create Report at the top right of the Data Model editor to open the "Create Report" wizard. Ensure Use Data Model is selected and verify the correct data model path (for example, /~FIN_IMPL/Test Report/Item DM.xdm). Choose Guide Me for step-by-step report creation, or Use Report Editor for manual editing, then click Next.
Cancel the wizard to generate an RTF layout
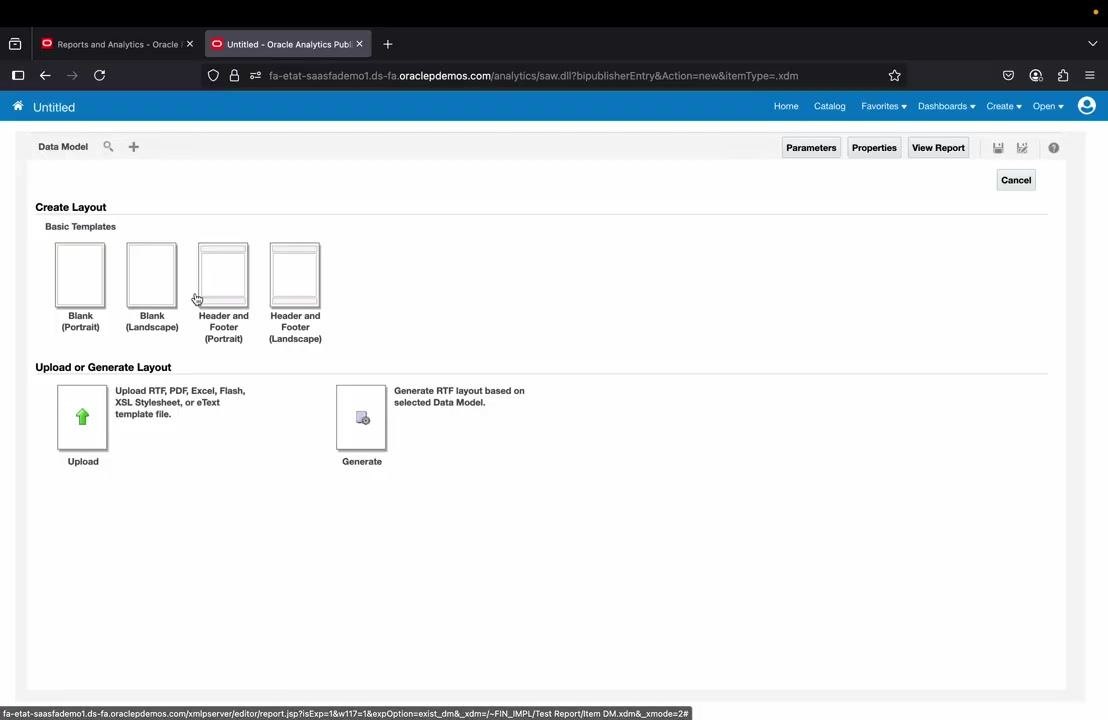
If you want to create a custom RTF template instead, cancel the report creation wizard. On the layout selection screen, locate the "Generate RTF layout based on selected Data Model" option and click Generate to start creating your RTF layout.
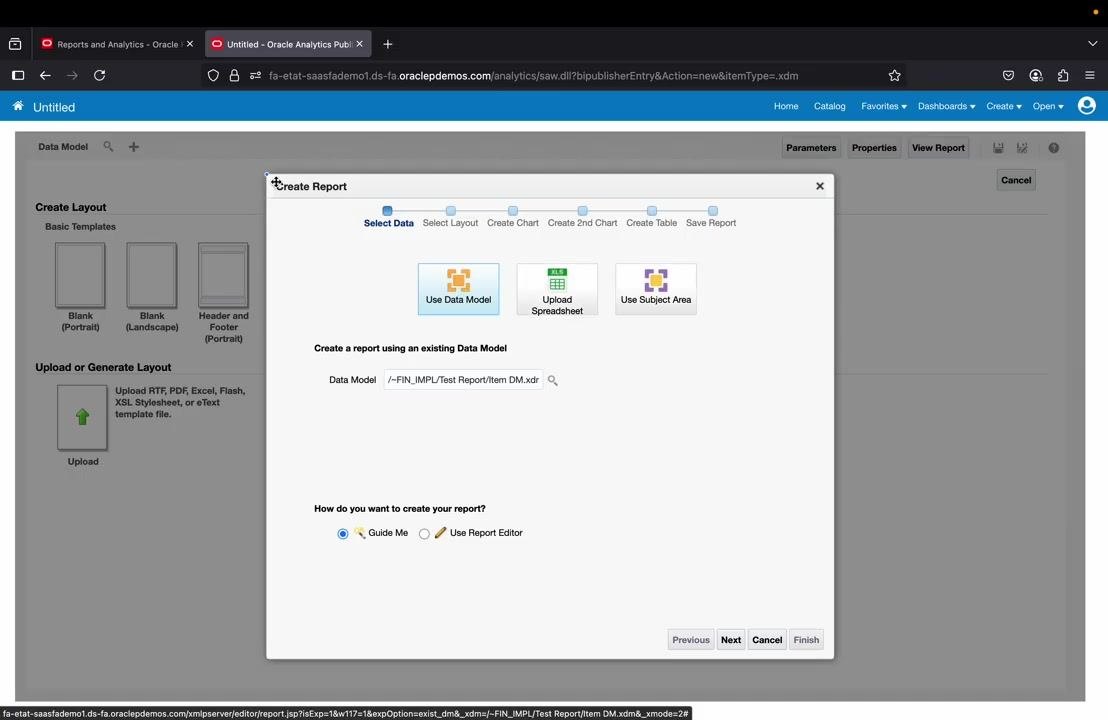
Generate the RTF layout template
Confirm you have the correct data model selected (for example, Item DM). On the "Create Layout" screen, under "Upload or Generate Layout," click Generate next to "Generate RTF layout based on selected Data Model." In the "Auto Generate Layout" dialog, enter a template name (for example, Item output), then click Generate.
Save the generated RTF template
Once the RTF template is generated, the "Save As" dialog appears. In the "Folders" panel, navigate to My Folders > Test Report to save the template alongside your data model. Enter a Name (for example, Item Report), optionally add a description, and click OK.
Run and review the report output
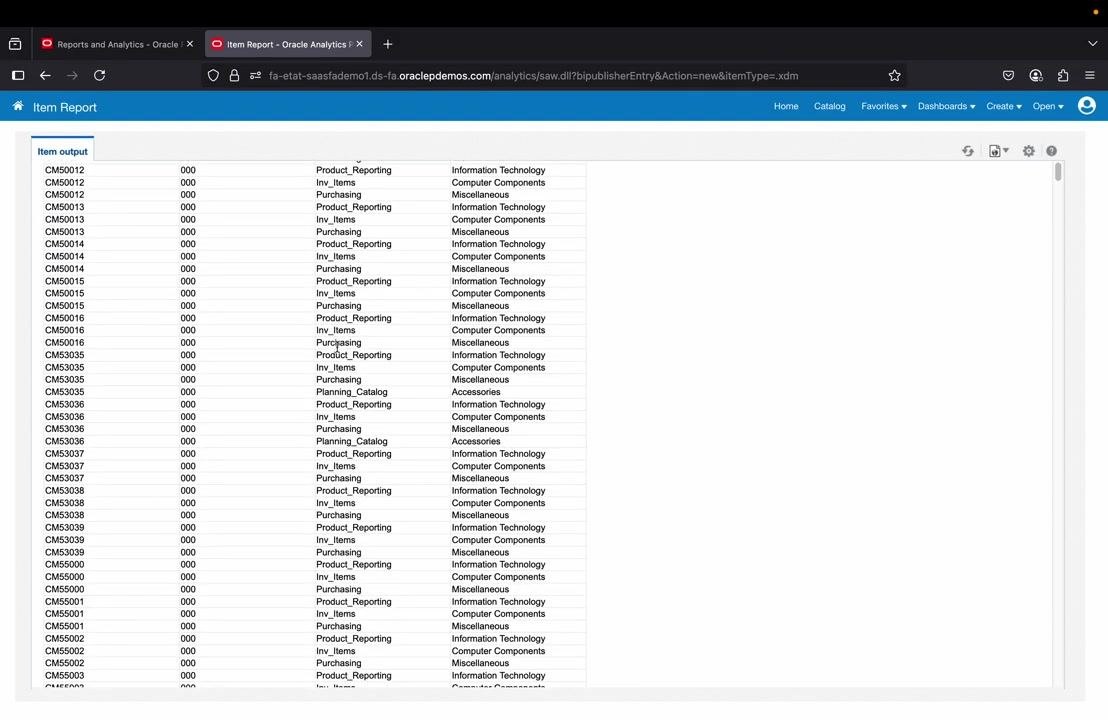
After saving the template, click New Report or use the available options to run the report. The output displays in tabular format, showing data fields and values from your data model, such as item numbers, categories, organizations, and descriptions. Review the output to confirm it matches your expectations.
Locate your report in the catalog
To access your report later, navigate to the Catalog from the top menu and browse to My Folders > Test Report. There you can find your saved report and data model, and open, edit, or run the report directly from the catalog interface.
Summary
You have now learned how to create a BI Publisher report in Oracle Fusion from start to finish: logging in, building a data model with a SQL query data set, saving and verifying that data model, generating a custom RTF layout, and running the finished report. Your data model and report template are saved together in the catalog, ready for future access, editing, or execution.
What's next
With your report saved in My Folders > Test Report, you can return to the catalog at any time to run the report, edit the RTF layout, or adjust the underlying SQL query to refine the data returned.
Generation details: cost, quality tiers
Docsie billed 2,500 credits ($1.75) to analyze this 5-minute video at standard quality. The rewrite, template fill and Word/PDF exports were included. The same video at each quality tier:
| Quality | Frames sampled | Credits | Approx. cost |
|---|---|---|---|
| Draft | every 16-30 s | 1,250 | $0.88 |
| Standard (this guide) | every 8-15 s | 2,500 | $1.75 |
| Detailed | every 4-7 s | 5,000 | $3.50 |
| Ultra | every 1-3 s | 10,000 | $7.00 |
Credits priced at $0.70 per 1,000; plans include a monthly allowance. Enterprise customers on on-premise or bring-your-own-model deployments run this on their own inference and pay no per-video credits.
Generated by Docsie Video-to-Docs on 2026-10-01 from a 4-minute video. Screenshots are frames from the source video and belong to their creator, Oracle Fusion Technical, whose original is embedded above. If you own this video and want the guide removed or credited differently, contact us and we will act within one business day.