
How to Find a Table Name in Oracle Fusion
This guide shows how to find a table name in Oracle Fusion by running a SQL query in a data model. You work in Reports and Analytics, query a table by name (here, POHEADERS), and review the columns and data it returns. You can view the results as a diagram, as XML, in a tree, or in a table.
Video: How to run your SQL Queries and search tables in Oracle Fusion ERP application by erptise (2023). All credit for the demonstration goes to the creator; watch the original on YouTube. The written guide below was generated from this video by Docsie. Creator? Request a change or removal.
This guide shows how to find a table name in Oracle Fusion by running a SQL query in a data model. You work in Reports and Analytics, query a table by name (here, PO_HEADERS), and review the columns and data it returns. You can view the results as a diagram, as XML, in a tree, or in a table.
Prerequisites
Before you start, make sure you have:
- Access to the Oracle Applications Cloud login page
- A valid username (this guide uses
raj.kumar) and password - Access to the
ApplicationDB_FSCMdata source
Steps
Sign in to Oracle Applications Cloud
- Open your web browser and go to the Oracle Applications Cloud login page.
- Enter your username, for example
raj.kumar. - Enter your password.
- Make sure the language is set to English if required.
- Click Sign In.
Open the Tools tab
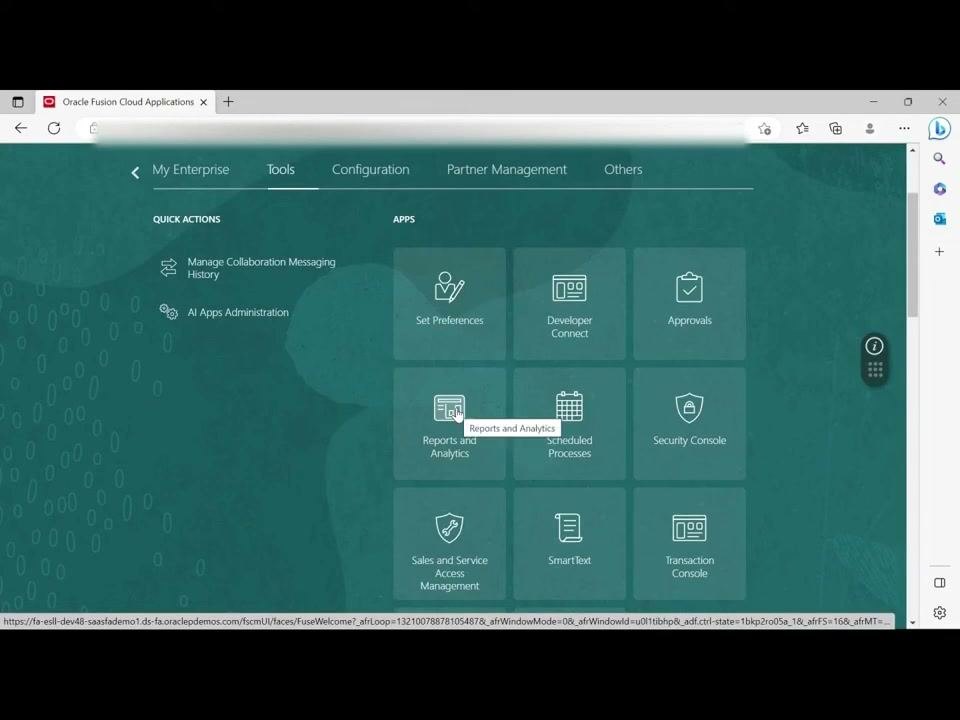
After you sign in, the main dashboard appears with a greeting such as "Good morning, Raj Kumar!". In the top navigation bar, click the Tools tab.
Open Reports and Analytics
In the Tools section, find the Reports and Analytics tile under APPS. Click it to open the reporting area.
Browse the catalog
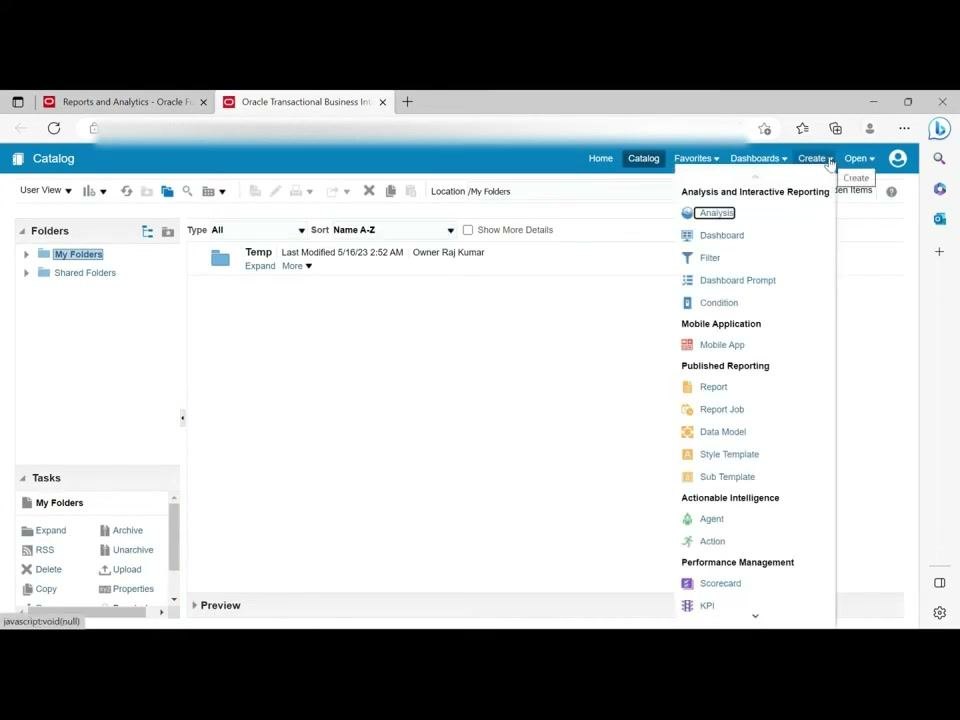
The Reports and Analytics area opens and shows the Catalog. On the left, you see folders such as My Folders and Shared Folders. The main area shows any existing folders or reports, for example a folder named "Temp" owned by Raj Kumar. Wait for the catalog work area to load fully.
Create a new data model
- In the Catalog, find the top menu bar.
- Click the Create dropdown menu.
- Under Published Reporting, select Data Model.
Add a new data set
The Data Model editor opens in a new tab or window. The left pane lists Data Sets, Event Triggers, Flexfields, List of Values, Parameters, and Bursting. The main area shows the Diagram tab. Click the plus (+) button to add a data set.
Select SQL Query as the data set type
A dropdown menu lists the available data set types. Select SQL Query.
Enter the table name in your SQL query
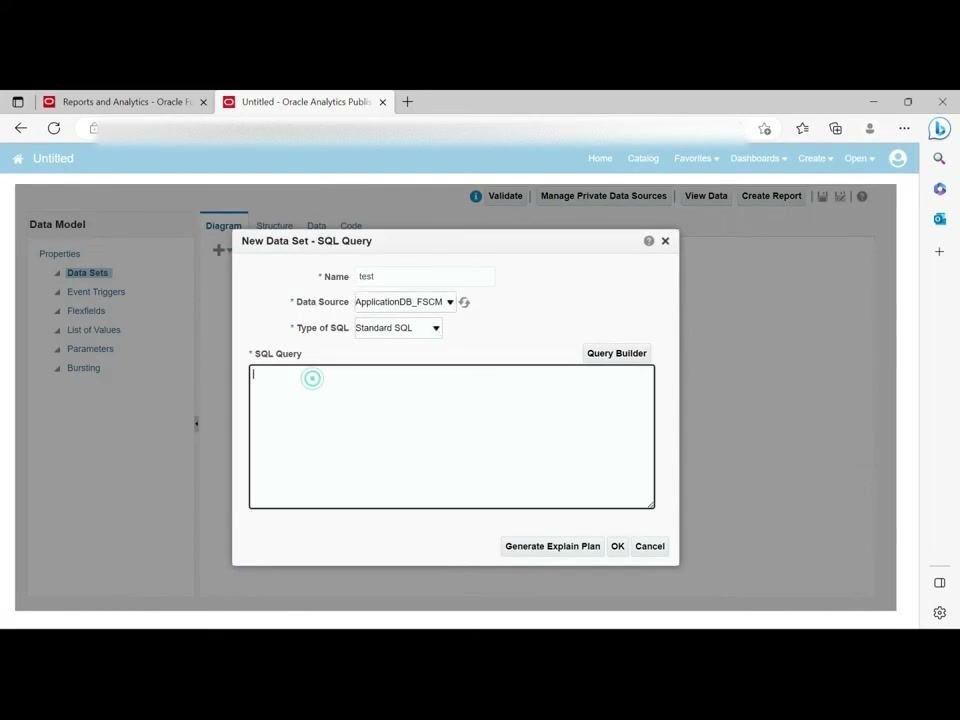
In the New Data Set - SQL Query dialog, enter the following values:
- Name:
test - Data Source:
ApplicationDB_FSCM - Type of SQL:
Standard SQL - SQL Query:
select * from PO_HEADERS
Click OK to save the data set and run the query.
Review the data model diagram
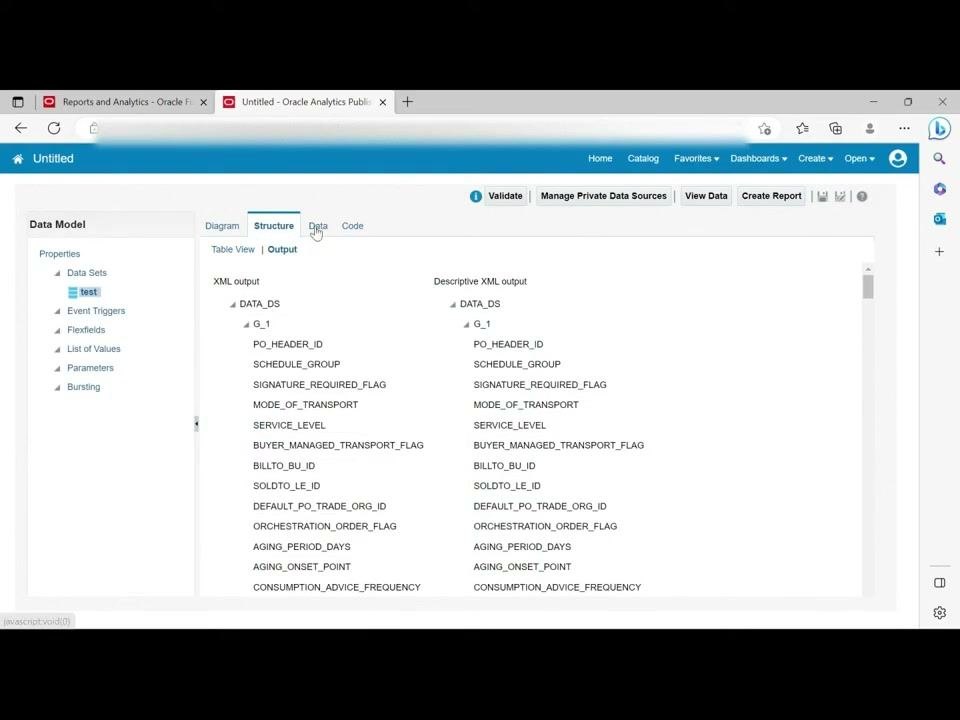
After you click OK, the diagram shows the structure of your data set.
- Confirm that the data set
testappears under Data Sets in the left pane. - In the main area, review the fields listed under the group
G_1, such asPO_HEADER_ID,SCHEDULE_GROUP, andSIGNATURE_REQUIRED_FLAG. - Use the diagram to understand which columns your query retrieved.
View the XML structure
- Click the Structure tab at the top of the main area.
- Review the XML output and Descriptive XML output sections.
- Confirm that the structure lists all the fields from your query under
DATA_DS > G_1.
This view shows how your data is structured in XML format.
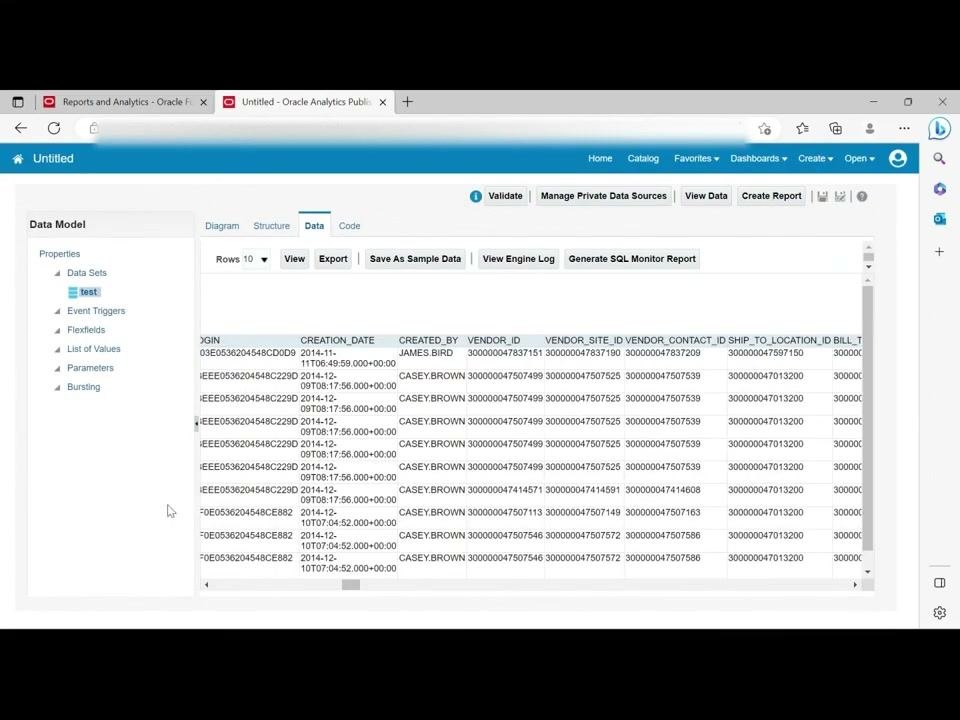
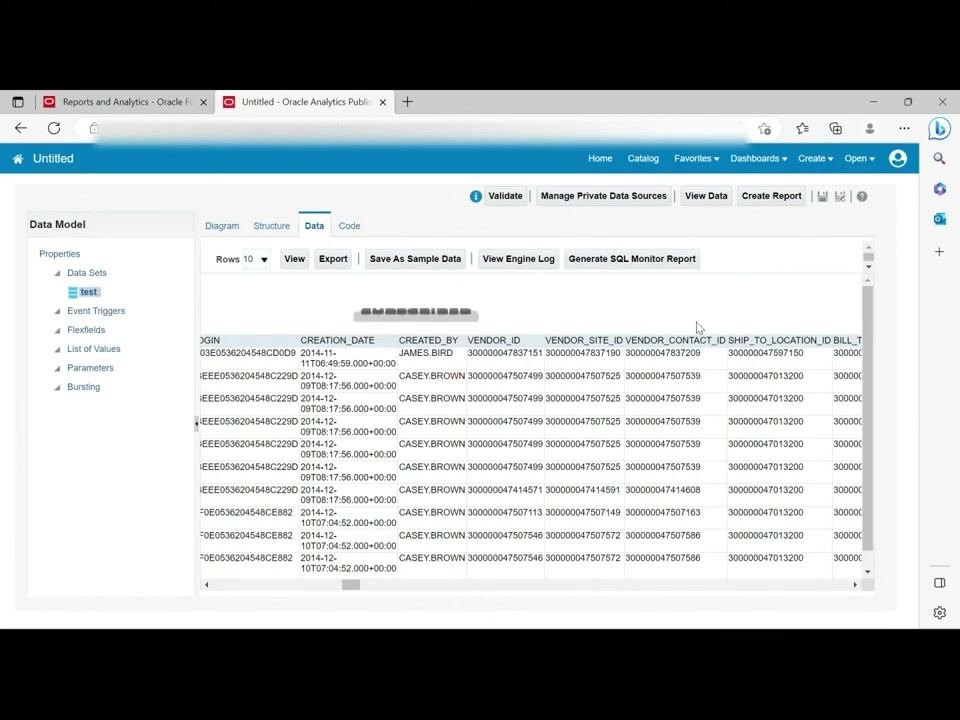
View the data returned from the table
- Click the Data tab at the top of the main area.
- Open the Rows dropdown menu and select 10 to view up to 10 rows.
- Click View.
Review the data in Tree View
The data may appear in Tree View by default. This view shows each field and its value under DATA_DS > G_1. For example:
PO_HEADER_ID (2055)SIGNATURE_REQUIRED_FLAG (N)BUYER_MANAGED_TRANSPORT_FLAG (N)BILLTO_BU_ID (300000047498175)CREATED_BY (CASEY.BROWN)
Use this view for a structured, expandable look at your data.
Switch to Table View
Click Table View next to Tree View. The data appears in a grid with a column for each field and a row for each record. This layout makes it easier to compare values across records.
Export or save the data (optional)
To download or save the results for further analysis, click Export or Save As Sample Data.
End your session
When you finish reviewing the data, close the Oracle Fusion browser tab or window.
Summary
You created a SQL data model in Oracle Fusion, ran a query against the PO_HEADERS table, and reviewed the results in the diagram, the XML structure, Tree View, and Table View. You can repeat these steps to query and analyze other data from your Oracle Fusion Cloud Applications.
What's next
- Use Export or Save As Sample Data to keep the results for further analysis.
- Open the Structure tab to check how your query fields appear in XML.
- Change the table name in the SQL Query field to query different data.
Generation details: cost, quality tiers
Docsie billed 2,000 credits ($1.40) to analyze this 4-minute video at standard quality. The rewrite, template fill and Word/PDF exports were included. The same video at each quality tier:
| Quality | Frames sampled | Credits | Approx. cost |
|---|---|---|---|
| Draft | every 16-30 s | 1,000 | $0.70 |
| Standard (this guide) | every 8-15 s | 2,000 | $1.40 |
| Detailed | every 4-7 s | 4,000 | $2.80 |
| Ultra | every 1-3 s | 8,000 | $5.60 |
Credits priced at $0.70 per 1,000; plans include a monthly allowance. Enterprise customers on on-premise or bring-your-own-model deployments run this on their own inference and pay no per-video credits.
Generated by Docsie Video-to-Docs on 2026-11-15 from a 3-minute video. Screenshots are frames from the source video and belong to their creator, erptise, whose original is embedded above. If you own this video and want the guide removed or credited differently, contact us and we will act within one business day.