
How to Create an OTBI Report in Oracle Fusion
This guide walks you through how to create an OTBI report in Oracle Fusion by building a BI Publisher (BIP) report that uses an Oracle Transactional Business Intelligence (OTBI) analysis as its data source. You will create a simple analysis, reuse its underlying query in a BI Data Model, add a parameter for filtering, and build the final BI Publisher report layout.
Video: How to create BI Report using OTBI Analysis in Oracle ERP Cloud by Oracle Fusion Technical. All credit for the demonstration goes to the creator; watch the original on YouTube. The written guide below was generated from this video by Docsie. Creator? Request a change or removal.
This guide walks you through how to create an OTBI report in Oracle Fusion by building a BI Publisher (BIP) report that uses an Oracle Transactional Business Intelligence (OTBI) analysis as its data source. You will create a simple analysis, reuse its underlying query in a BI Data Model, add a parameter for filtering, and build the final BI Publisher report layout.
Prerequisites
- Access to an Oracle Fusion instance with valid login credentials.
- Permissions to create analyses and reports in the Oracle BI Catalog and BI Publisher.
Overview of the process
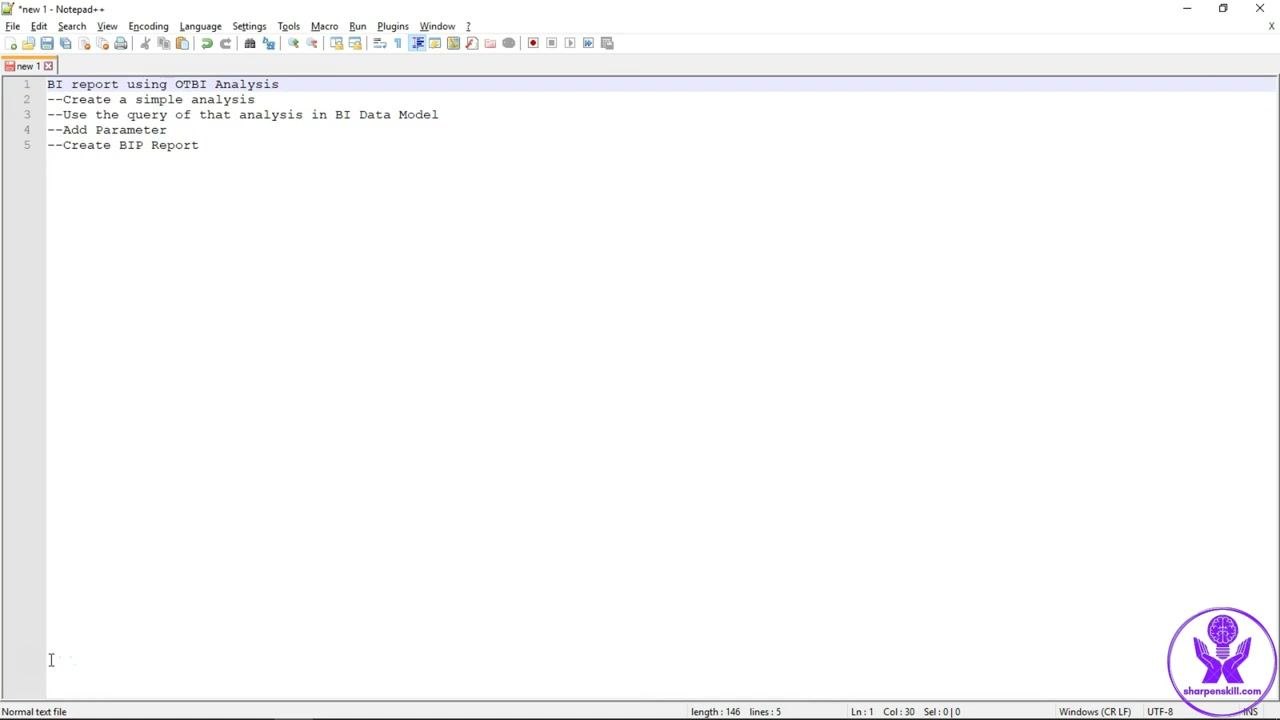
Before you start, it helps to understand the four main stages of this workflow:
- Create a simple analysis.
- Use the query of that analysis in the BI Data Model.
- Add a parameter.
- Create the BIP report.
Log in and navigate to Reports and Analytics
Open your web browser, navigate to your Oracle Fusion instance, and log in with your credentials. Click the Navigator menu, then under the Tools section click Reports and Analytics.
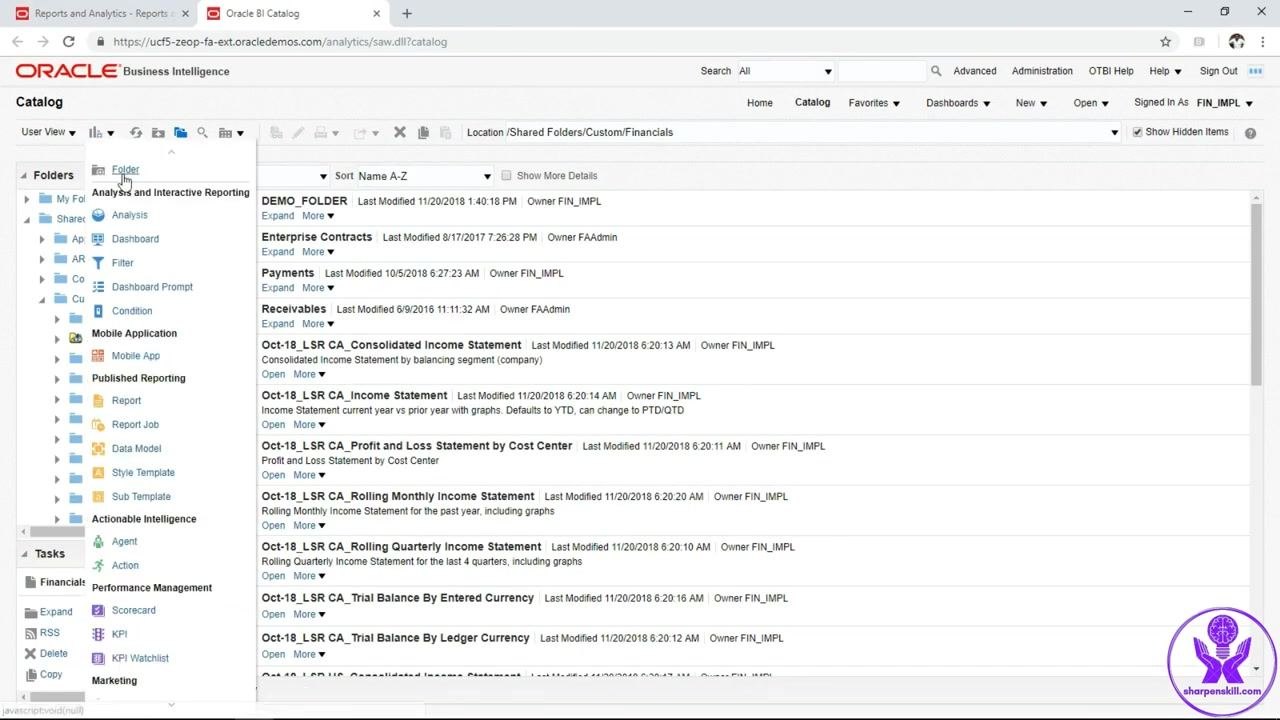
Create a folder for your reports in the BI Catalog
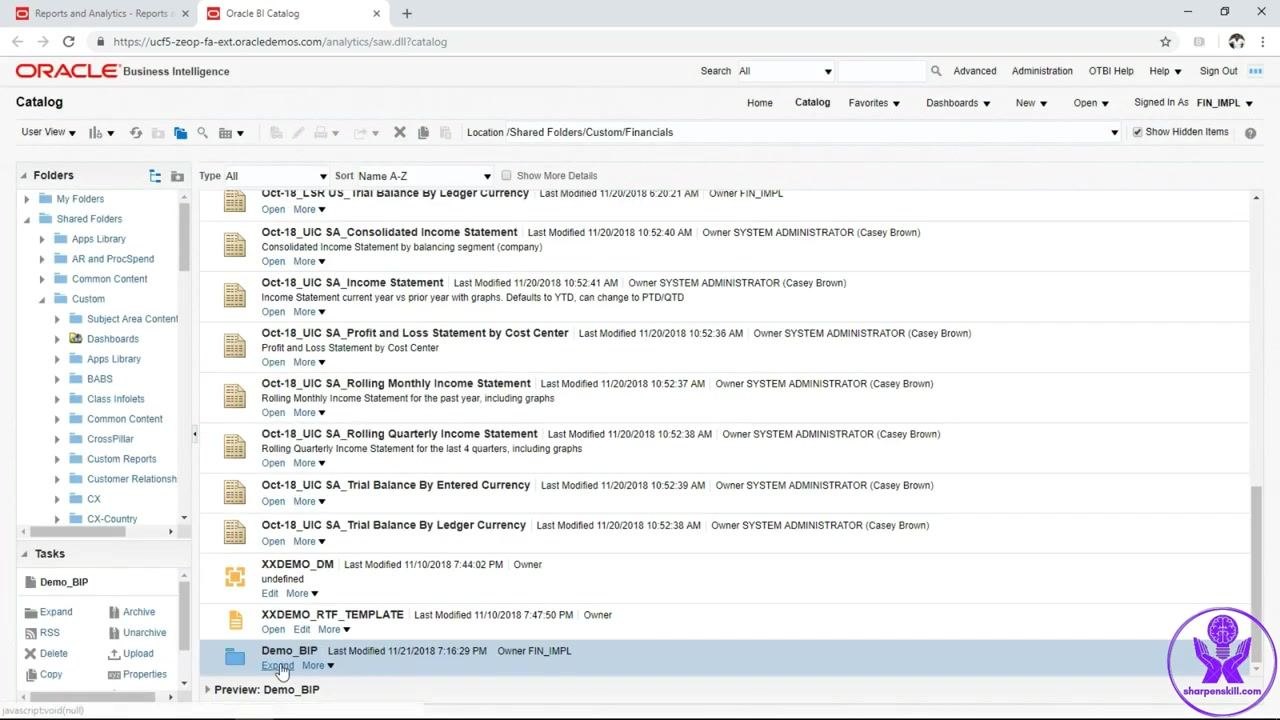
Click Browse Catalog to open the Oracle BI Catalog. Create a new folder named Demo_BIP to organize your work — all reports in this walkthrough are saved here.
Start a new analysis
With the Demo_BIP folder selected, click the New dropdown menu and select Analysis to begin creating a new analysis.
Select the subject area and add columns
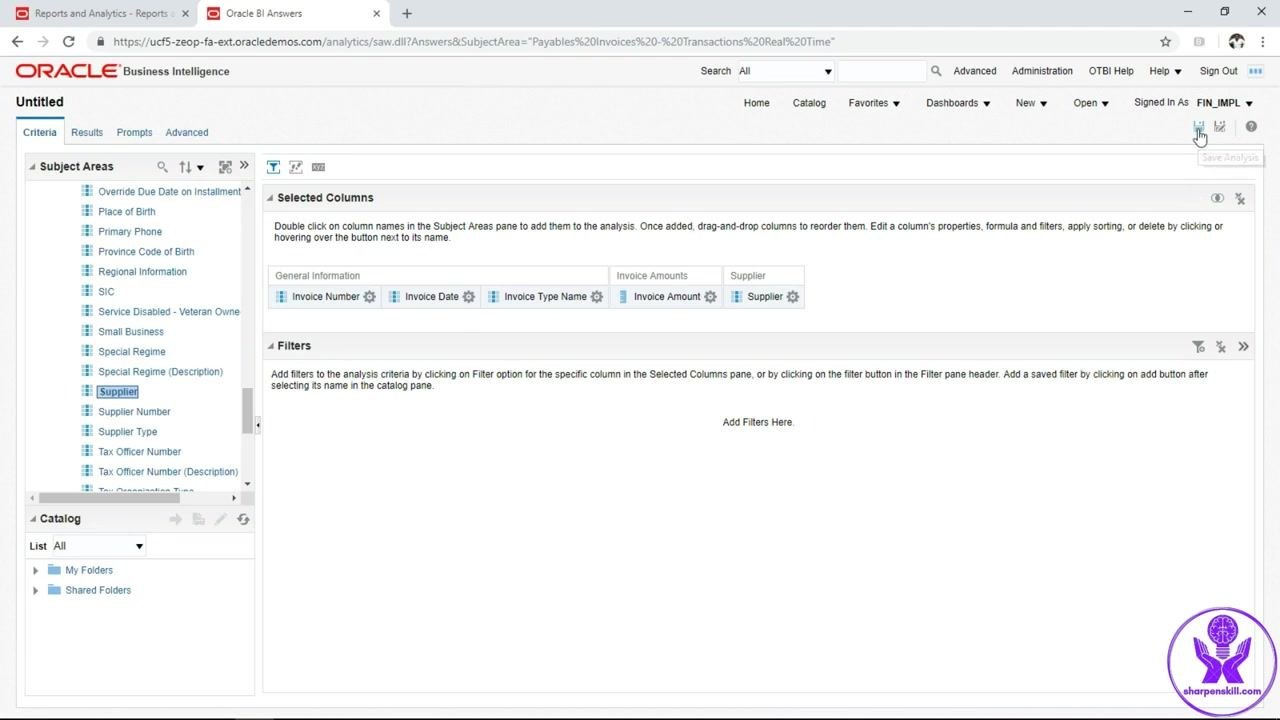
Select the subject area Payables Invoice Transaction Real-time. In the Subject Areas panel, expand the folders and add the following columns to Selected Columns by double-clicking or dragging them: Invoice Number, Invoice Date, and Invoice Type Name.
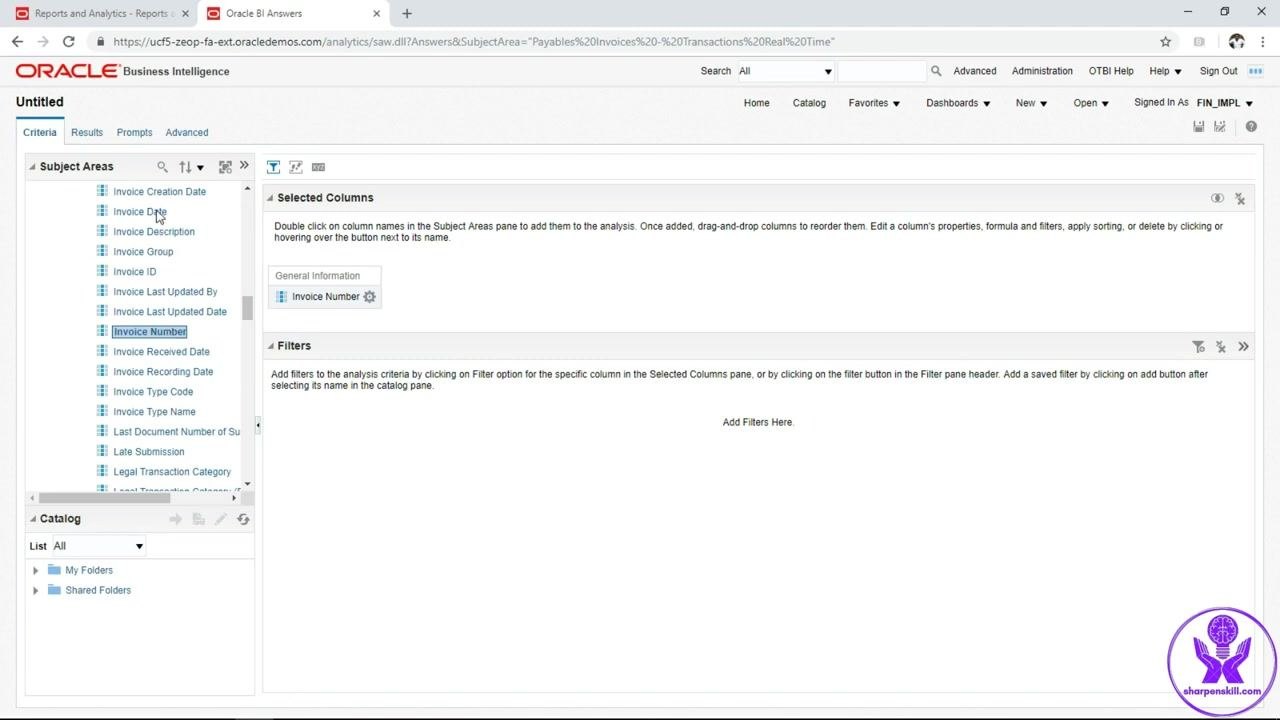
Add the remaining columns
Expand the folders again and add Invoice Amount and Supplier to Selected Columns. Your final column list should include Invoice Number, Invoice Date, Invoice Type Name, Invoice Amount, and Supplier.
Save the analysis
Click the Save icon in the top right corner, enter the analysis name Demo_ap_analysis, and click OK. Click the Results tab afterward to view your analysis output.
Copy the analysis SQL
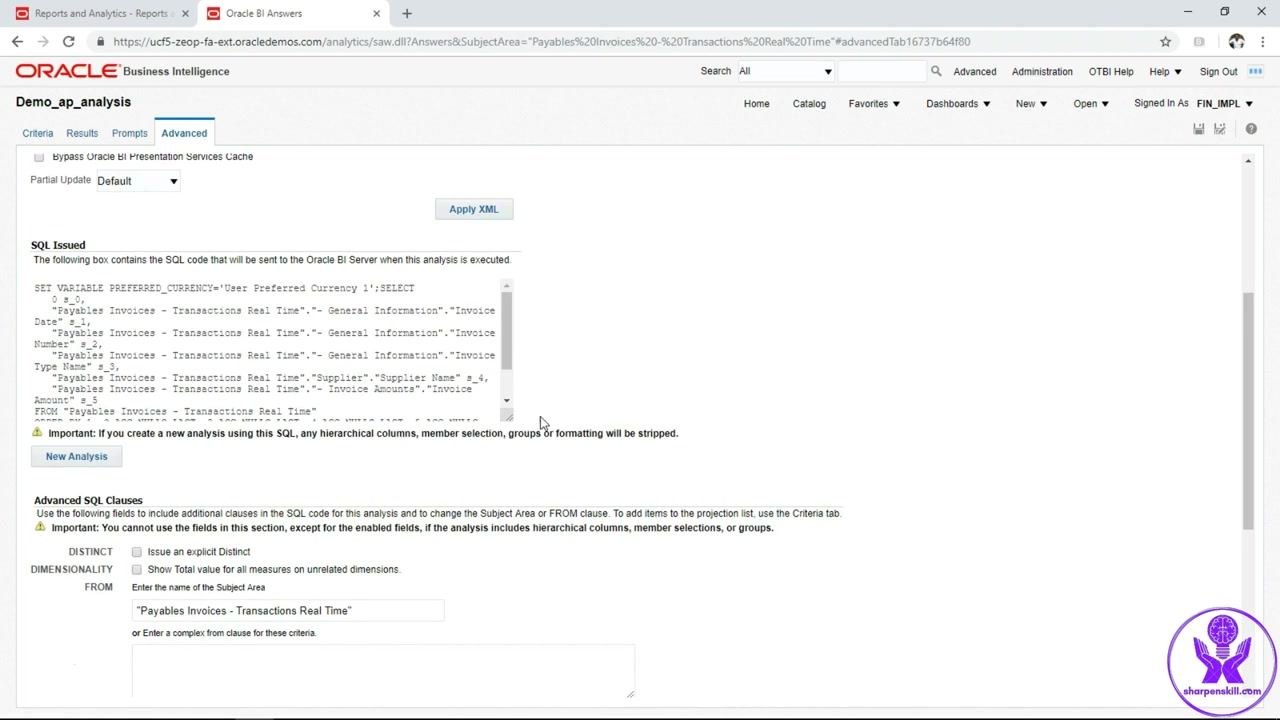
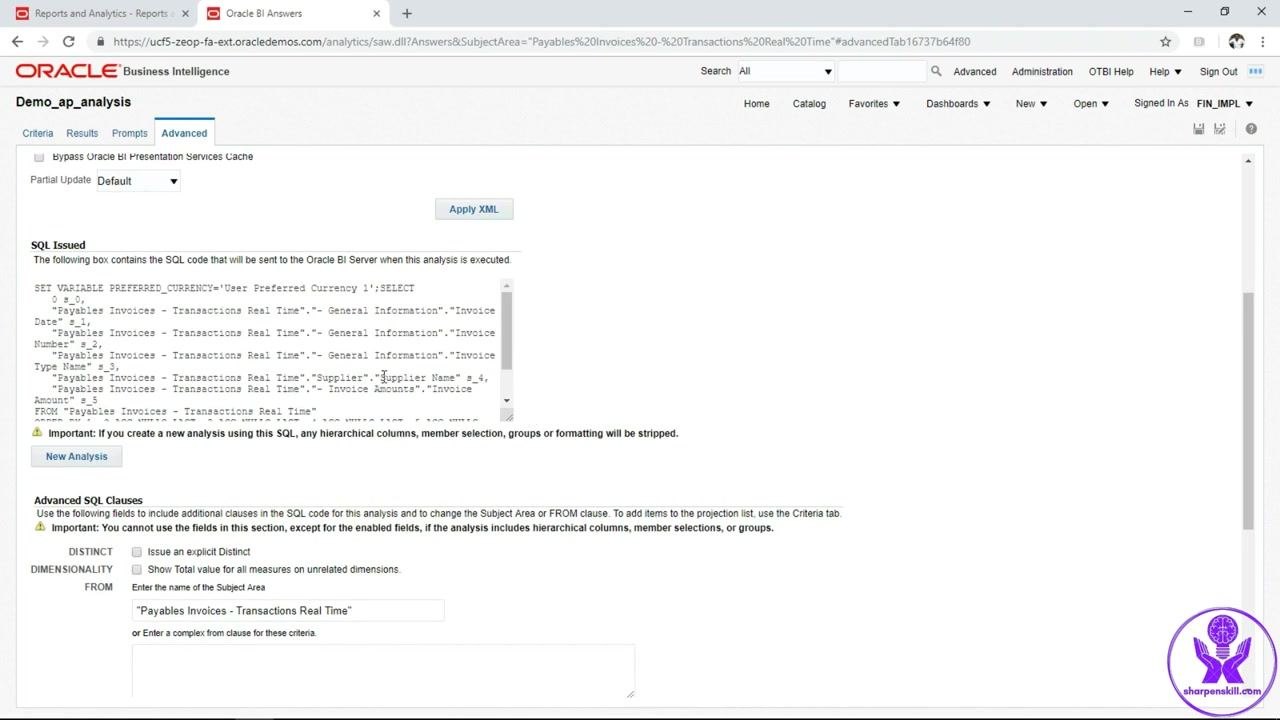
Click the Advanced tab and locate the SQL Issued section, which shows the SQL query generated by your analysis. Copy this entire query — you will reuse it in the BI Data Model.
Create a new data model
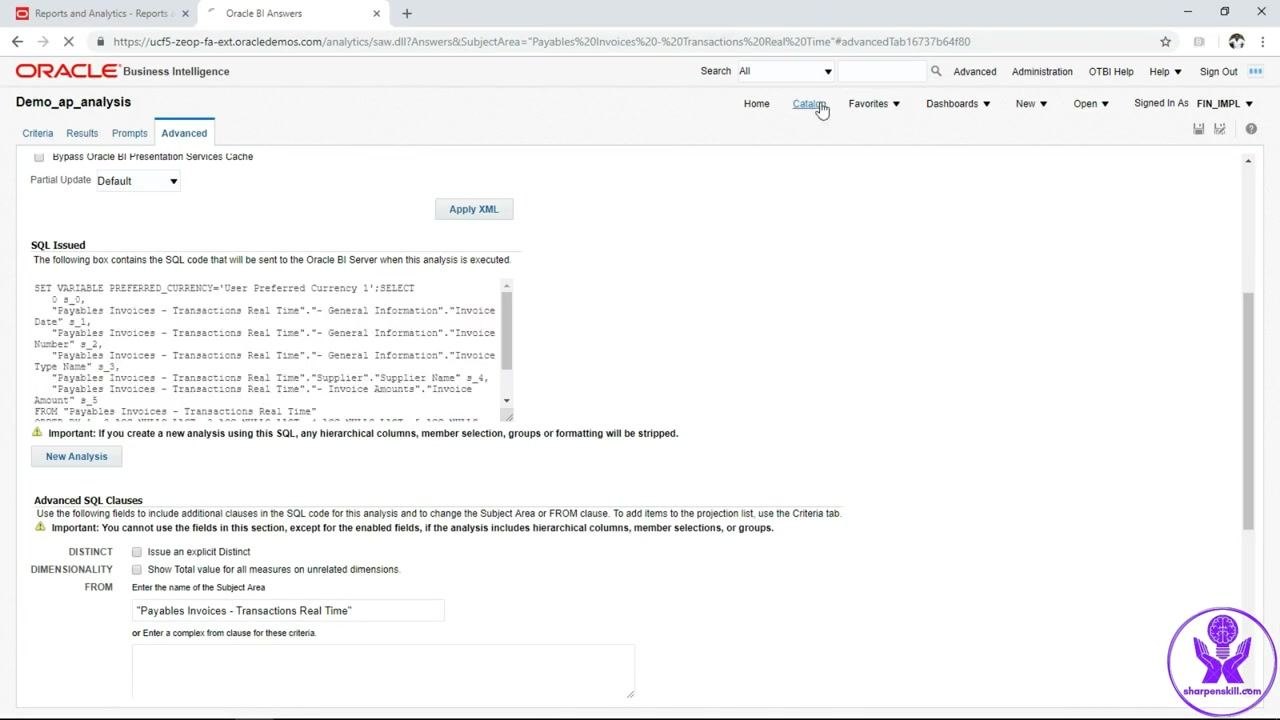
Navigate to the Catalog and select New > Data Model. In the Data Model editor, stay on the Diagram tab, click the + button, and select SQL Query from the dropdown to create a new data set.
Define the SQL data set
In the New Data Set - SQL Query dialog, enter the name inv_ds, set Data Source to Oracle BI EE, and set Type of SQL to Standard SQL. Paste the SQL query you copied earlier, and remove the line FETCH FIRST 75001 ROWS ONLY if it appears in the query. Also add a parameter for supplier name using the appropriate BI Publisher syntax (for example, :SUPPLIER_NAME) so the report can be filtered dynamically by supplier.
Configure the supplier name parameter
Select the parameter you created (for example, p_supplier_name) and set its Display Label to Supplier Name. Ensure Parameter Type is Text and Data Type is String. Leave Default Value blank unless you want a default supplier pre-filled, and set Row Placement as needed (the default is 1).
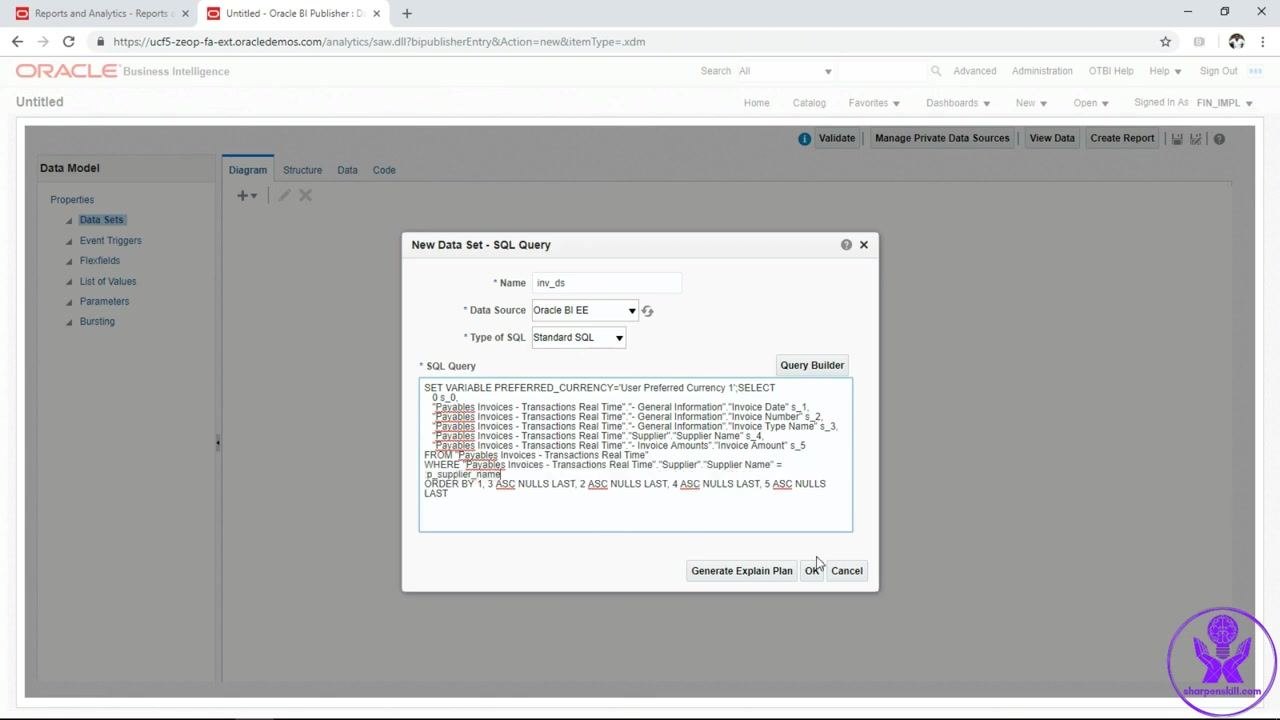
Review the data set column aliases
Go to the Data Sets section, select your data set (inv_ds), and open the SQL query to review the alias names: s_1 for Invoice Date, s_2 for Invoice Number, s_3 for Invoice Type Name, s_4 for Supplier, and s_5 for Invoice Amount. Make sure none of the alias names contain spaces (use invoice_date rather than invoice date).
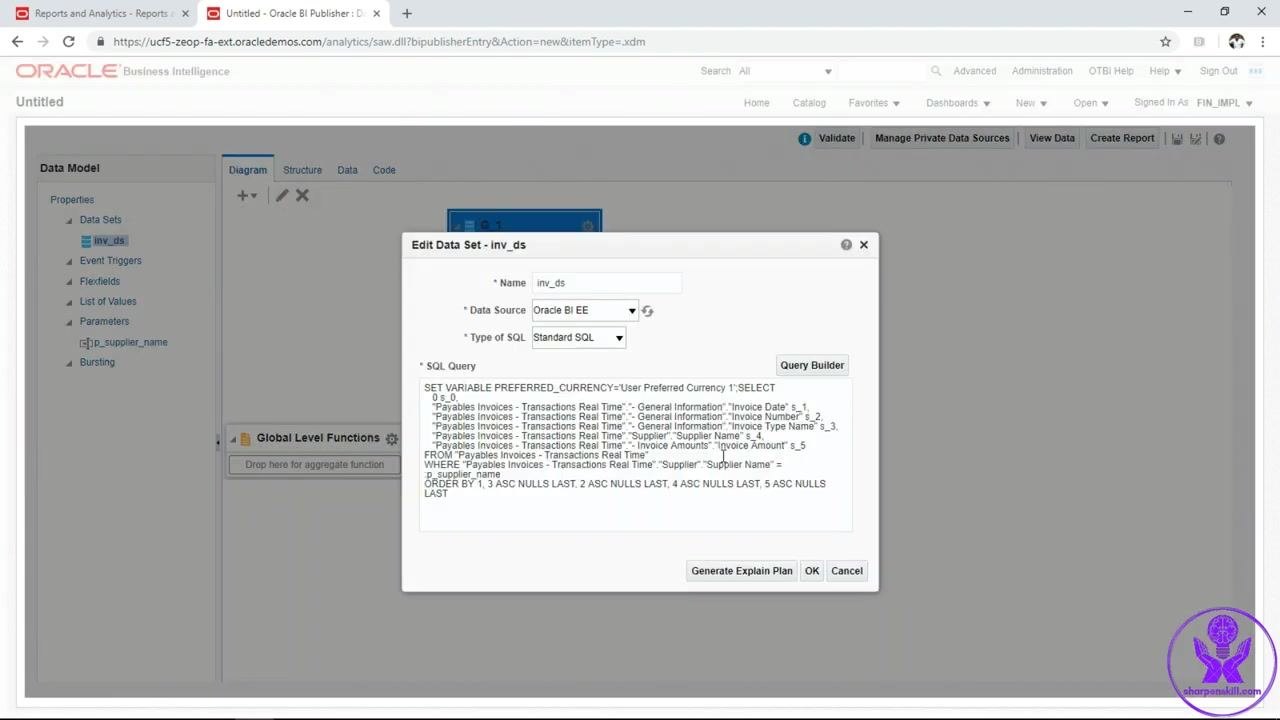
Set display names and properties for each column
Right-click each column and select Properties to set its Alias and Display Name:
s_1→ Aliasinvoice_date, Display NameInvoice Dates_2→ Aliasinvoice_num, Display NameInvoice Numbers_3→ Aliasinvoice_type, Display NameInvoice Types_4→ Aliassupplier, Display NameSuppliers_5→ Aliasamount, Display NameAmount
Click OK after editing each property.
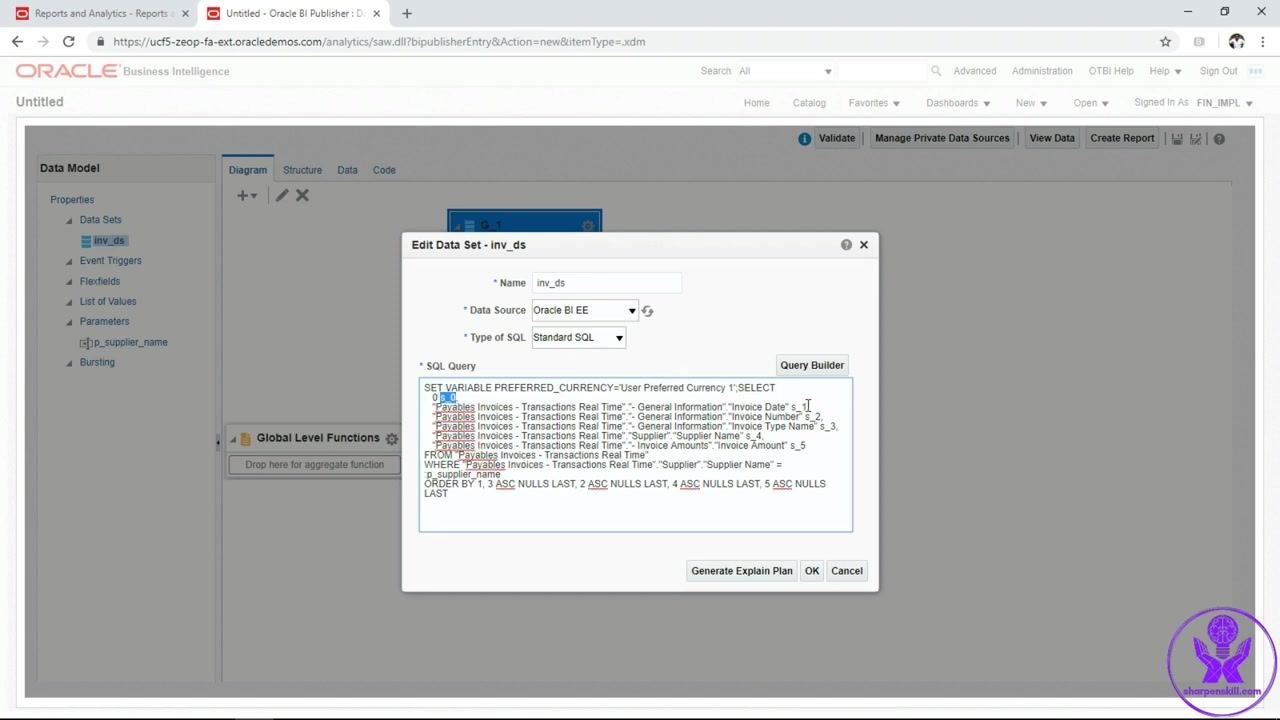
Access column properties from the diagram
In the Diagram tab, right-click each column node (such as invoice_date or invoice_num) and select Properties from the context menu to edit column details as needed.
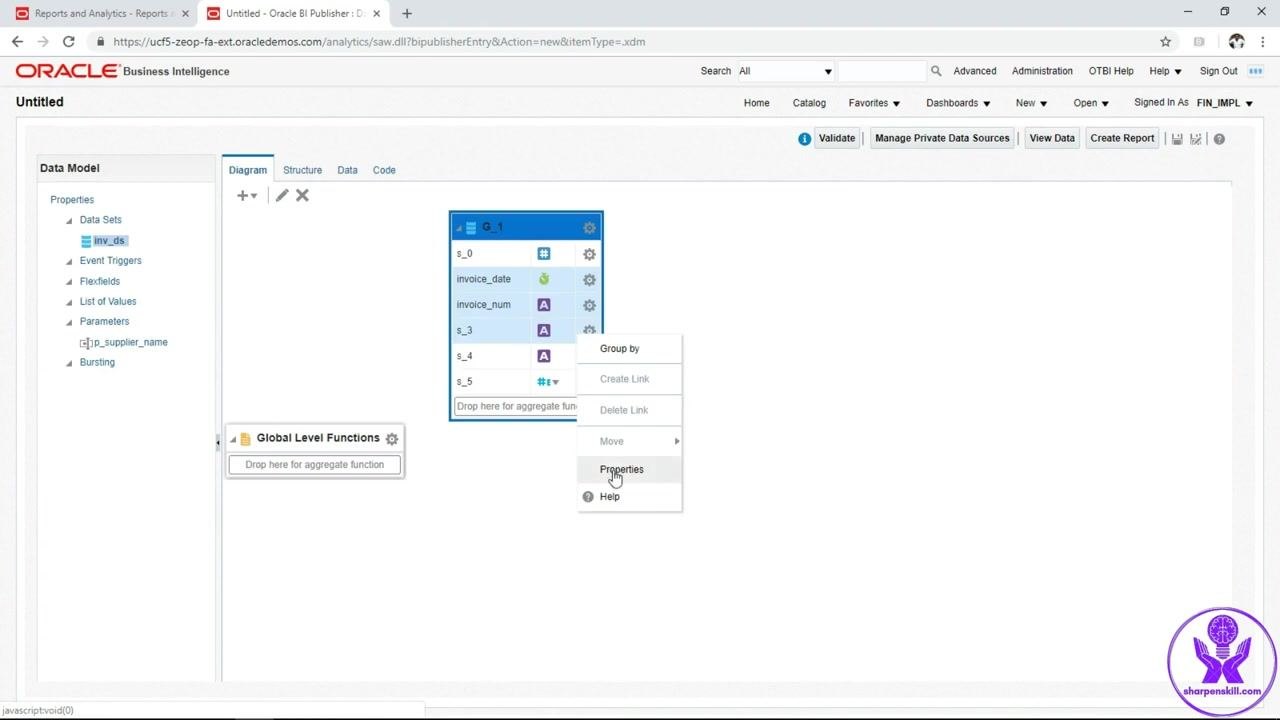
Open properties for the remaining columns
Right-click on another column, such as s_4 or s_5, in the data model diagram and select Properties from the context menu to continue configuring your columns.
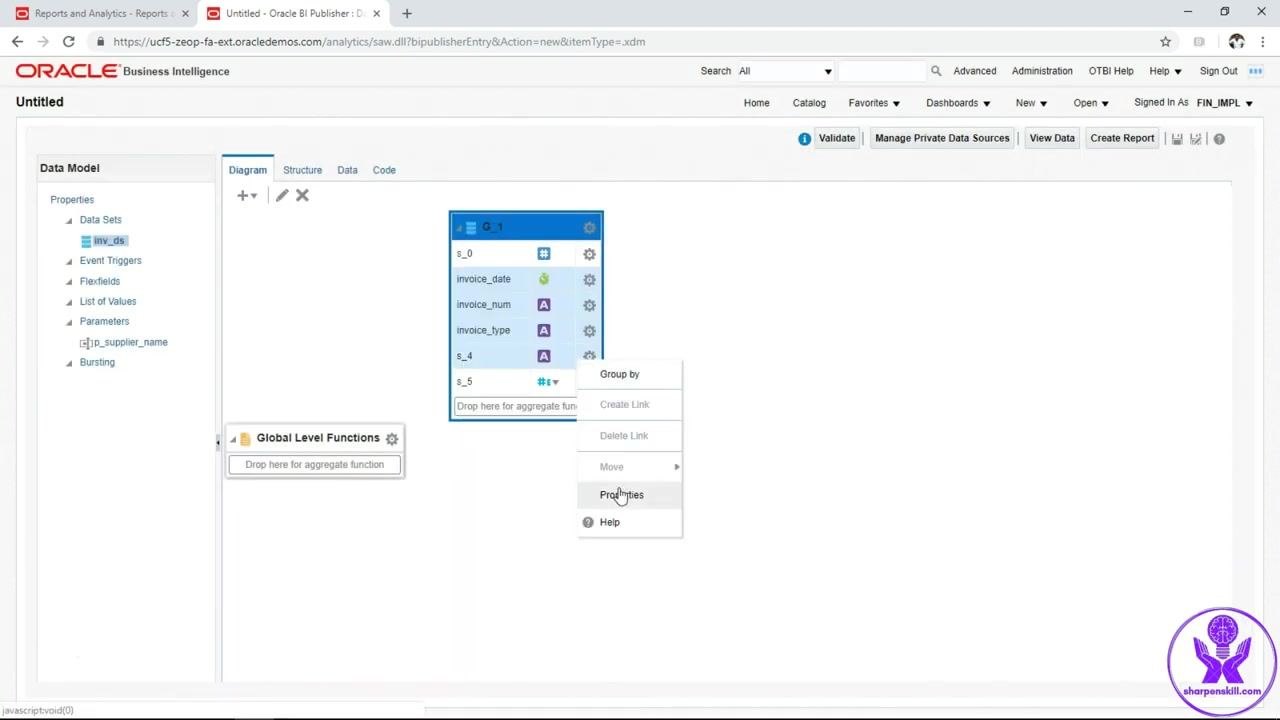
Edit individual column properties
In the Edit Properties dialog for the selected column (for example, s_4), set Alias to supplier_name, Display Name to Supplier Name, and confirm Data Type is String. Leave Sort Order as No Ordering and Value If Null blank unless you need different settings. Click OK to save. Repeat these steps for other columns as needed, such as s_5 for amount.
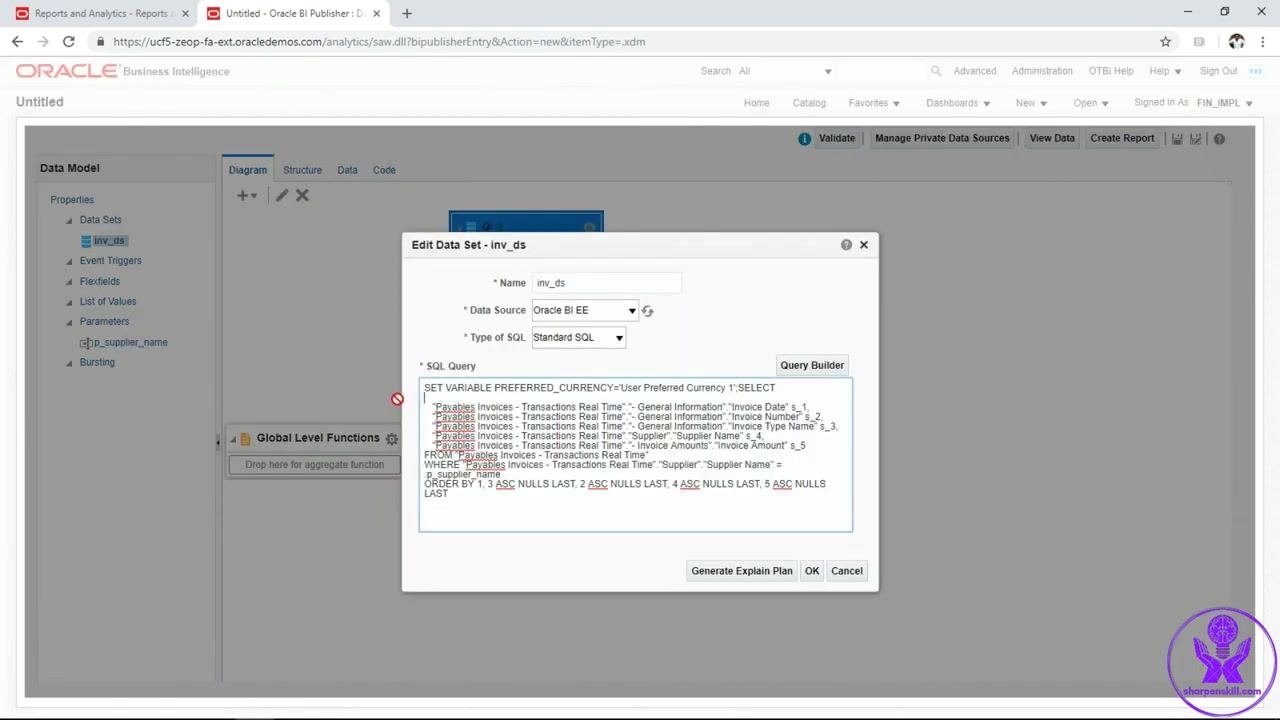
Edit the data set query to apply the supplier filter
Double-click the data set (inv_ds) to open the Edit Data Set dialog. Confirm the SQL query selects the correct columns and includes a filter clause, for example:
WHERE "Payables Invoices - Transactions Real Time"."Supplier"."Supplier Name" = :p_supplier_name
Click OK to save the query.
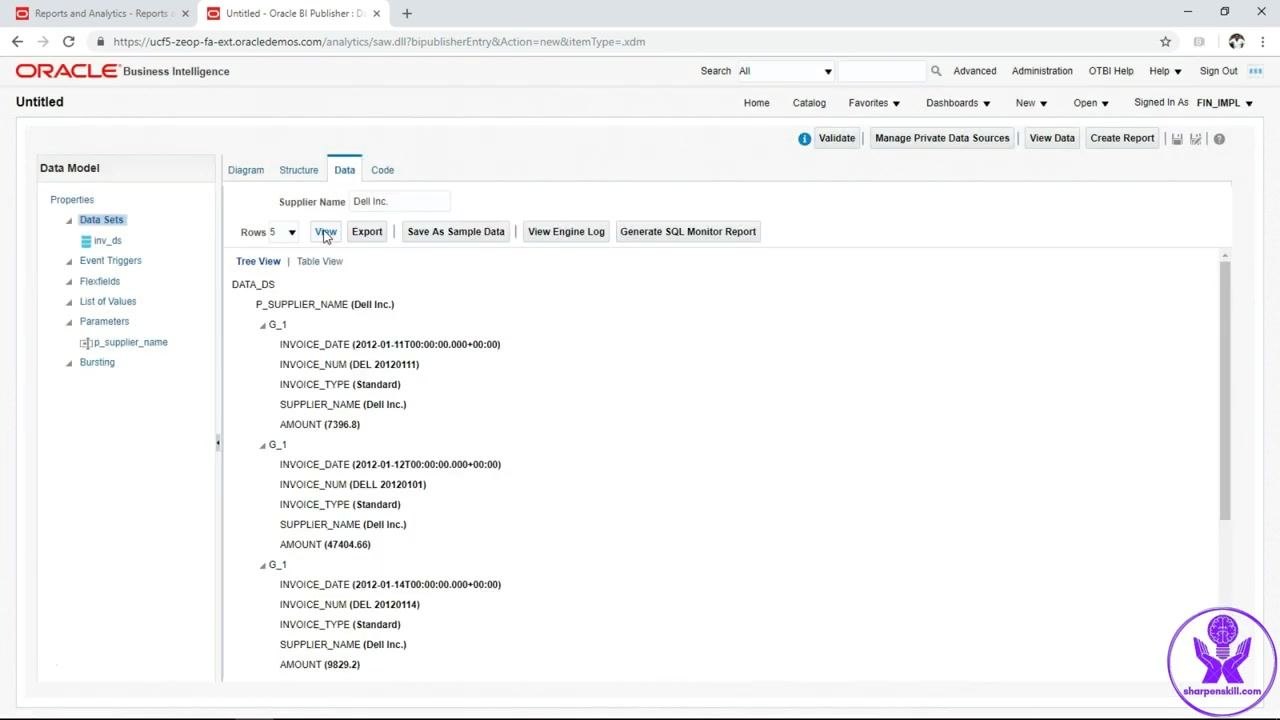
Enter a supplier name and preview the data
In the Data tab, enter a supplier name (for example, Dell Inc.) in the Supplier Name field and click View to display the results. The data for that supplier appears, including Invoice Date, Invoice Num, Invoice Type, Supplier Name, and Amount.
Review data model properties
Click Properties in the Data Model panel to review or adjust settings such as Default Data Source, Database Fetch Size, Query Time Out, Scalable Mode, Enable SQL Pruning, Backup Data Source options, Enable CSV Output, XML Output Options, and XML Tag Display.
Save and confirm the data model
Save the data model to preserve your configuration, then click View Data at the top of the screen to confirm the model returns the expected results.
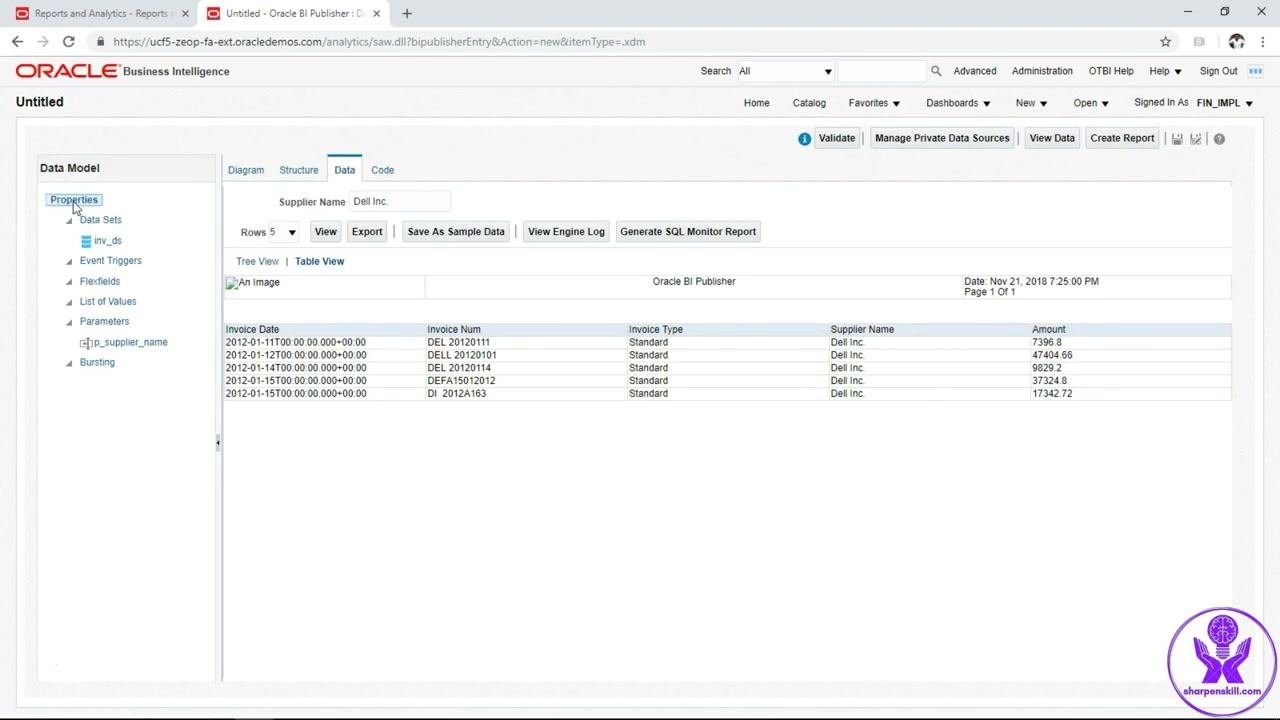
Save a sample of the data
In the Data tab, click Save As Sample Data to store a sample of the current data set for use when designing the report layout.
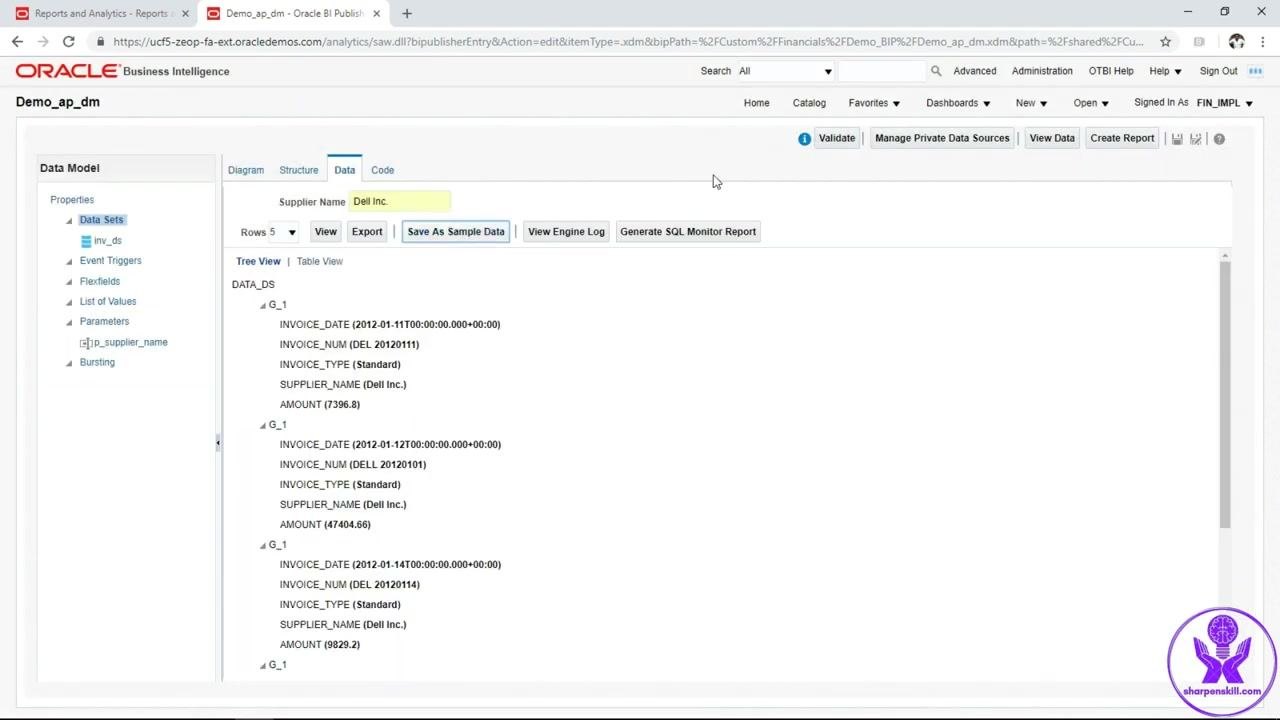
Start the report creation wizard
In the Data tab, click Create Report at the top right of the interface. This opens the Create Report wizard, which guides you through building a report based on your data model.
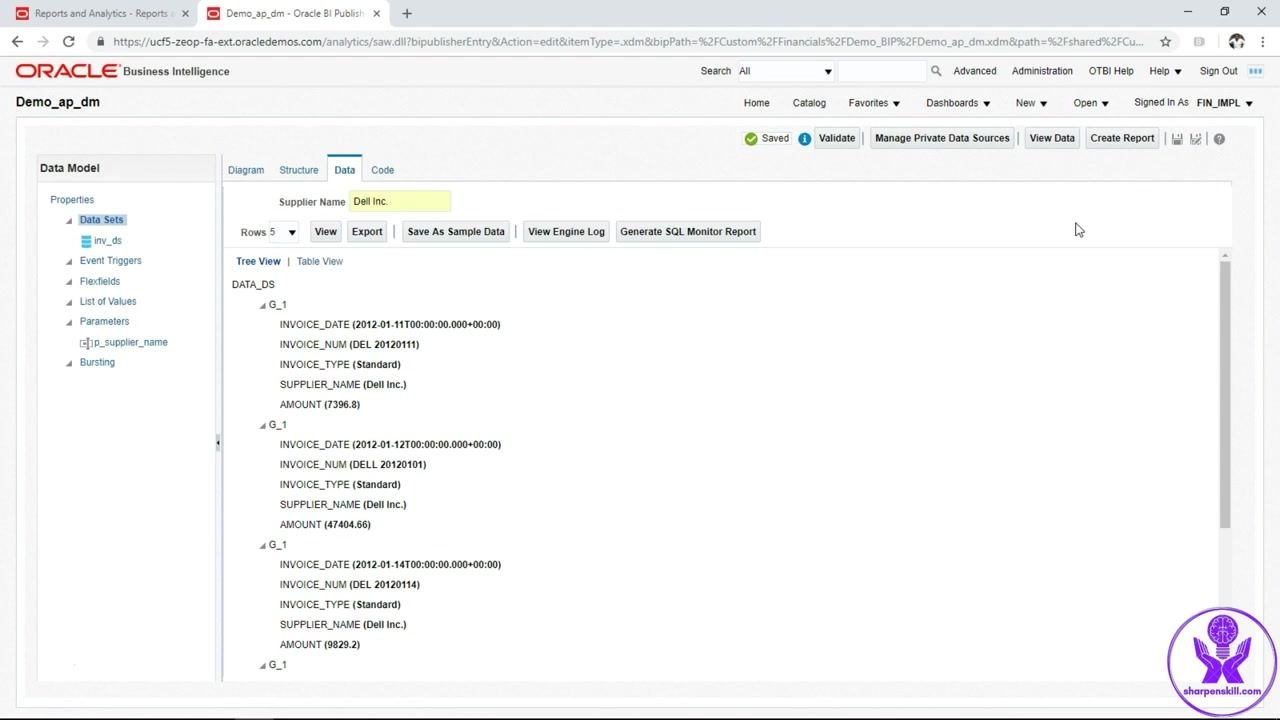
Choose the data model and creation method
In the Create Report dialog, confirm Use Data Model is selected and that the correct data model path is shown (for example, /Custom/Financials/Demo_BIP/Demo_ap_dm). Under "How do you want to create your report?", select Guide Me, then click Next.
Choose the report layout
In the Select Layout step, choose your preferred page orientation (Portrait or Landscape) and select Table for a tabular report. Click Next to continue.
Add fields to the table
In the Create Table step, drag the following fields from the Data Source panel into the table area: Invoice Num, Invoice Type, Invoice Date, Amount, and Supplier Name. The table preview updates to show sample data for these fields.
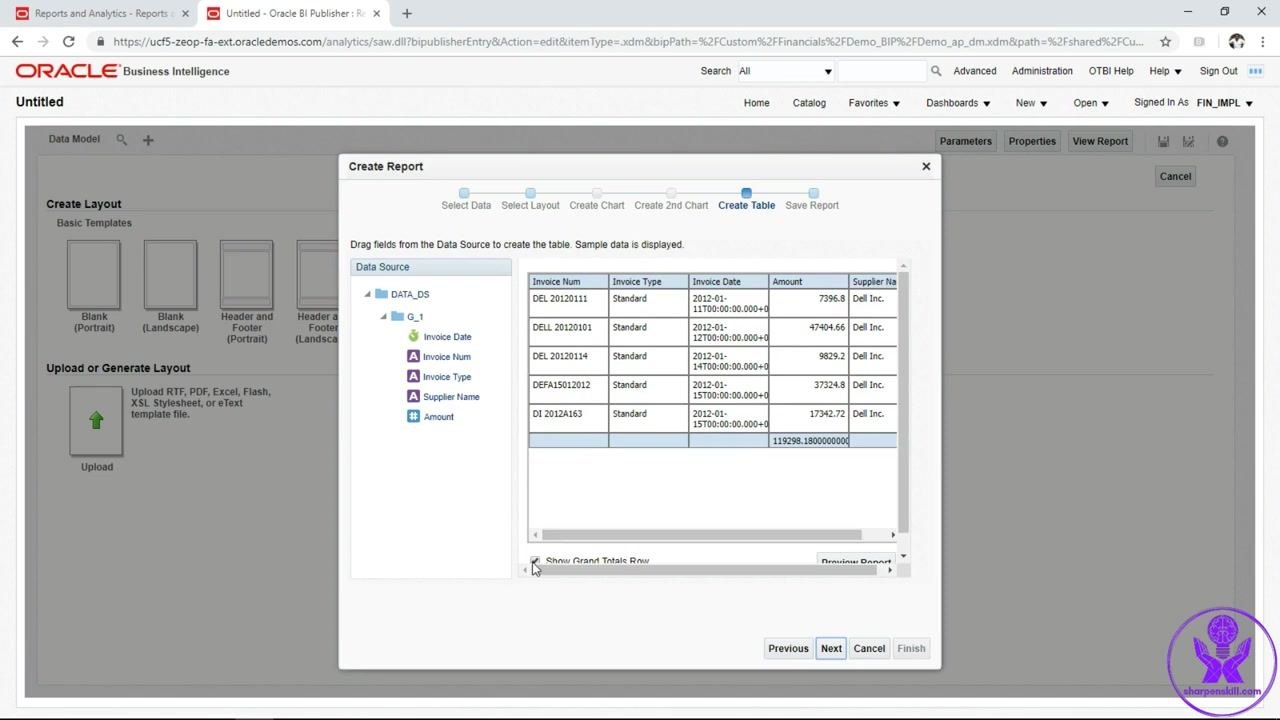
Adjust table options and save the report
Uncheck Show Grand Totals Row if you do not want a totals row, then click Next. Select Customize Report Layout if prompted, and click Finish. In the Save As dialog, choose a folder (for example, /Shared Folders/Custom/Financials/Demo_BIP), enter a report name such as Demo BIP Report, optionally add a description, and click OK.
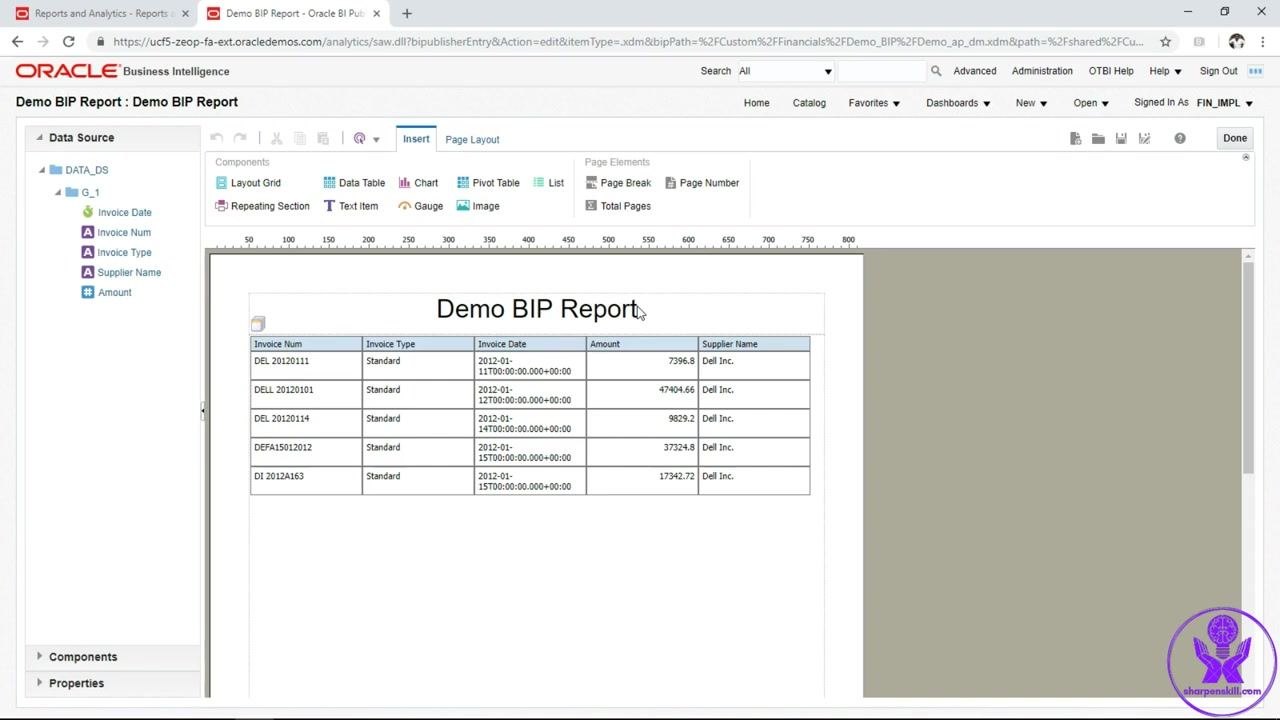
Review the report layout
The report layout editor opens, displaying your report with the selected fields in a table format and the report title at the top. Use the editing tools provided to remove the header or make other layout changes.
Make further edits if needed
If you need further changes — such as formatting, adding or removing fields, or adjusting properties — click Edit Report and make the necessary adjustments in the report editor.
Disable auto run in report properties
Open your report and click Properties to open the Report Properties dialog. Under the General tab, uncheck Auto Run to prevent the report from running automatically when opened. Review other settings as needed, such as Run Report Online, Show Controls, Allow Sharing Report Links, and Open Links in New Window, then click OK.
Apply the supplier filter
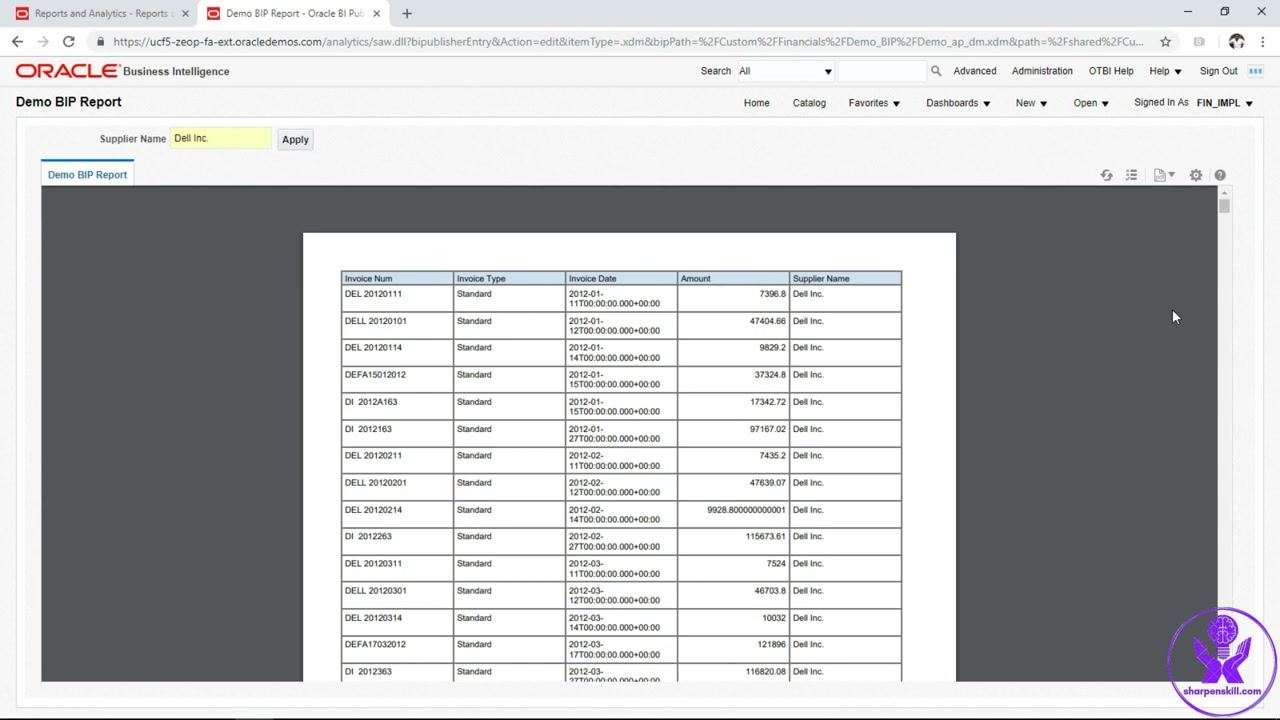
After saving the properties, the report interface shows a filter section at the top. Verify that "Dell Inc." is entered in the Supplier Name field, then click Apply to filter the report data for that supplier.
Review the generated report
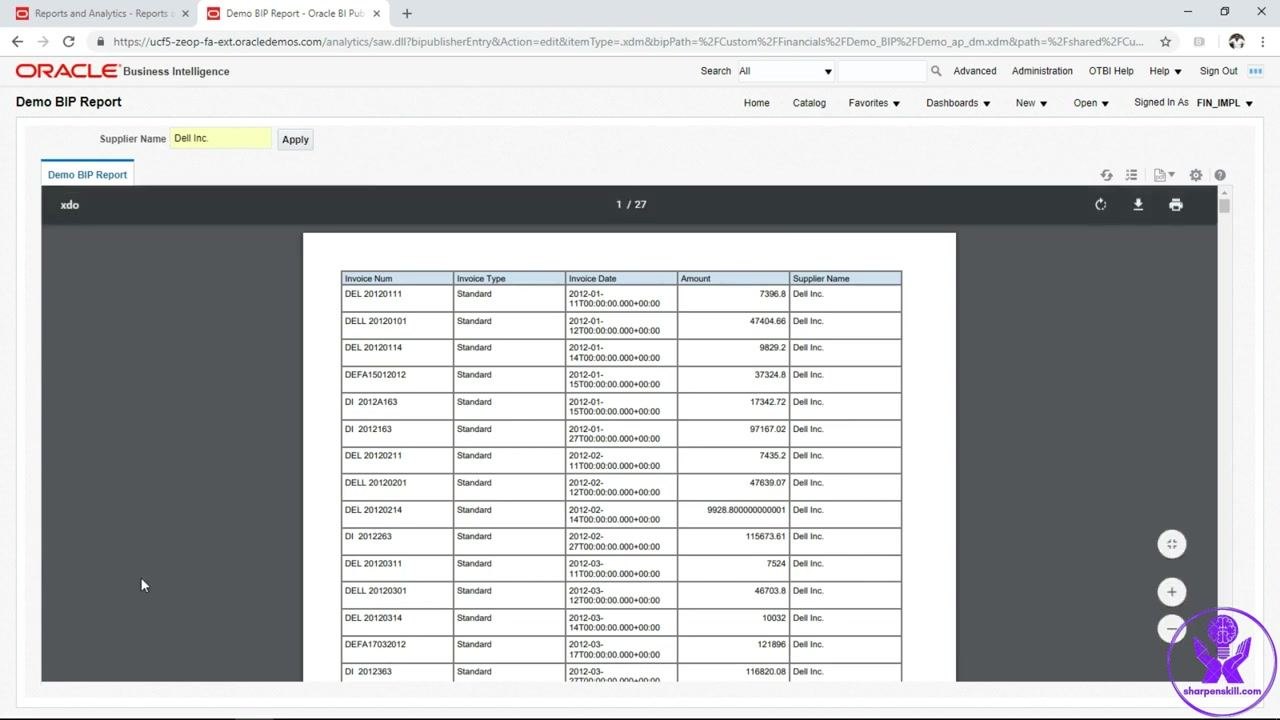
Once the filter is applied, the report displays a table with invoice data for "Dell Inc.," including the columns Invoice Num, Invoice Type, Invoice Date, Amount, and Supplier Name. Review the data to confirm it matches your expectations.
Navigate and export the report
Use the navigation controls above the report to move between pages if there is more than one page of data (for example, "1 / 27" indicates 27 pages). Use the toolbar options to export or print the report as needed.
Summary
You have now learned how to create an OTBI report in Oracle Fusion from start to finish: building a simple OTBI analysis, reusing its query in a BI Data Model, adding a supplier parameter for dynamic filtering, and designing a tabular BI Publisher report. With the report properties finalized and the supplier filter applied, you can navigate, export, or print your report as required.
Generation details: cost, quality tiers
Docsie billed 4,500 credits ($3.15) to analyze this 9-minute video at standard quality. The rewrite, template fill and Word/PDF exports were included. The same video at each quality tier:
| Quality | Frames sampled | Credits | Approx. cost |
|---|---|---|---|
| Draft | every 16-30 s | 2,250 | $1.57 |
| Standard (this guide) | every 8-15 s | 4,500 | $3.15 |
| Detailed | every 4-7 s | 9,000 | $6.30 |
| Ultra | every 1-3 s | 18,000 | $12.60 |
Credits priced at $0.70 per 1,000; plans include a monthly allowance. Enterprise customers on on-premise or bring-your-own-model deployments run this on their own inference and pay no per-video credits.
Generated by Docsie Video-to-Docs on 2026-10-01 from a 8-minute video. Screenshots are frames from the source video and belong to their creator, Oracle Fusion Technical, whose original is embedded above. If you own this video and want the guide removed or credited differently, contact us and we will act within one business day.