
How to Create a Custom Report in NetSuite
NetSuite gives you the tools to generate, view, and customize reports so you can track the metrics that matter to your business. This guide walks you through how to create a custom report in NetSuite, starting with standard and ad hoc reports, and then moving into advanced customization with the Report Builder.
Video: How to Create and Customize NetSuite Reports by SuiteRep. All credit for the demonstration goes to the creator; watch the original on YouTube. The written guide below was generated from this video by Docsie. Creator? Request a change or removal.
NetSuite gives you the tools to generate, view, and customize reports so you can track the metrics that matter to your business. This guide walks you through how to create a custom report in NetSuite, starting with standard and ad hoc reports, and then moving into advanced customization with the Report Builder.
Before you begin
NetSuite supports two main types of reports:
- Standard reports — pre-built reports organized by category that you can view and adjust.
- Ad hoc reports — reports you build from scratch based on a metric you choose.
Both report types can be further customized using the Report Builder, covered later in this guide.
Part 1: Work with standard reports
Step 1: Explore the Reports Dashboard
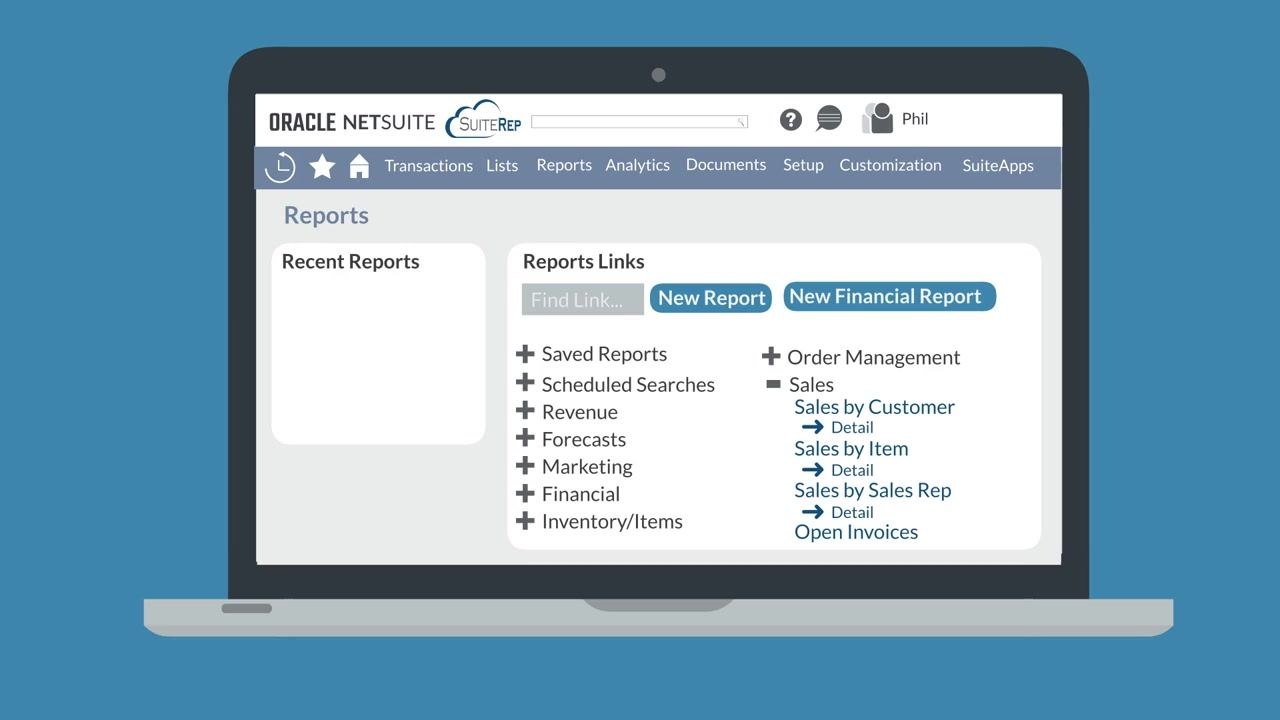
Navigate to the Reports Dashboard in NetSuite. The dashboard gives you access to all available reports, organized into categories for easy browsing. You can search for a specific report by keyword, or expand each category to see the reports it contains.
Step 2: Open a standard report
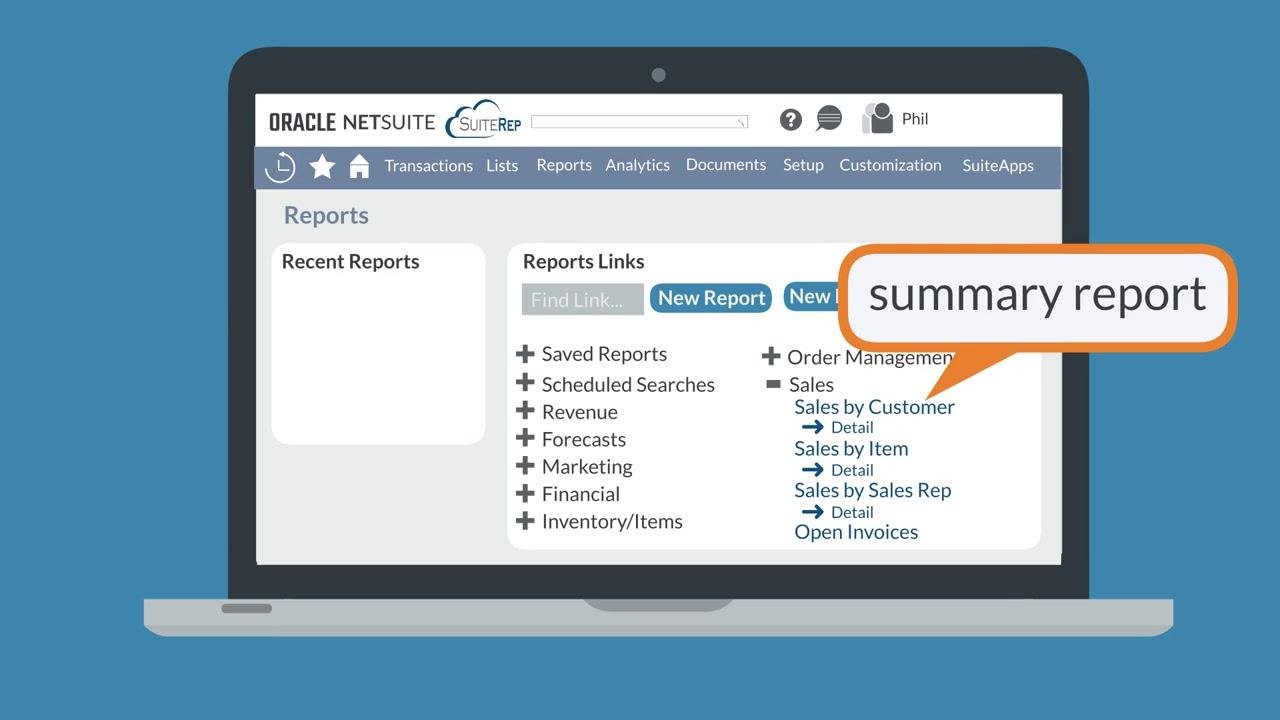
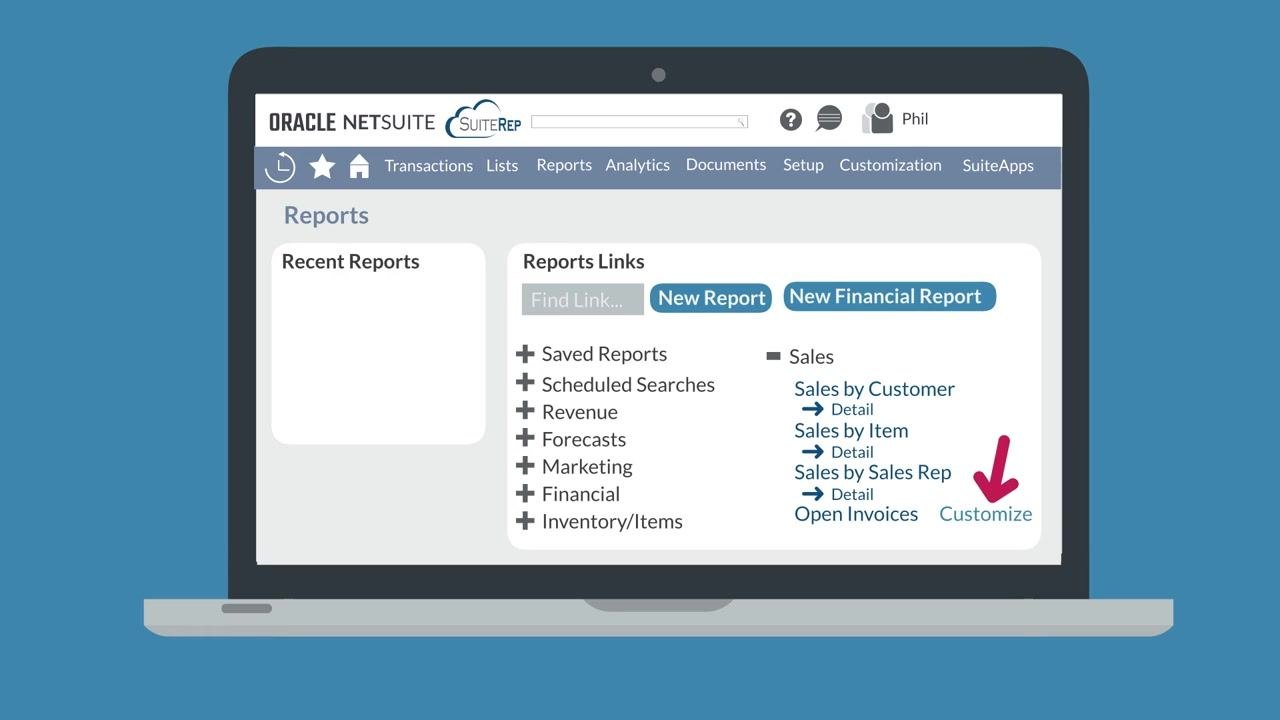
Find the report you need by searching or expanding the relevant category, then click the report name to open its summary version. Some reports also include a Detail link underneath the report name, which opens a more detailed version of the same report.
Step 3: Adjust the report display
Once a standard report is open, use the footer options to change how the data is displayed. Keep in mind that these adjustments only affect how you view the data on screen — they do not change the underlying data itself.
Part 2: Create an ad hoc report
Step 4: Start a new ad hoc report
From the Reports Dashboard, click the New Report button to begin building an ad hoc report.
Step 5: Choose a metric
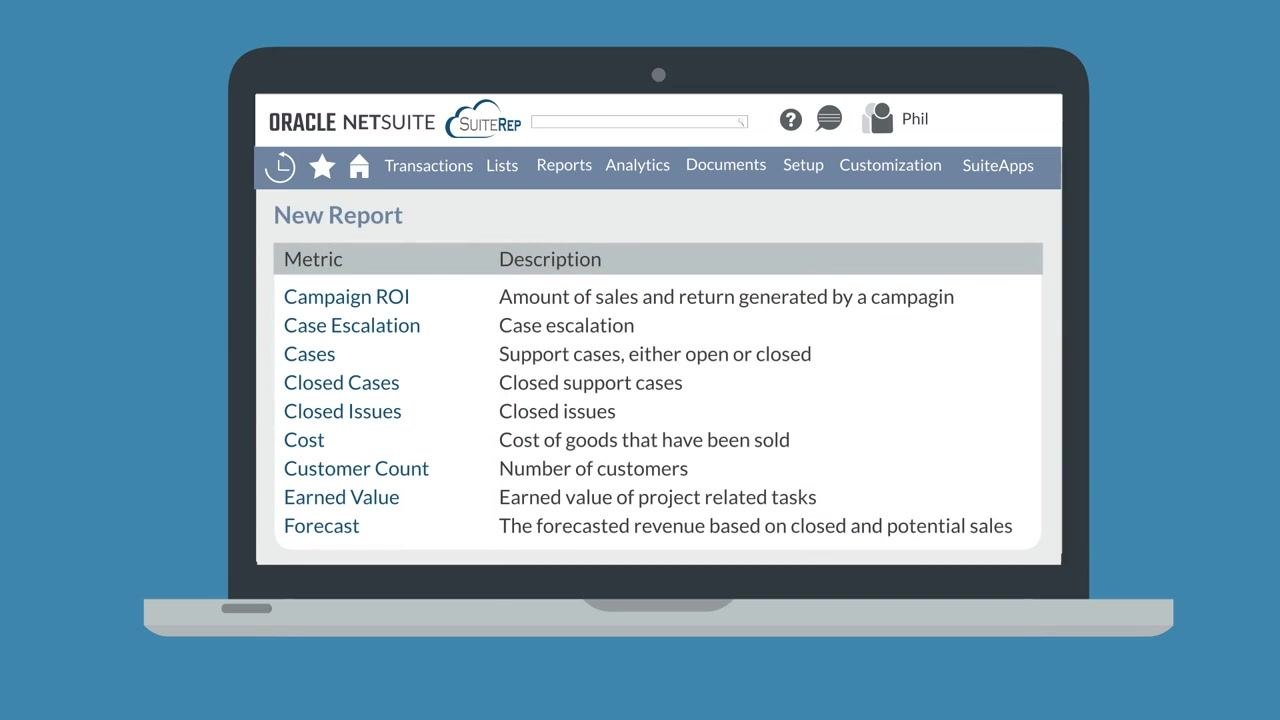
Select the metric you want to base your report on from the list provided. Example metrics include Campaign ROI, Case Escalation, Cases, Closed Cases, Closed Issues, Cost, Customer Count, Earned Value, and Forecast.
Step 6: Set report details and run the report
After choosing a metric, configure the following:
- The exact field to report on (for example, Metric: Sales Total)
- The report format: Summary, Detail, or Matrix
- How to subtotal the report (for example, by Lead Source)
The options available depend on the metric you selected. Once configured, click Run Report to generate it, or save it for future use.
Part 3: Customize reports with the Report Builder
Step 7: Open the Report Builder for advanced customization
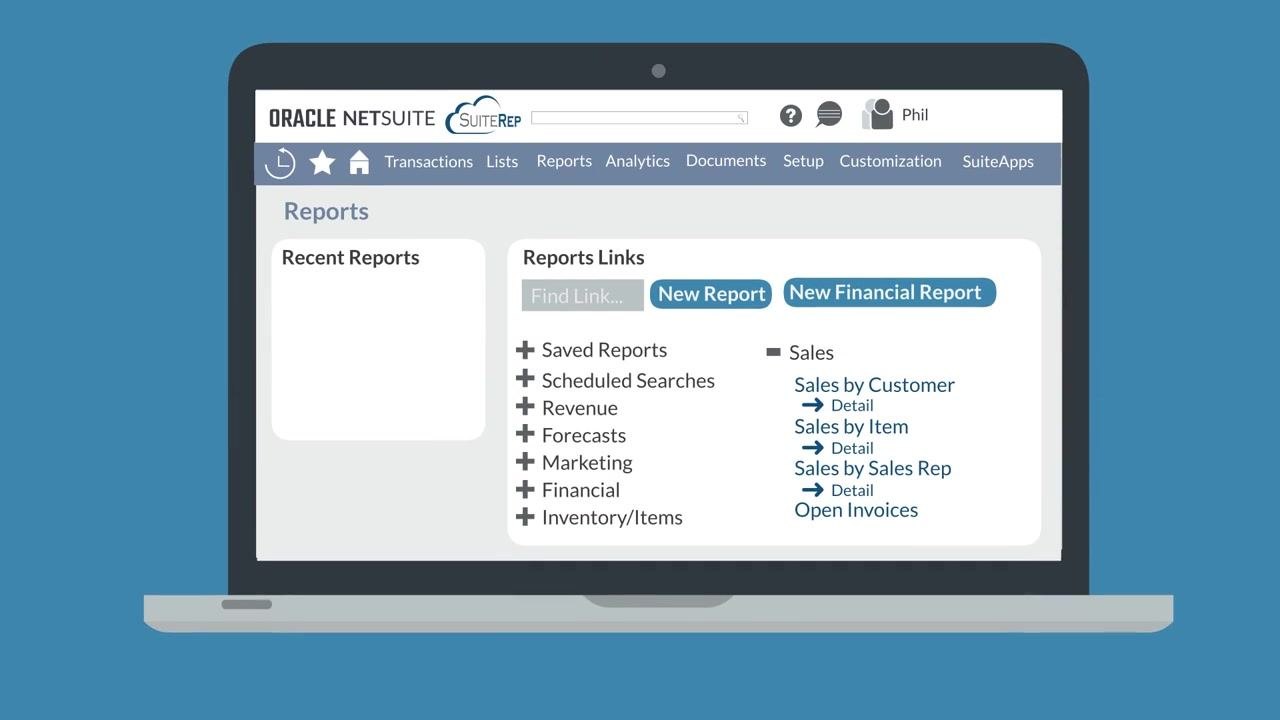
For deeper customization, use the Report Builder. You can access it from the Reports Dashboard, from a standard report by hovering over the report name and selecting Customize, or while creating an ad hoc report.
Step 8: Launch the Report Builder
Hover over a standard report's name and select the Customize link that appears beside it. Alternatively, select Customize at the bottom of an open standard report, or select More Customization while creating an ad hoc report.
Step 9: Get familiar with the Report Builder interface
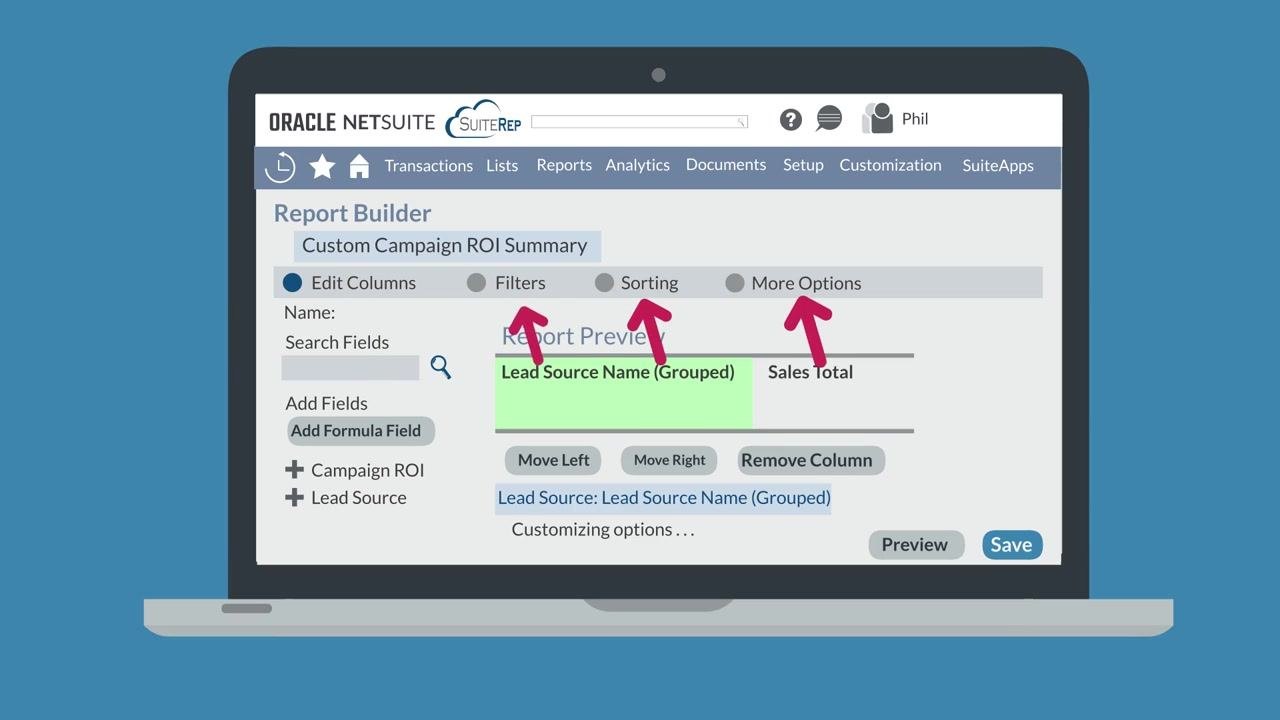
The Report Builder is organized into four sections: Edit Columns, Filters, Sorting, and More Options. Move between them by selecting the section name at the top of the page.
Step 10: Edit columns in your report
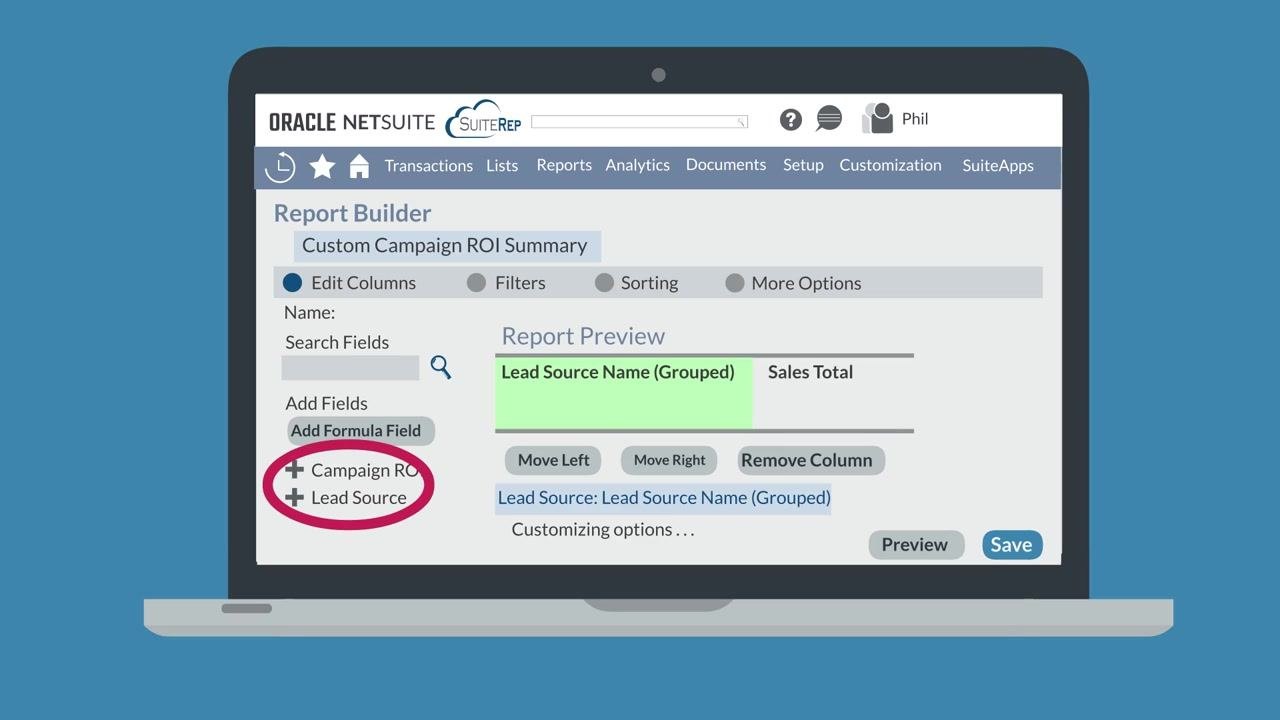
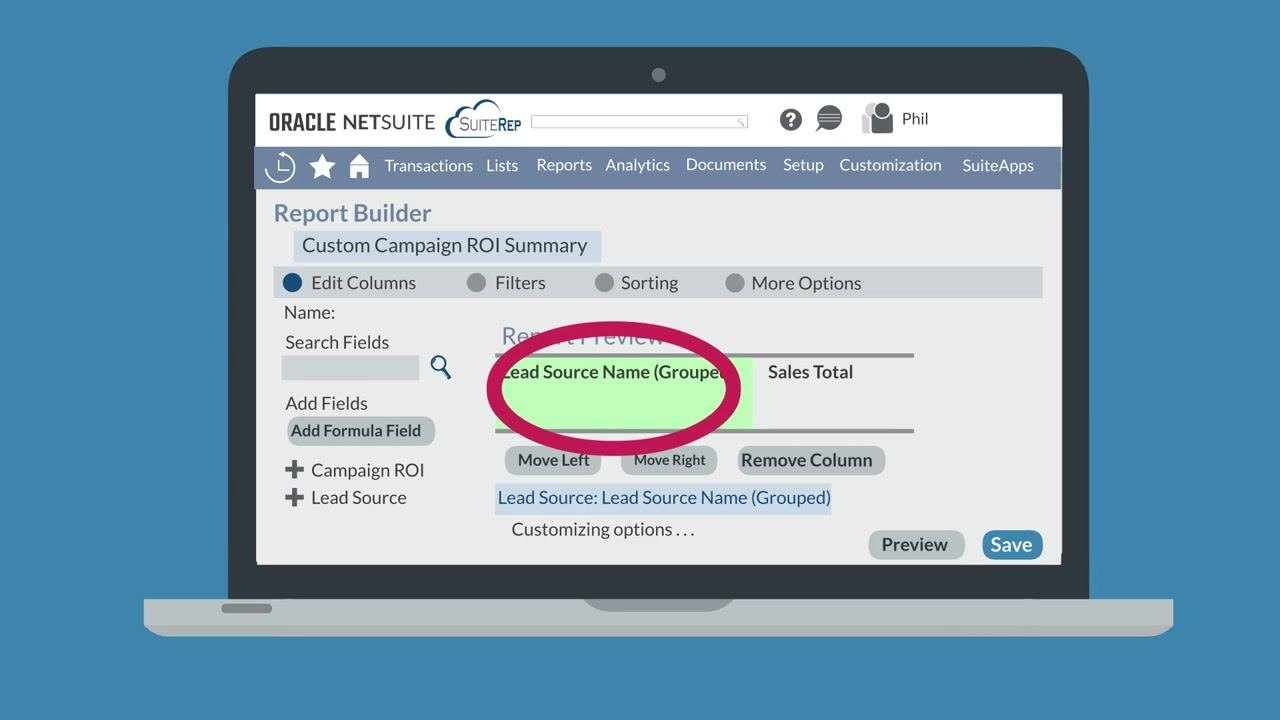
To add a field, expand the relevant section on the left side of the page, such as Campaign ROI or Lead Source, and select the field you want.
Step 11: Search for a specific field
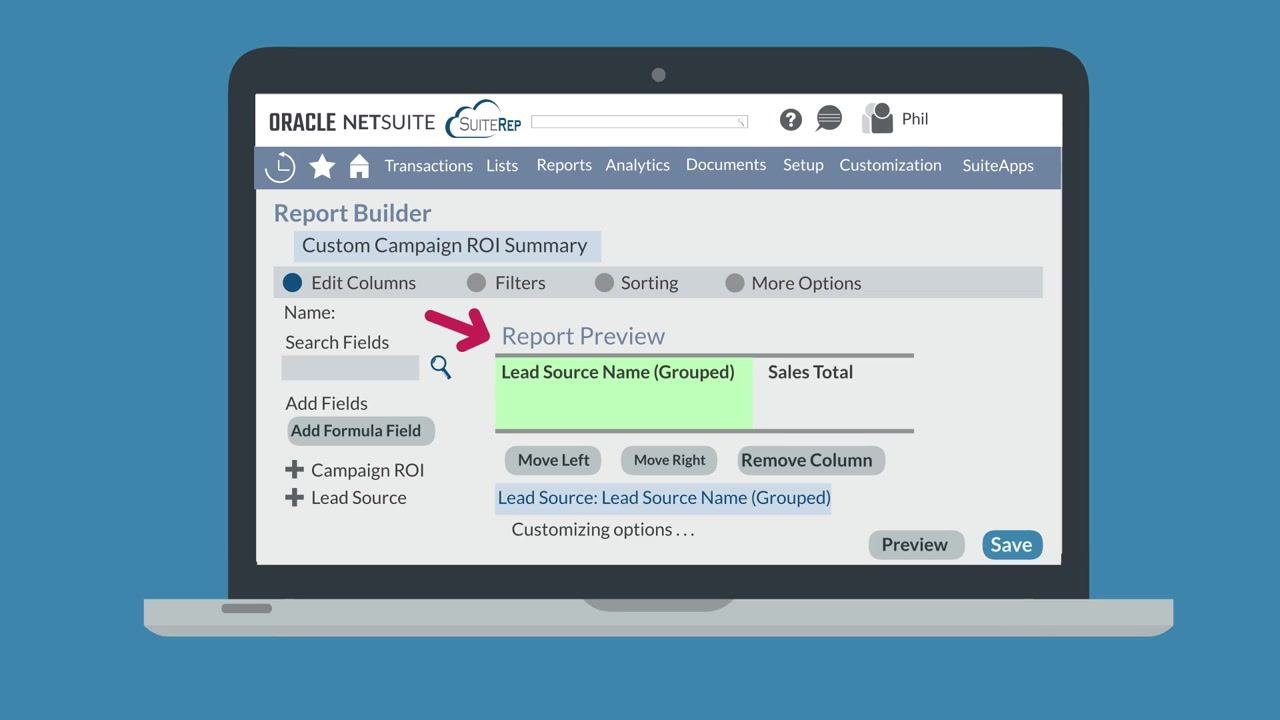
If you already know the name of the field you need, use the Search Fields bar to find it quickly. You can also select Add Formula Field to insert a calculated field. As you make changes, the Report Preview pane updates in real time.
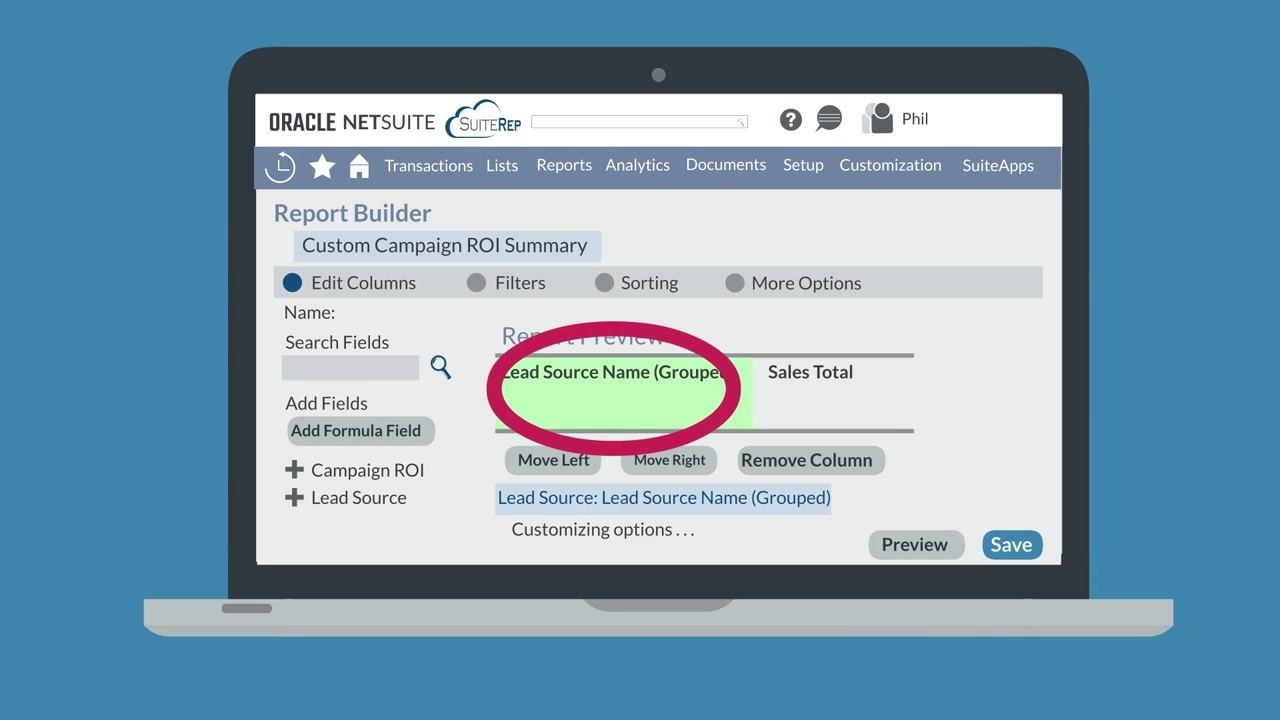
Step 12: Customize a selected column
Select a column in the Report Preview pane to display its customization options directly below the pane. These options vary depending on the field type.
Step 13: Set filters for your report
Click Filters at the top of the Report Builder. On the left, you'll see the fields available for filtering. Add a field and set the values that define the filter.
- Check Show in Filter Region if you want users to adjust this filter directly on the report.
- Leave it unchecked if the filter should restrict results permanently and not be user-editable.
Part 4: Fine-tune sorting and report options
Step 14: Set the sort order
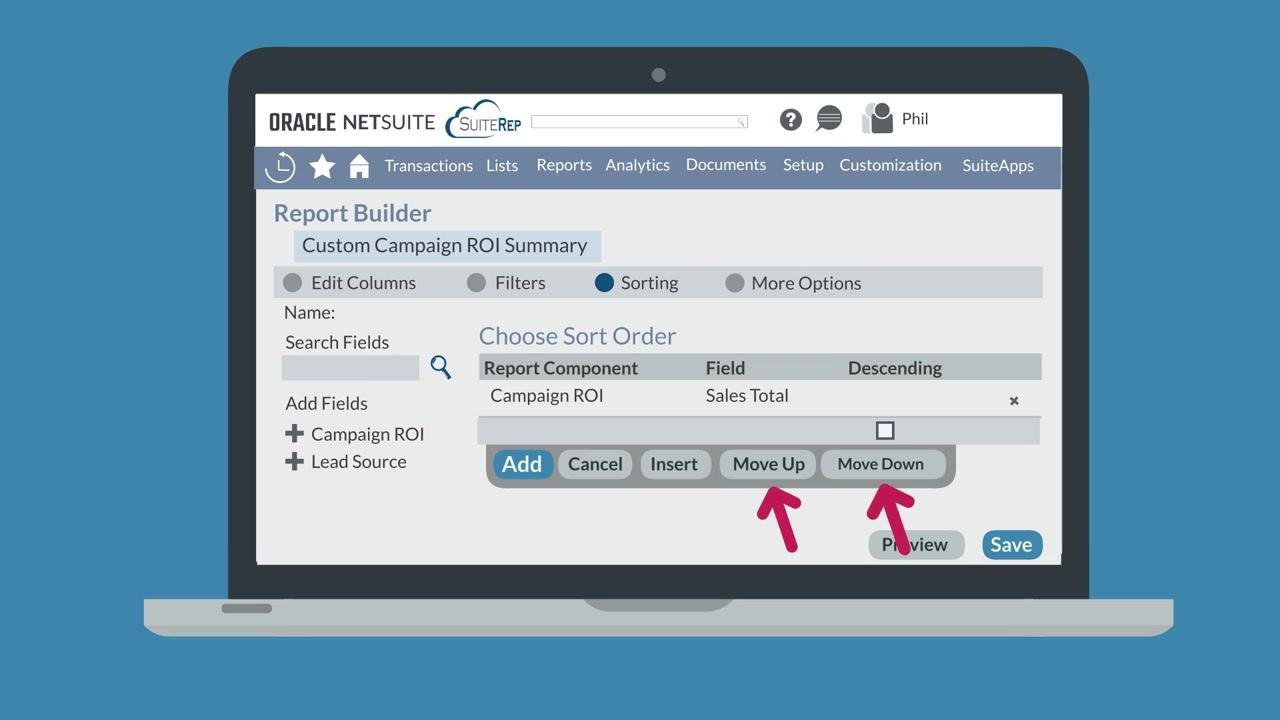
Go to the Sorting tab and use the Choose Sort Order area to select a field. Use Move Up and Move Down to reorder sorting fields, or select the X next to a row to remove it. Since this section has no live preview, select Preview at the bottom of the page to see the effect of your changes.
Step 15: Configure more options
Select the More Options tab to access additional report settings:
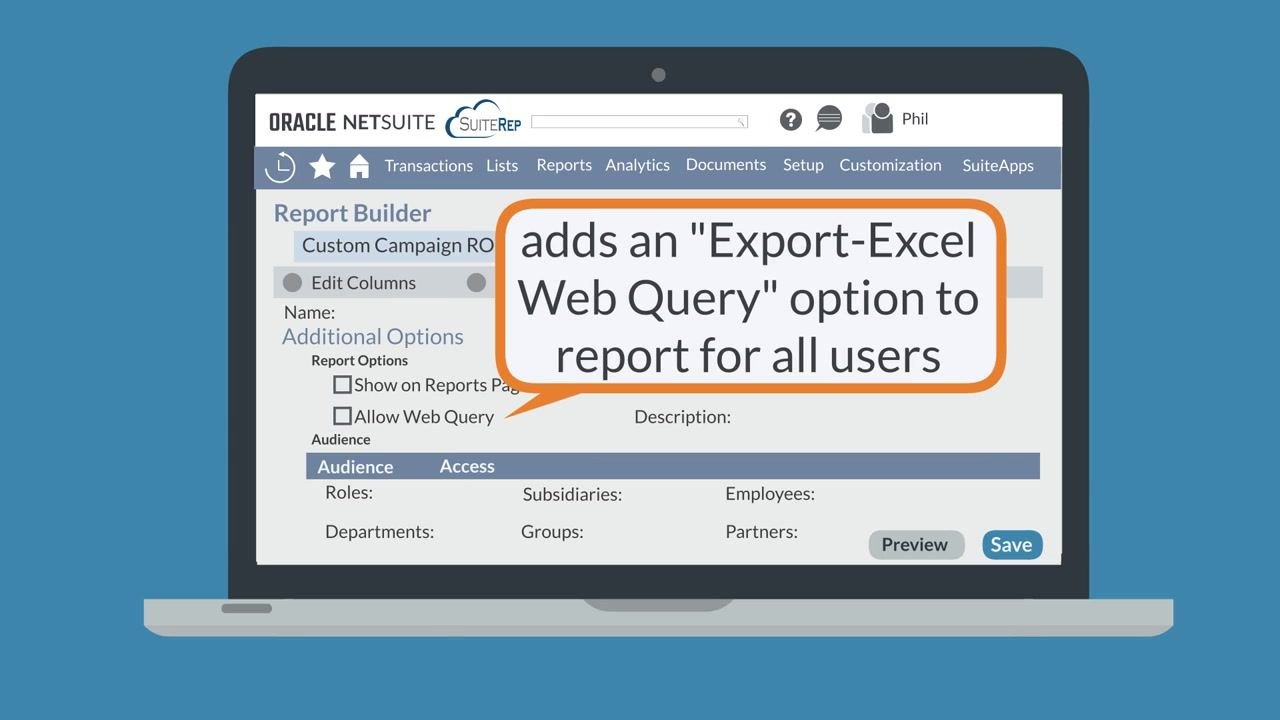
- Show on Reports Page — places the report in the Saved Reports section of the Reports Dashboard.
- Allow Web Query — enables the Export Excel Web Query option for all users who can access the report.
- Expand Level — sets the default expand level for the report.
- ID and Description — identify the report as needed.
Step 16: Set the report audience
In the Audience section, select which roles, departments, subsidiaries, groups, employees, or partners should have access. Selected users will see the report in their Saved Reports list on the Reports Dashboard.
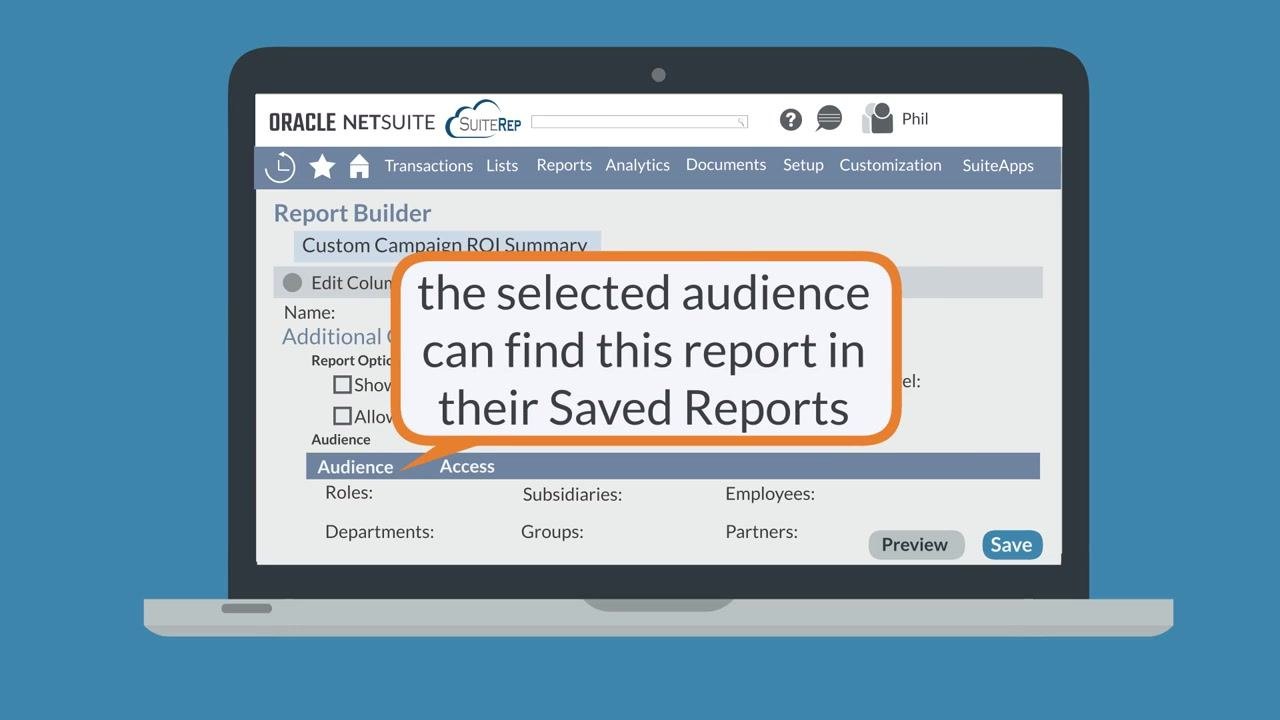
Step 17: Configure access permissions
The Access tab offers the same options as Audience but is more powerful. Selecting a user here overrides their typical permissions, allowing them to run the report even if they lack access to the underlying standard report.
Part 5: Understand Audience vs. Access
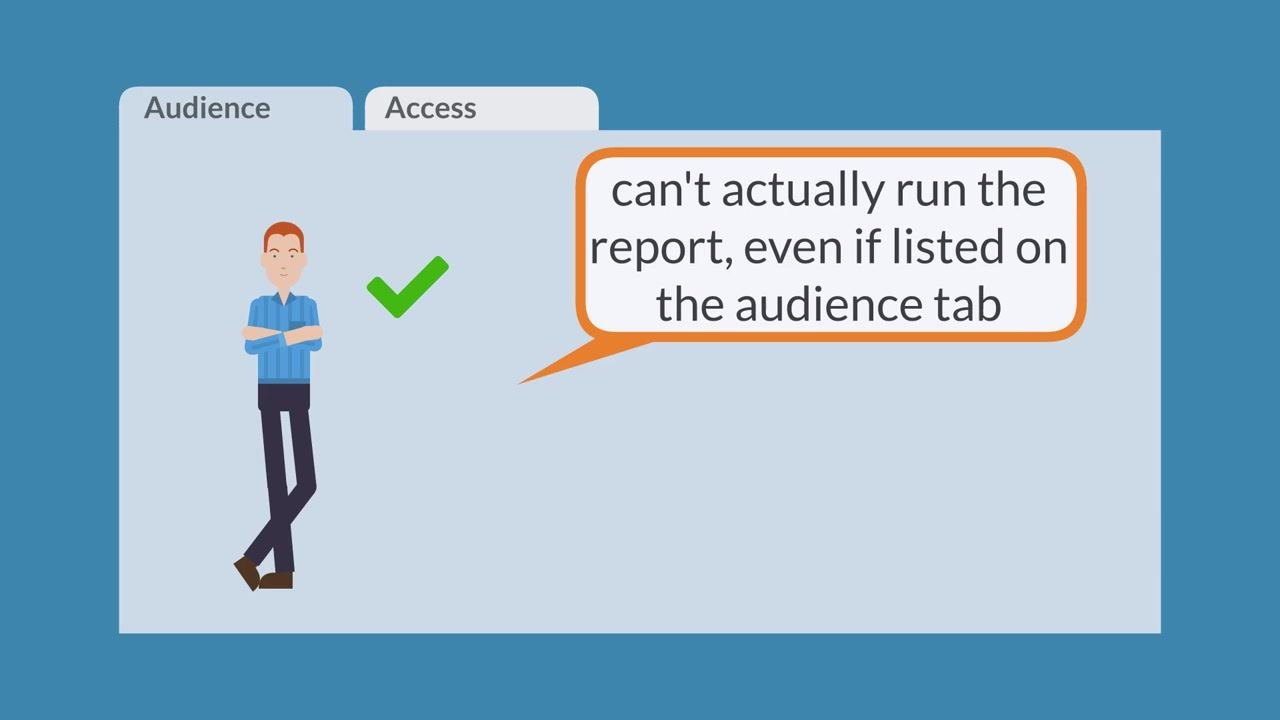
Step 18: Know the limits of the Audience tab
Users listed only on the Audience tab may not be able to actually run the report if their standard permissions don't allow it, even though the report appears in their Saved Reports list.
Step 19: Use the Access tab with caution
The Access tab is available only to account administrators. Granting access through this tab overrides a user's standard permissions, letting them run the report even without access to the underlying standard report. Use this capability carefully, since it grants elevated access beyond normal role-based permissions.
Step 20: Save your customized report
Once you've finished configuring columns, filters, sorting, and options, select Preview to review the report. If it looks correct, select Save to finalize your customized report.
What's next
With these steps, you now know how to create a custom report in NetSuite, from opening standard reports and building ad hoc reports to fine-tuning them with the Report Builder. Only account administrators or users with the necessary permissions can see and use the Access tab, so confirm your permissions before modifying access settings. For additional help with NetSuite reports or more advanced features, consult your NetSuite administrator or explore professional NetSuite services through SuiteRep.
Generation details: cost, quality tiers
Docsie billed 3,000 credits ($2.10) to analyze this 6-minute video at standard quality. The rewrite, template fill and Word/PDF exports were included. The same video at each quality tier:
| Quality | Frames sampled | Credits | Approx. cost |
|---|---|---|---|
| Draft | every 16-30 s | 1,500 | $1.05 |
| Standard (this guide) | every 8-15 s | 3,000 | $2.10 |
| Detailed | every 4-7 s | 6,000 | $4.20 |
| Ultra | every 1-3 s | 12,000 | $8.40 |
Credits priced at $0.70 per 1,000; plans include a monthly allowance. Enterprise customers on on-premise or bring-your-own-model deployments run this on their own inference and pay no per-video credits.
Generated by Docsie Video-to-Docs on 2026-10-01 from a 5-minute video. Screenshots are frames from the source video and belong to their creator, SuiteRep, whose original is embedded above. If you own this video and want the guide removed or credited differently, contact us and we will act within one business day.