
How to Create a View in Dynamics 365
Learning how to create a view in Dynamics 365 lets you filter, sort, and customize the way records appear in Opportunities, Accounts, or any other entity—so you only see the information relevant to your workflow. This guide walks you through building a custom view from the Opportunities grid, saving it for future use, and then creating a personalized dashboard in Dynamics 365 Sales Hub that brings your activities, pipeline, and opportunities together in one place.
Video: How to Create and Manage Custom Views & Dashboards in Dynamics 365 | enCloud9 by enCloud9 | Dynamics 365 & Copilot AI. All credit for the demonstration goes to the creator; watch the original on YouTube. The written guide below was generated from this video by Docsie. Creator? Request a change or removal.
Learning how to create a view in Dynamics 365 lets you filter, sort, and customize the way records appear in Opportunities, Accounts, or any other entity—so you only see the information relevant to your workflow. This guide walks you through building a custom view from the Opportunities grid, saving it for future use, and then creating a personalized dashboard in Dynamics 365 Sales Hub that brings your activities, pipeline, and opportunities together in one place.
Prerequisites
- Access to Dynamics 365 Sales Hub with permission to view and edit Opportunities records.
- Permission to create and save personal views.
- Access to the Power Apps dashboard editor to create and configure dashboards.
Creating a custom view in Dynamics 365
Step 1: Open the Opportunities section
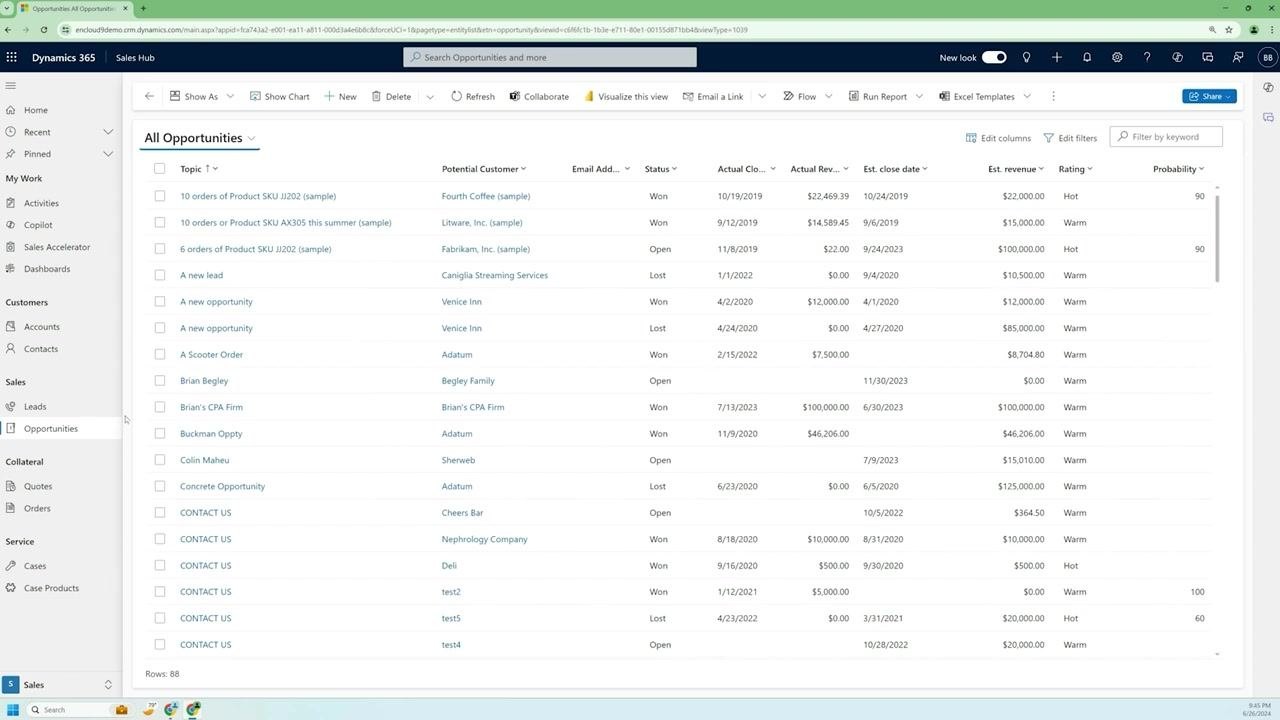
In the left navigation panel of Dynamics 365 Sales Hub, you'll see sections such as Home, Recent, Pinned, Activities, Accounts, Contacts, Leads, Opportunities, Quotes, Orders, and Cases. Select Opportunities under the Sales category to open the full opportunities list.
Step 2: Review the All Opportunities view
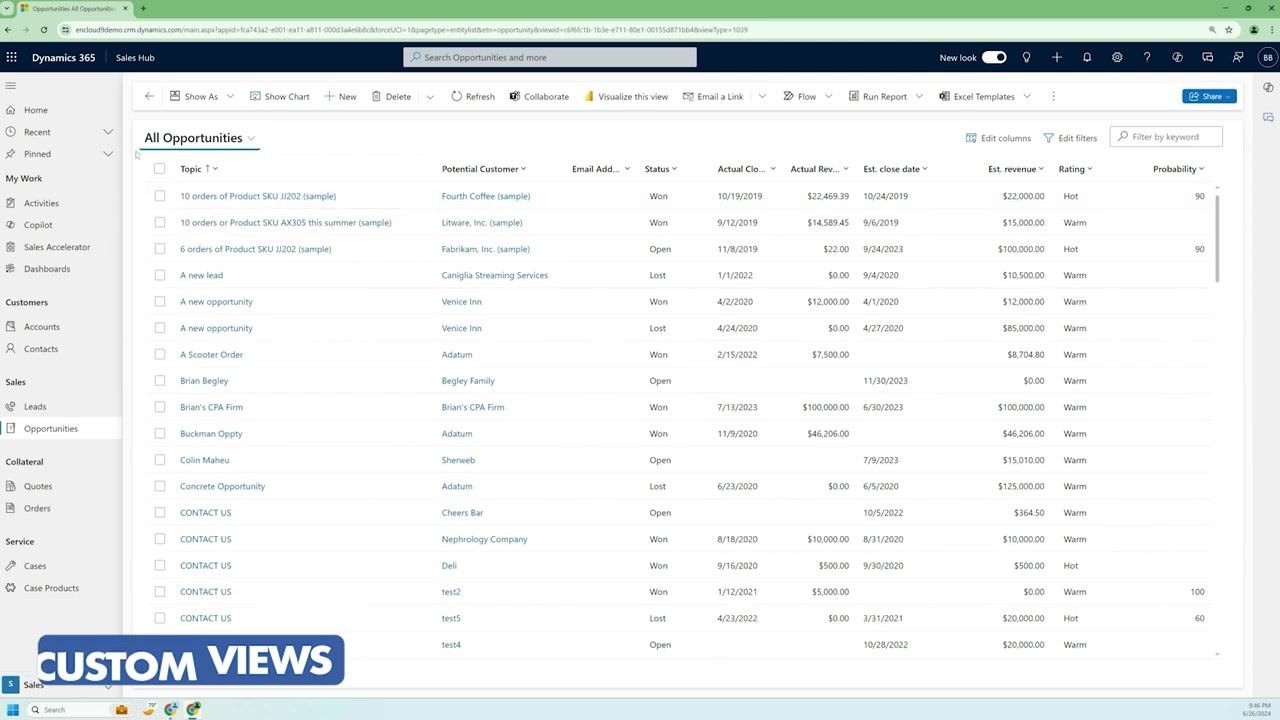
The All Opportunities view at the top of the main panel lists every opportunity in Dynamics 365, regardless of whether it's won, lost, or open. The total row count appears at the bottom left of the grid (for example, Rows: 88), giving you a comprehensive overview of all sales opportunities in your system.
Step 3: Start filtering by column
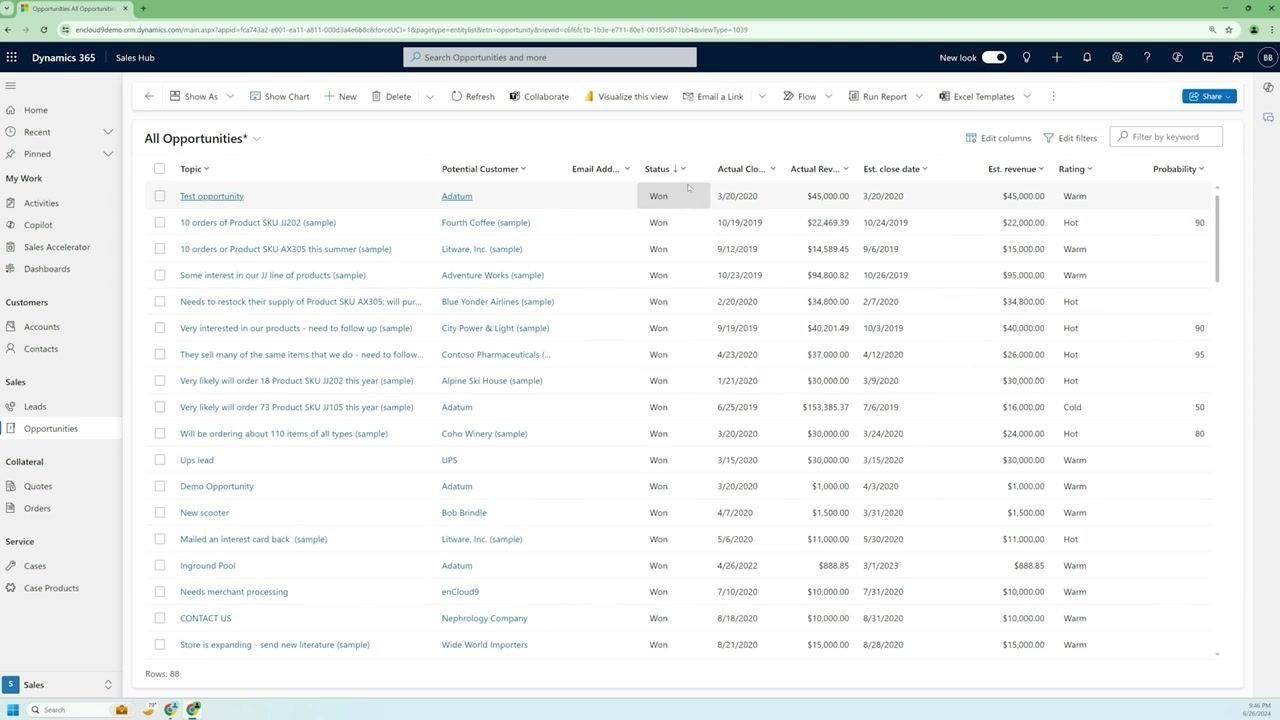
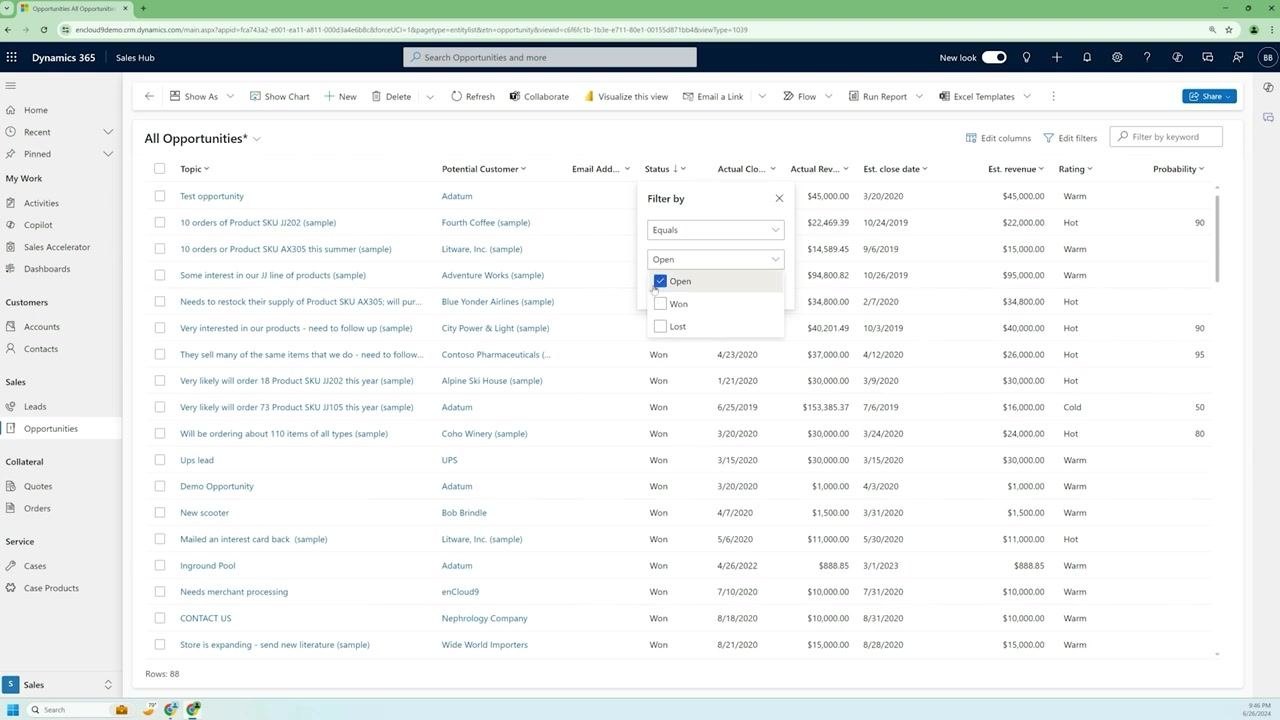
To focus on relevant information, use in-place filtering on any column. Click the Status column header to begin narrowing the list.
Step 4: Filter opportunities by status
In the filter dropdown, select Equals and check the box for Open. This filters the list so it only displays opportunities with an open status, reducing the count from all records (e.g., 88 rows) to only open ones (e.g., 29 rows).
Step 5: Add a second filter for estimated close date
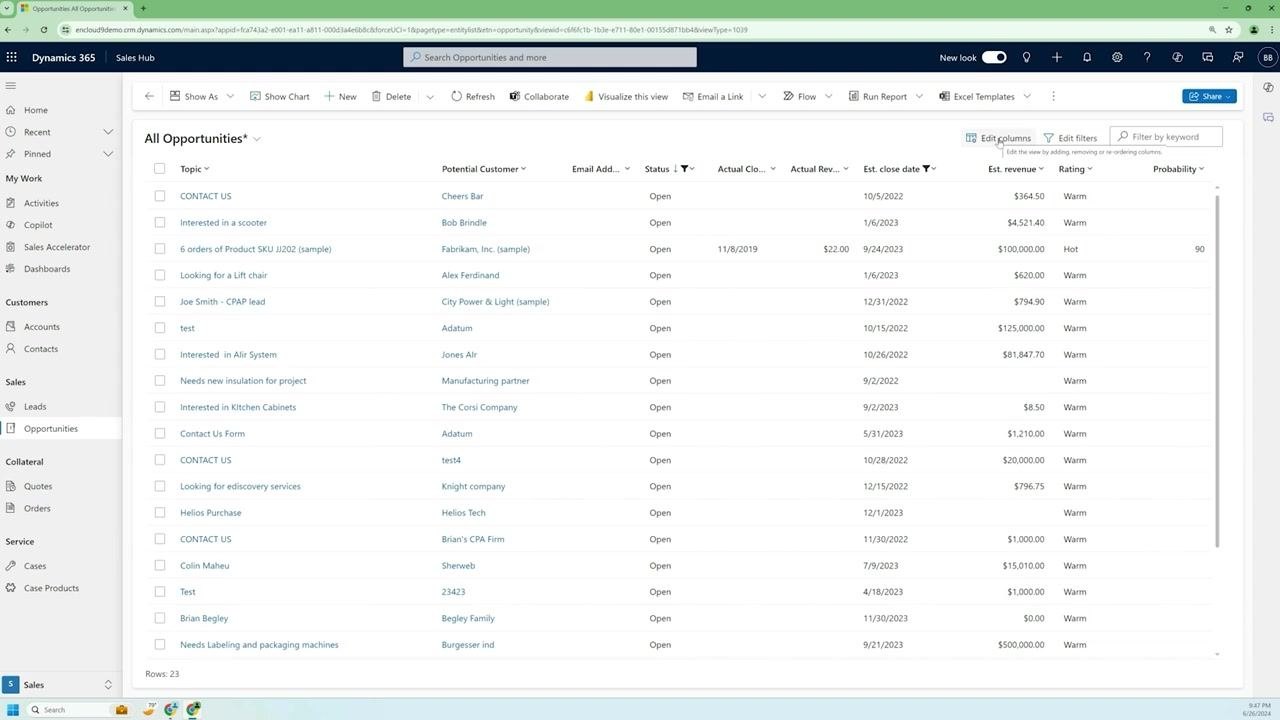
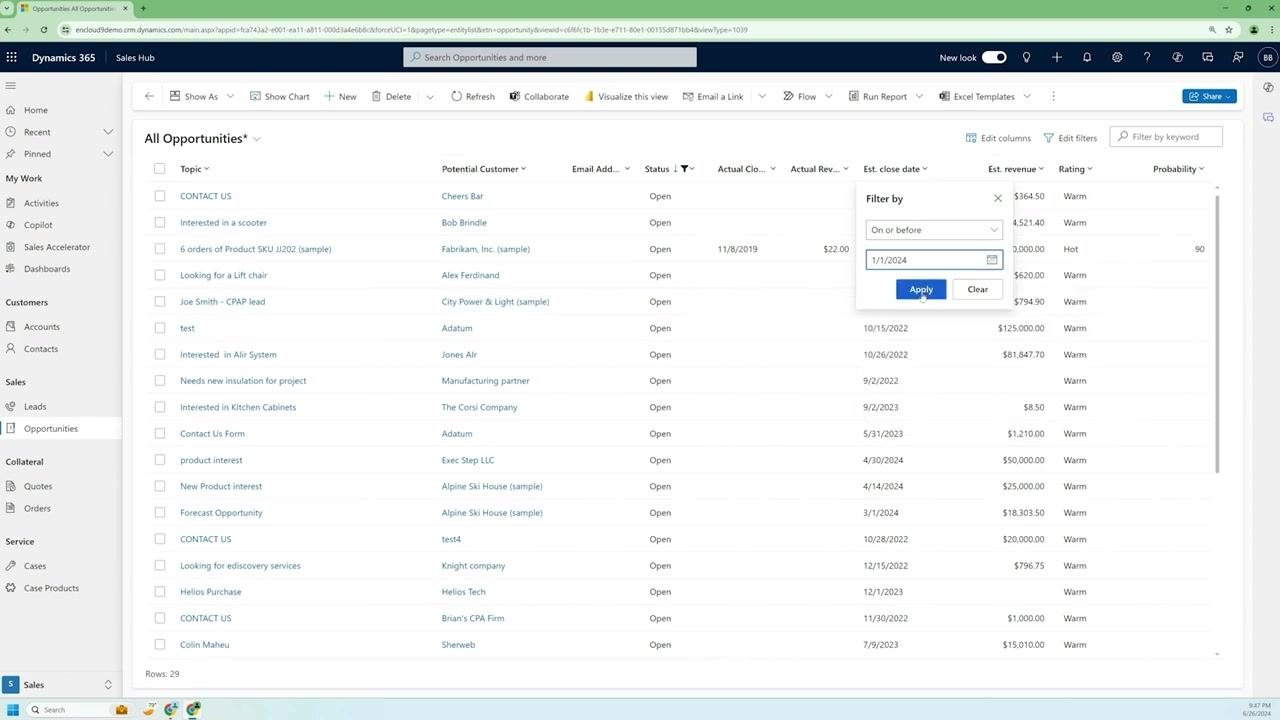
With the status filter still applied, click the filter icon on the Est. close date column. Select On or before and enter the date 1/1/2024, then click Apply to filter the list further.
Step 6: Review the filtered results
The list now shows only open opportunities with an estimated close date on or before January 1, 2024. The record count updates accordingly (e.g., 23 rows shown at the bottom left).
Step 7: Open the column editor
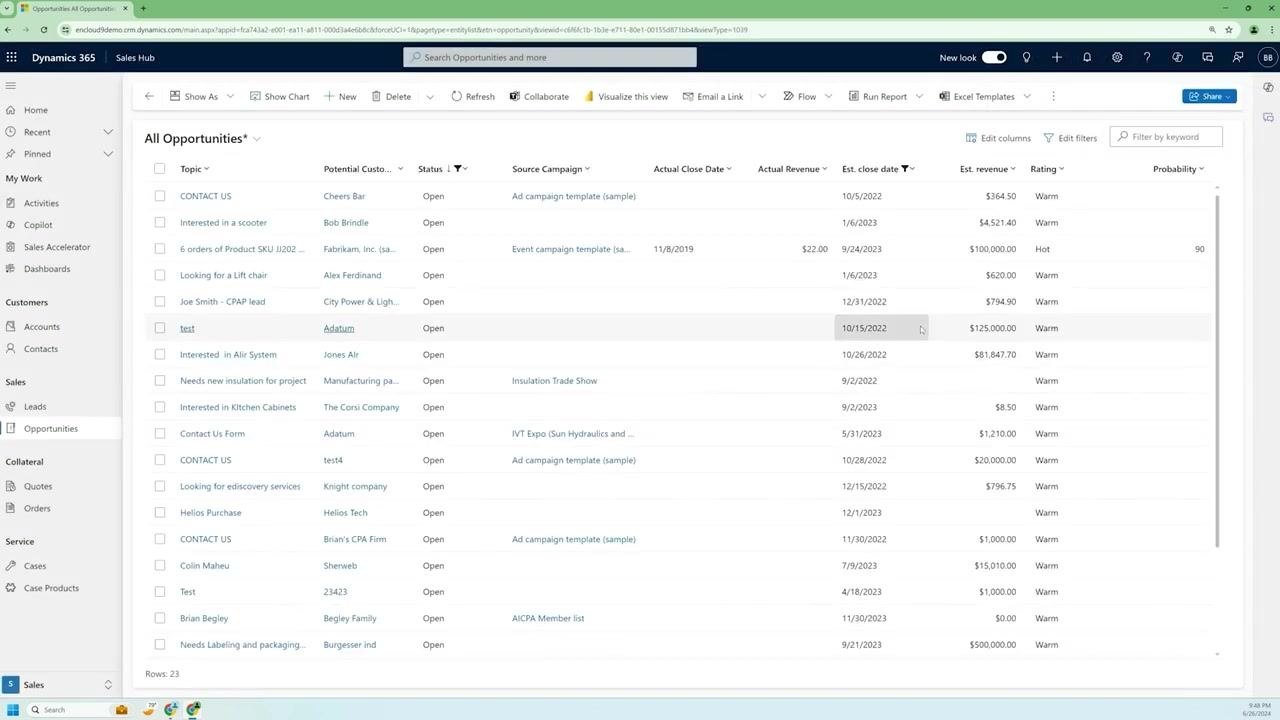
To customize which columns appear, click Edit columns at the top right of the opportunities grid. This opens the column customization panel.
Step 8: Remove a column
In the Edit columns: Opportunities panel, click a column name you want to remove (for example, Email Address), then select Remove from the dropdown.
Step 9: Add a new column
Click + Add columns at the top of the panel, then type the name of the column you want to add—for example, Source Campaign—into the search box and select it from the results.
Step 10: Reorder and apply column changes
Drag the newly added Source Campaign column to your desired position in the list, then click Apply at the bottom of the panel to save your changes.
Step 11: Confirm the updated grid
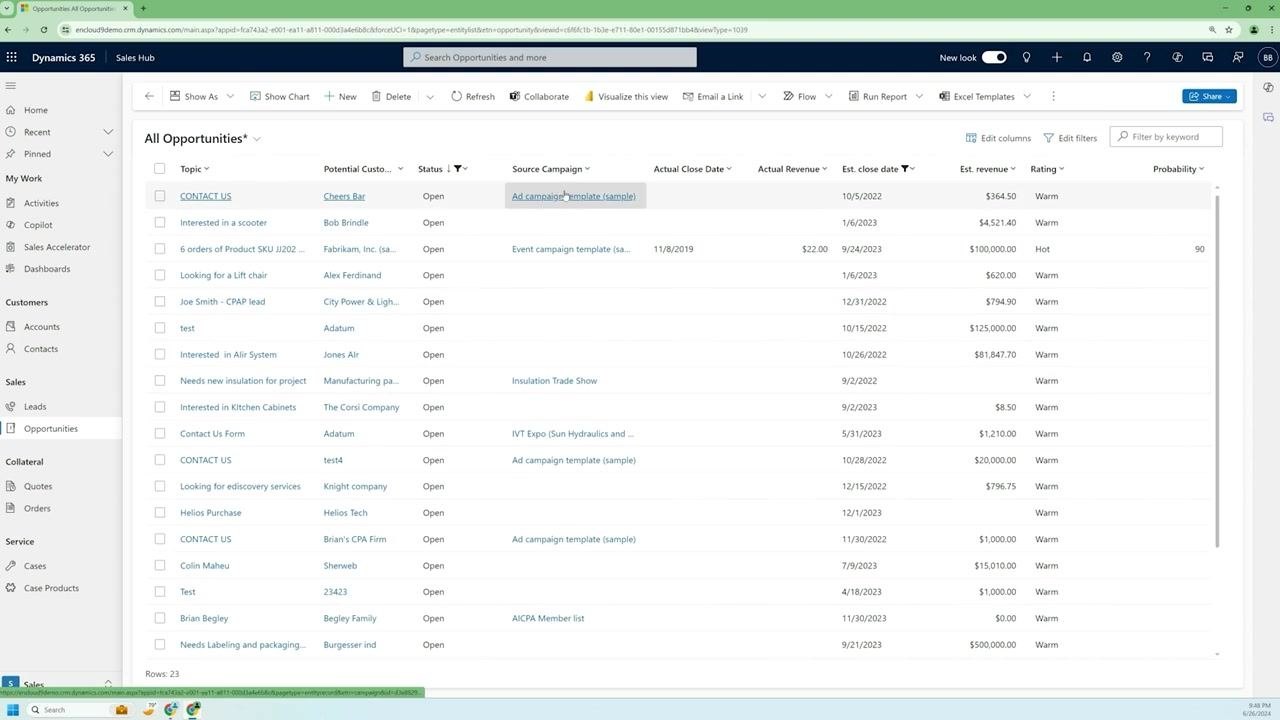
The grid now displays the Source Campaign column alongside your other selected columns, with all filters still in effect (status "Open" and estimated close date on or before 1/1/2024).
Step 12: Verify your data and filters
Confirm that the opportunities listed match your filter criteria and that the Source Campaign column is populated where applicable.
Saving your custom view
Step 13: Review your customized view
Before saving, confirm that all desired filters and columns are applied—status "Open," estimated close date on or before 1/1/2024, and the Source Campaign column visible.
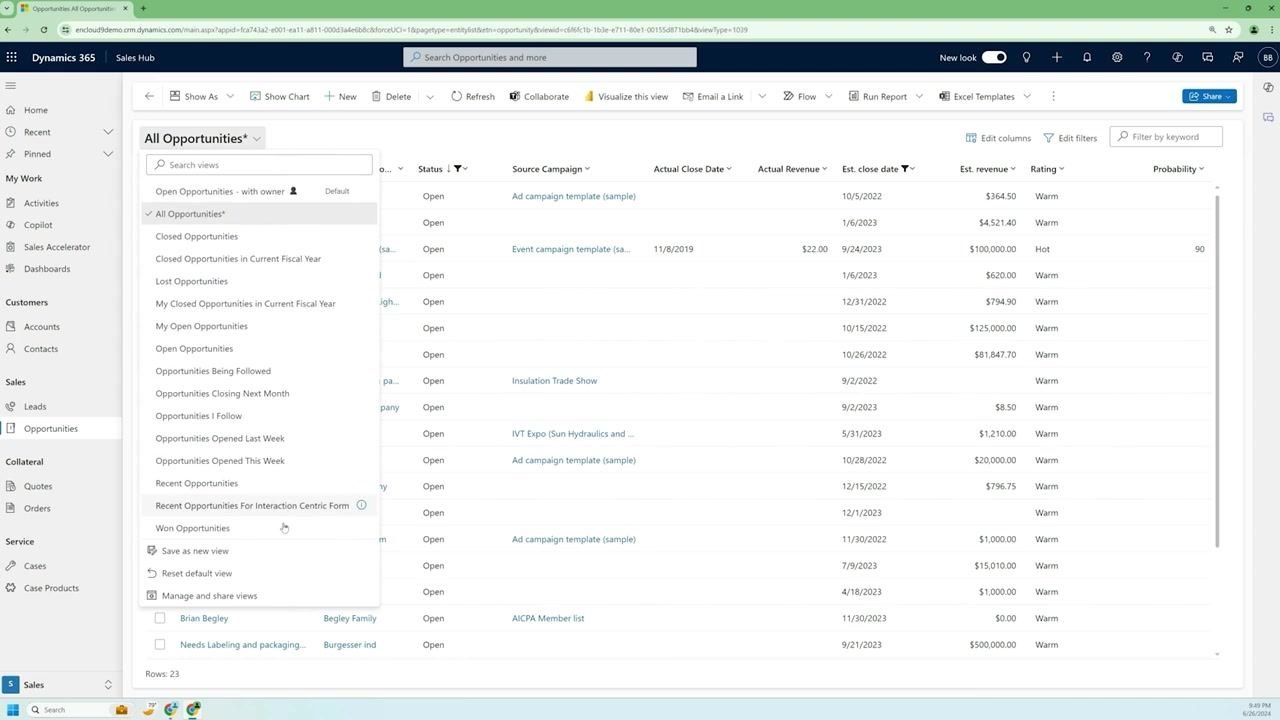
Step 14: Open the view selector
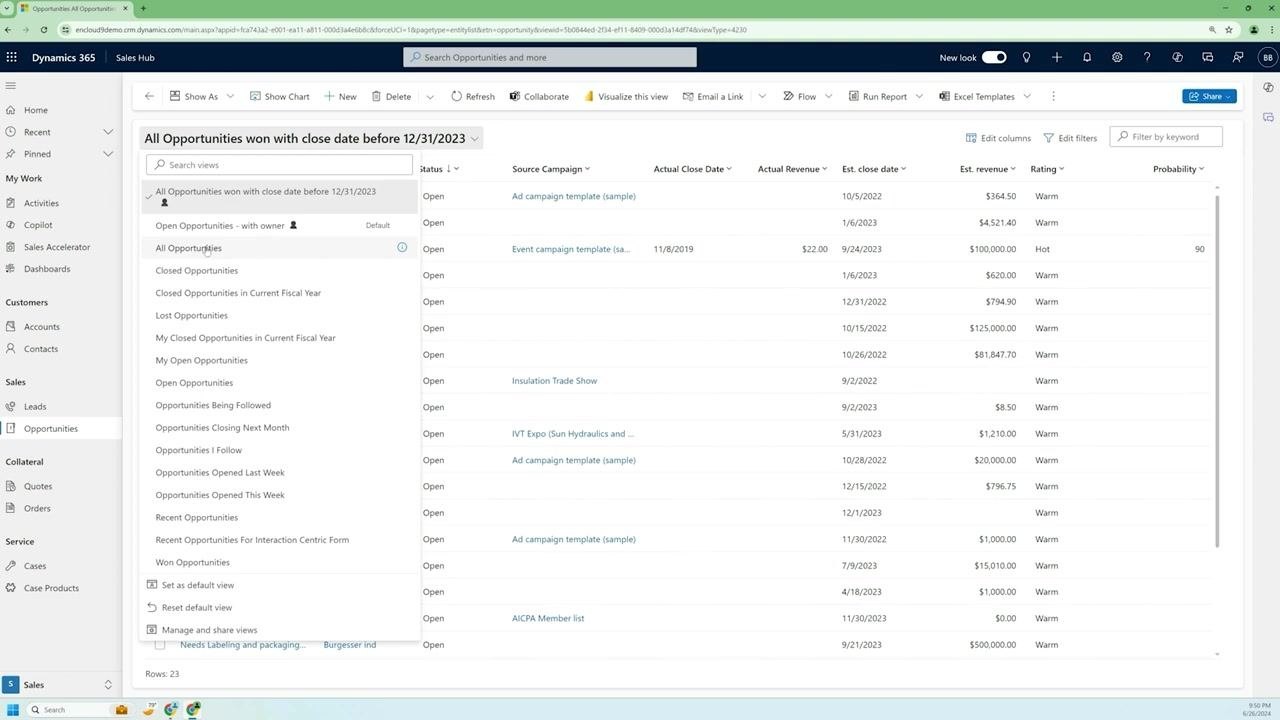
Click the current view name (All Opportunities*) at the top of the grid to open the list of available views.
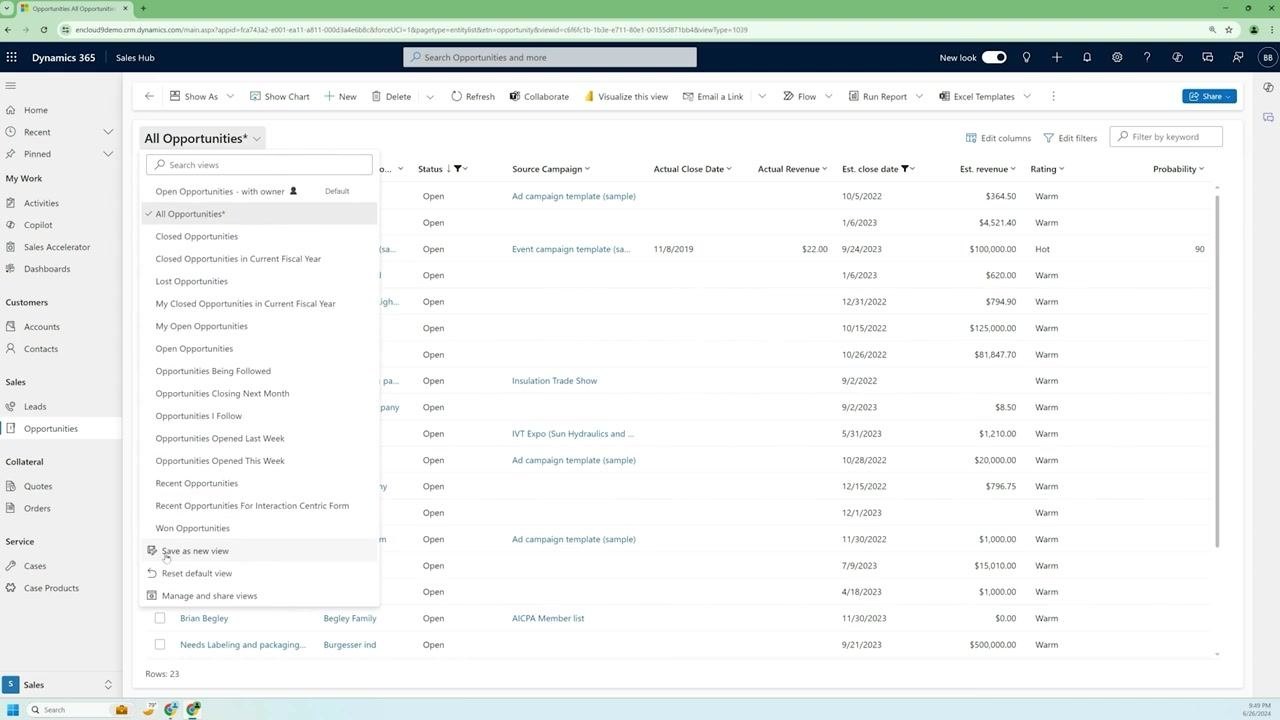
Step 15: Choose Save as new view
Scroll to the bottom of the view selector dropdown and click Save as new view.
Step 16: Enter a name for your view
In the Save as new view dialog, type a descriptive name into the Name field—for example, "All Opportunities won with close date before 12/31/2023."
Step 17: Complete the name and description
Finish entering the name, and optionally add a description to clarify the purpose of the view.
Step 18: Save the view
Click the blue Save button to store your new personal view.
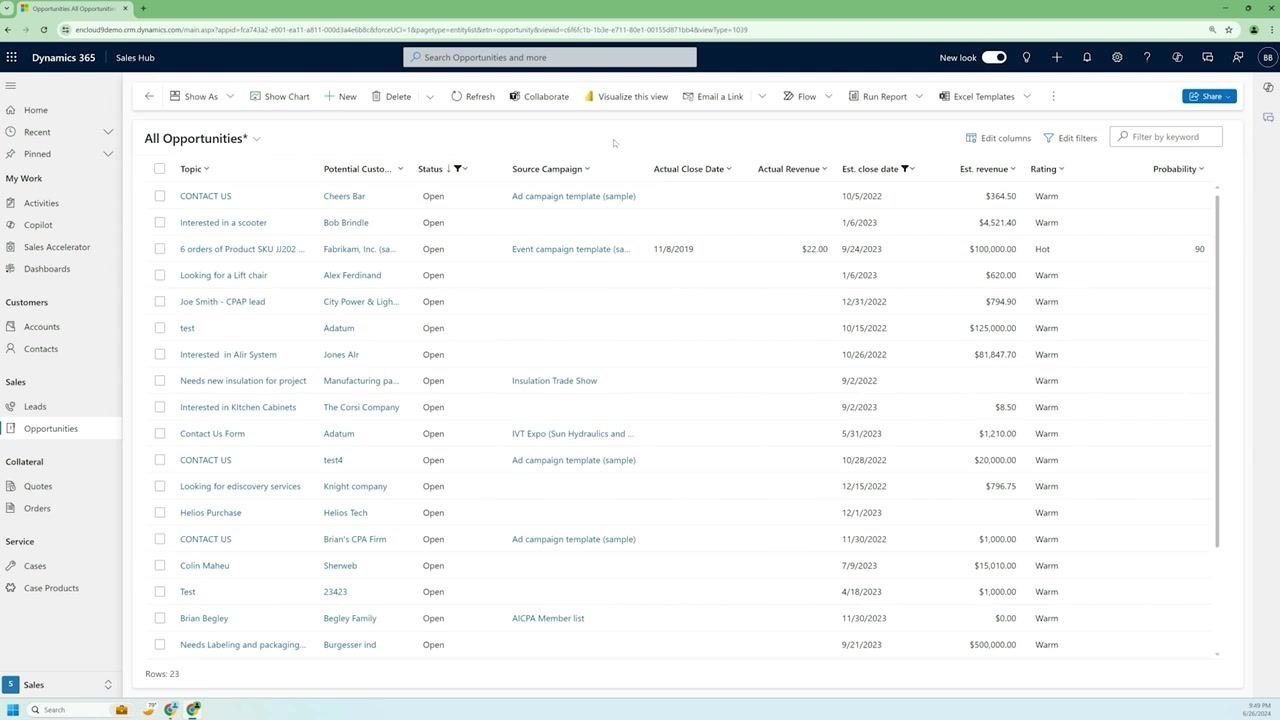
Step 19: Confirm the new view is active
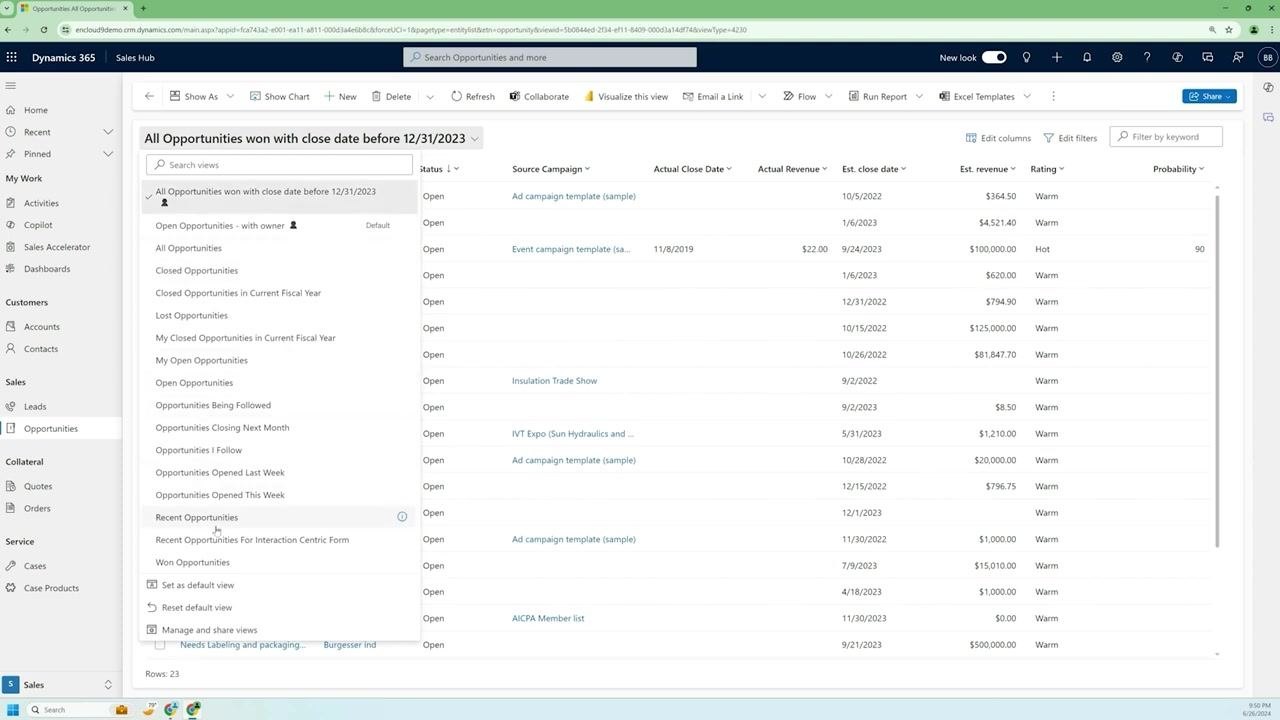
The grid updates to display your new view name at the top (for example, "All Opportunities won with close date before 12/31/2023"), with your filters and columns preserved.
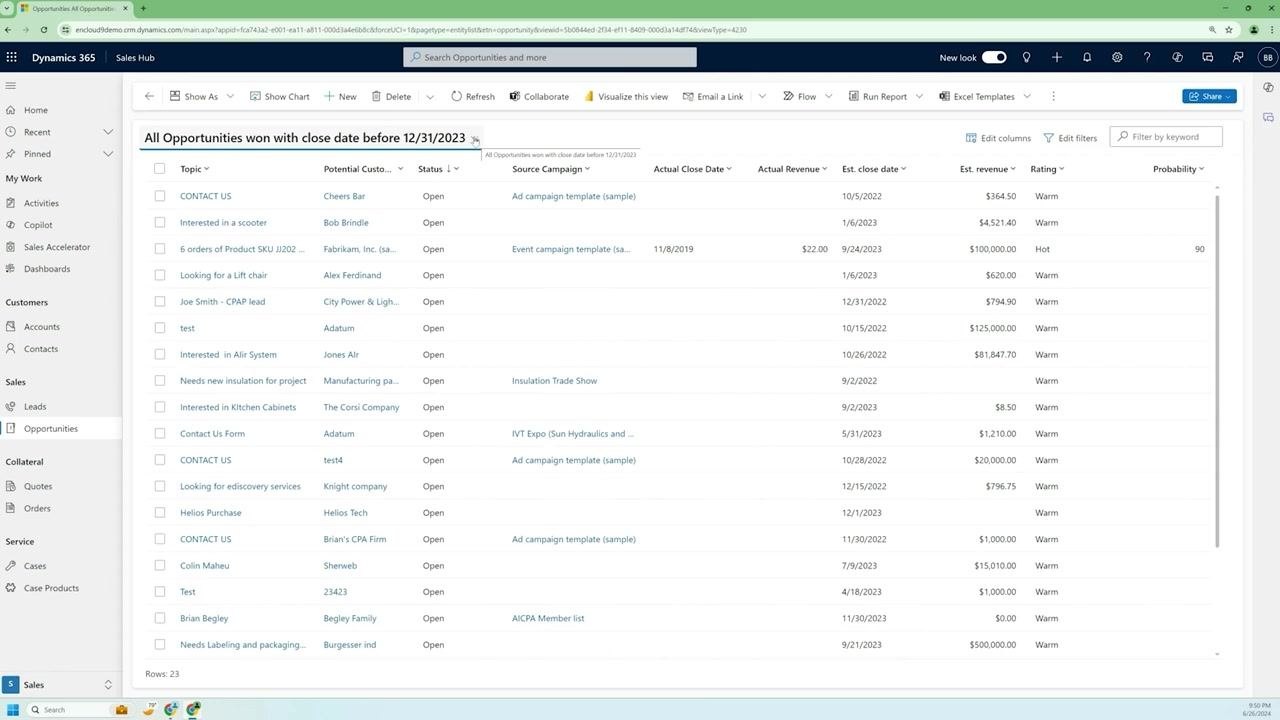
Step 20: Verify the view appears in your list
Open the view selector again to confirm your new view is listed among the available views.
Step 21: Distinguish personal views from system views
Personal views are marked with a "head and shoulders" icon, while system views do not display this icon.
Creating a custom dashboard in Dynamics 365 Sales Hub
Step 22: Navigate to Dashboards
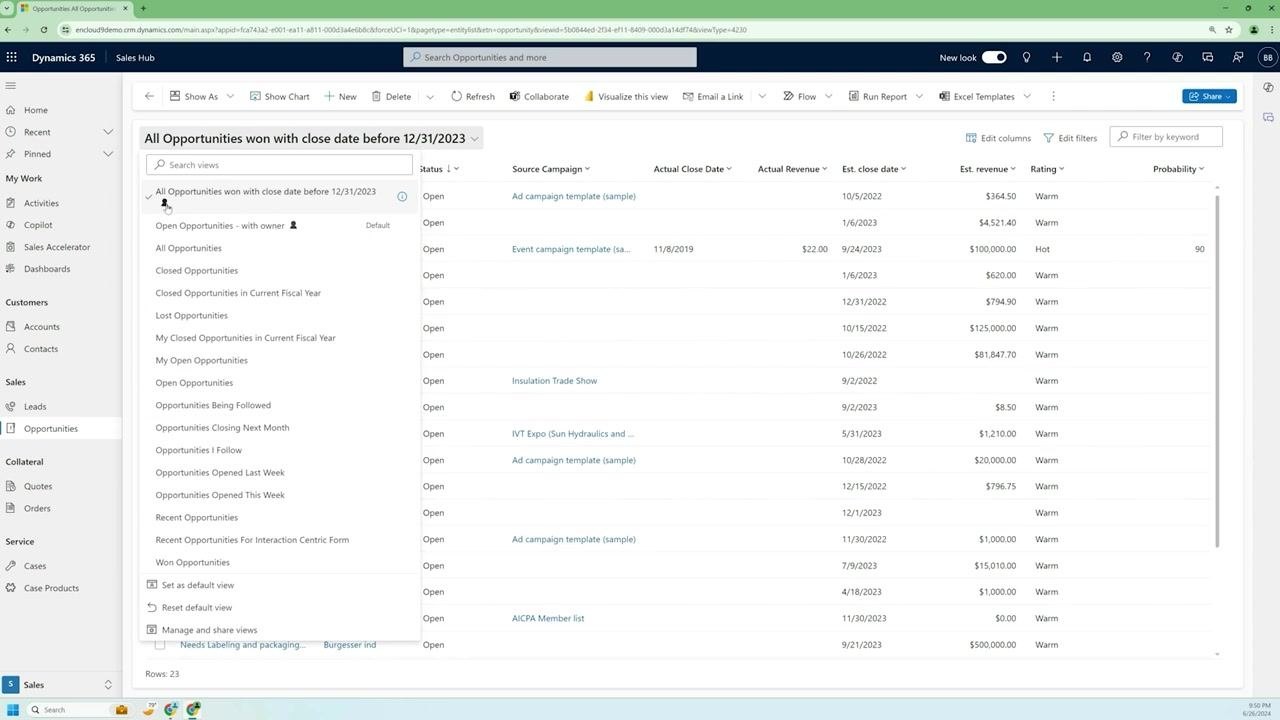
In the left navigation pane, under My Work, click Dashboards to open the dashboards area, where you can view and manage dashboards in Dynamics 365. Dynamics 365 includes a set of pre-built dashboards that you can use as-is or customize to fit your workflow.
Step 23: Open the Sales Dashboard
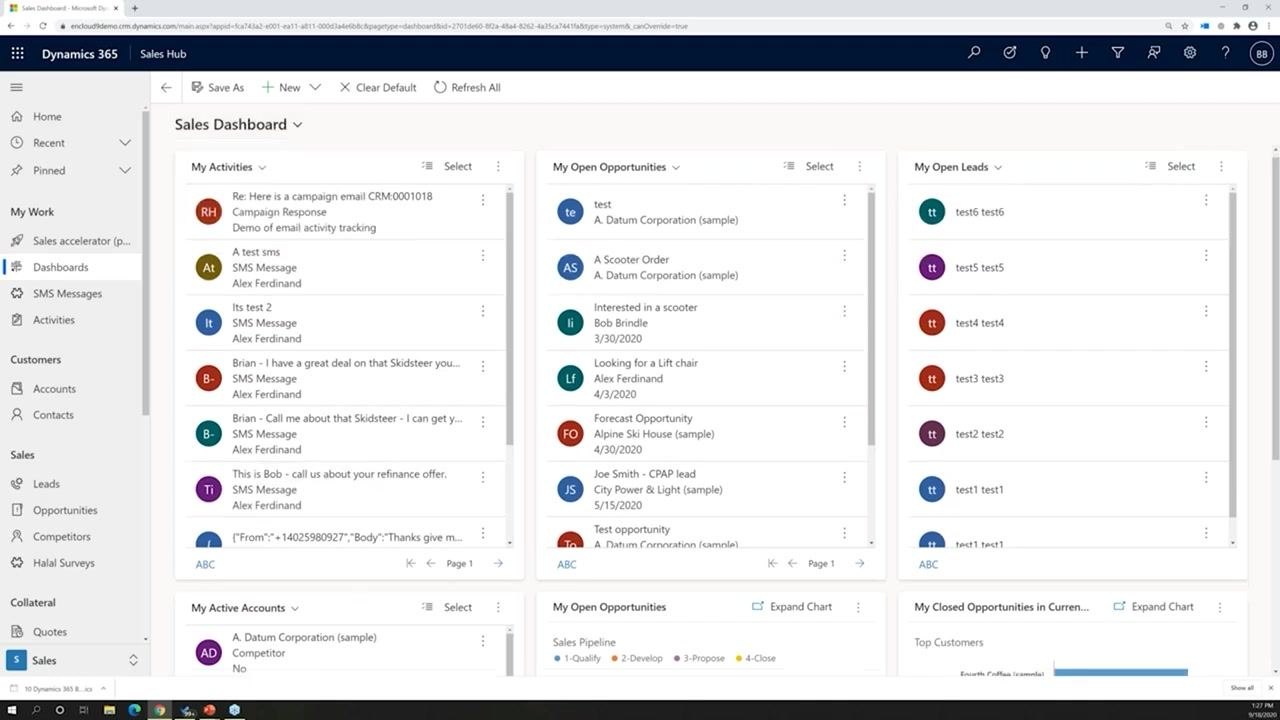
The main screen shows the Sales Dashboard with panels for My Activities, My Open Opportunities, and My Open Leads. The left navigation menu includes options such as Home, Recent, Pinned, Sales accelerator, Dashboards, SMS Messages, Activities, Accounts, Contacts, Leads, Opportunities, Competitors, and Quotes.
Step 24: Start a new dashboard
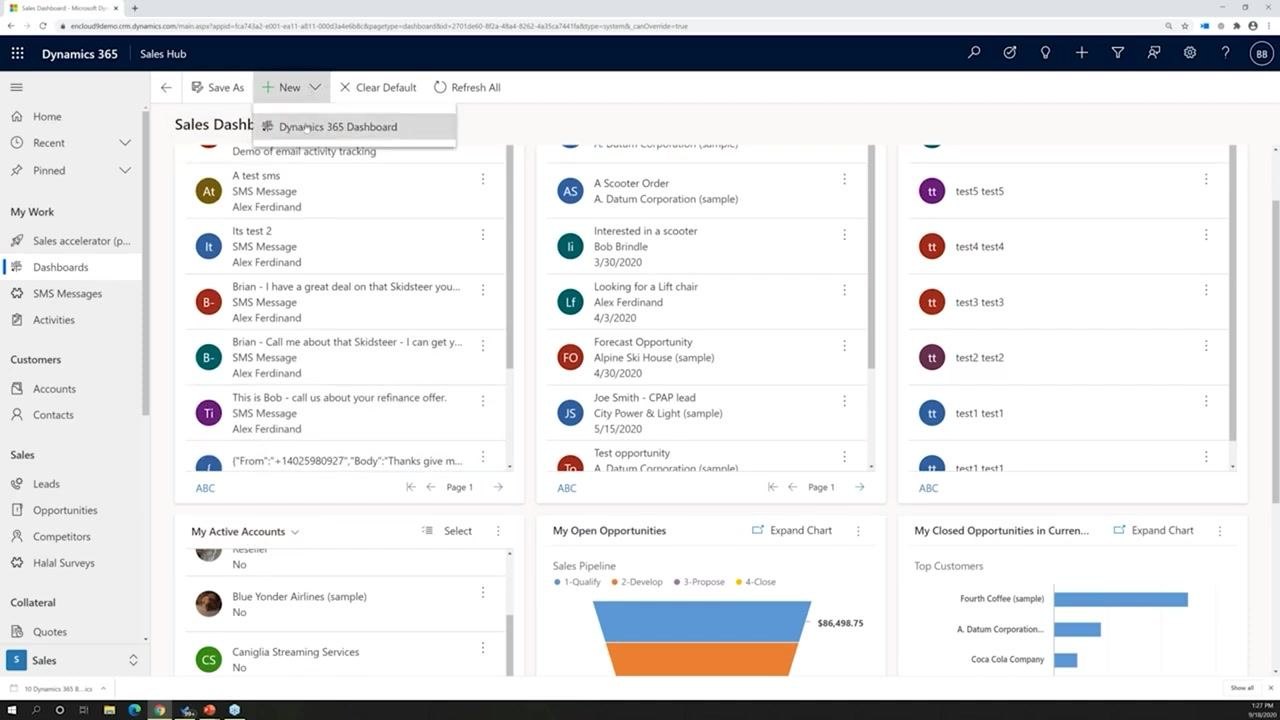
Click New at the top of the dashboard and select Dynamics 365 Dashboard from the dropdown to begin creating a new dashboard.
Step 25: Choose a layout
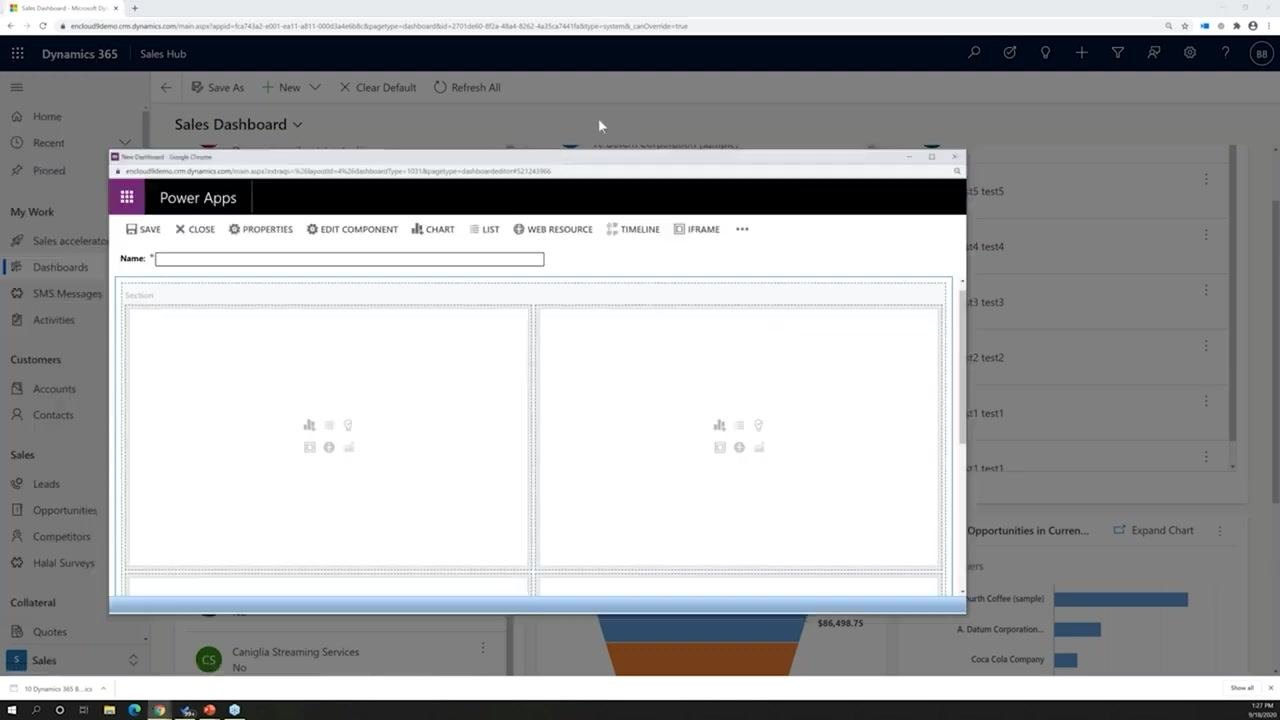
In the dashboard creation dialog, select a two-column layout with four items, then click Create. The dashboard editor opens in a new window or tab.
Step 26: Review the blank dashboard layout
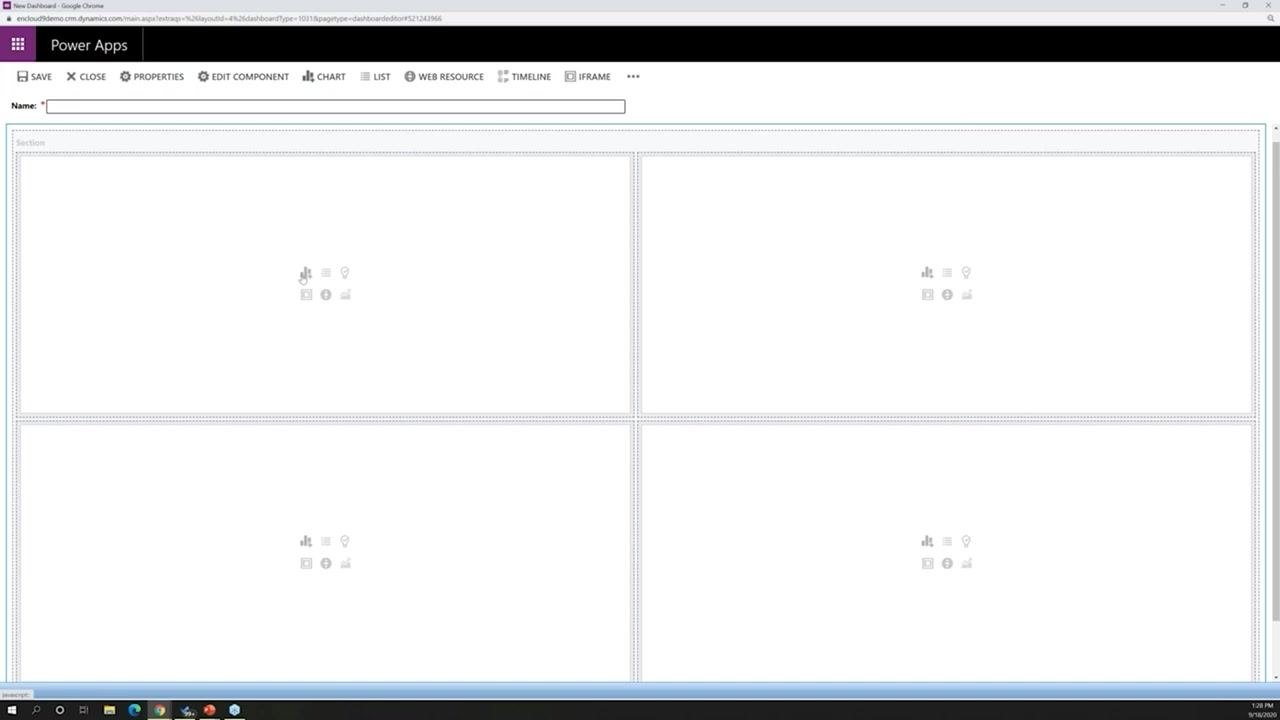
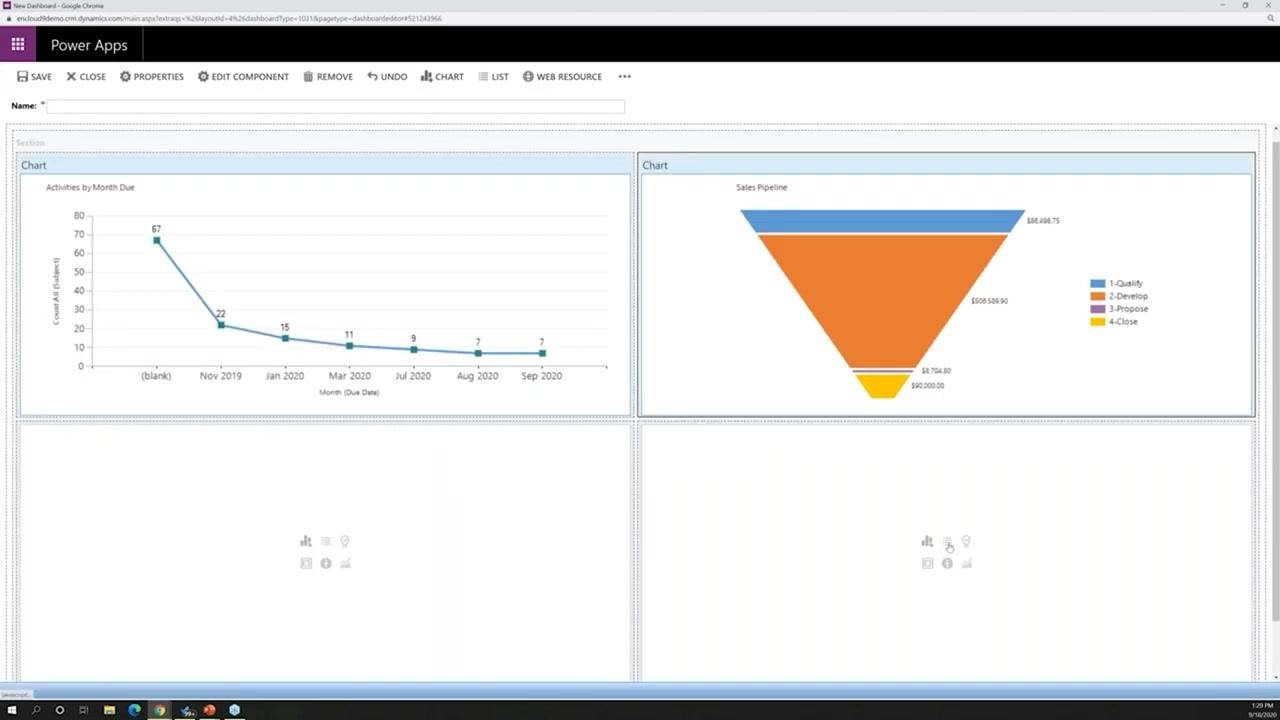
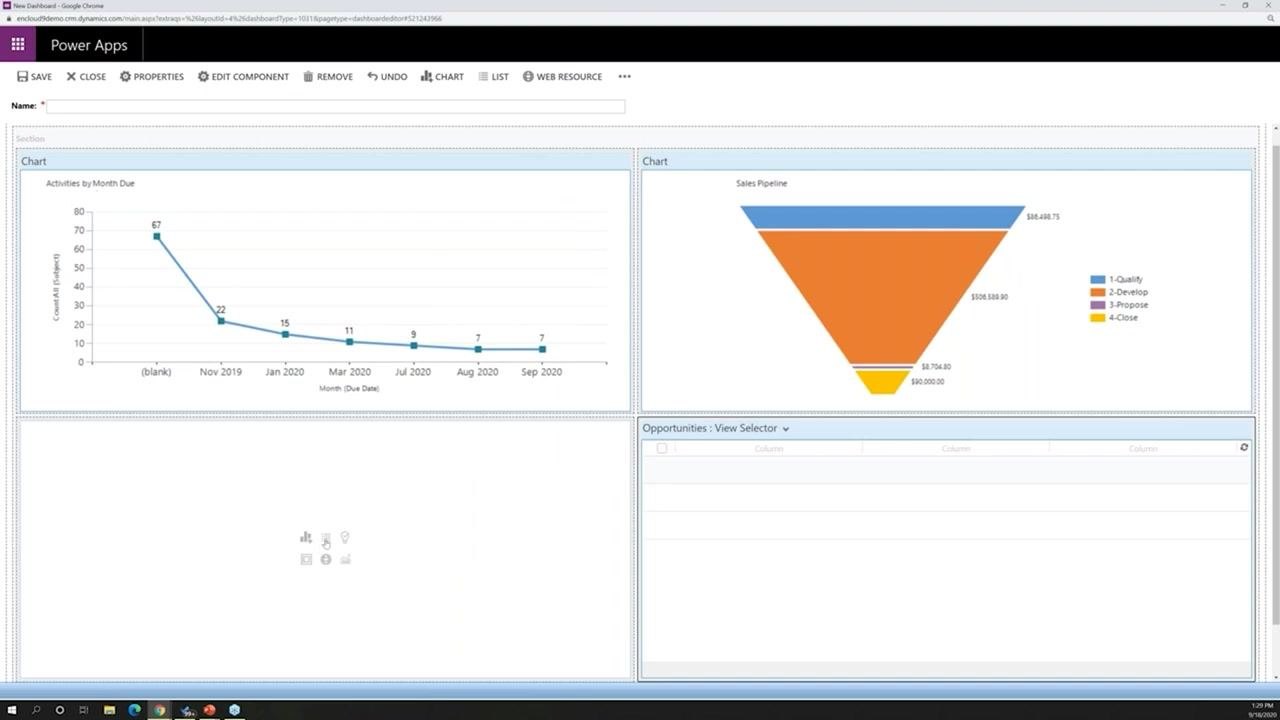
The Power Apps dashboard editor appears with a blank two-column, four-section layout. The toolbar includes options such as SAVE, CLOSE, PROPERTIES, EDIT COMPONENT, CHART, LIST, WEB RESOURCE, and IFRAME, along with a field for the dashboard Name.
Step 27: Add a chart for activities
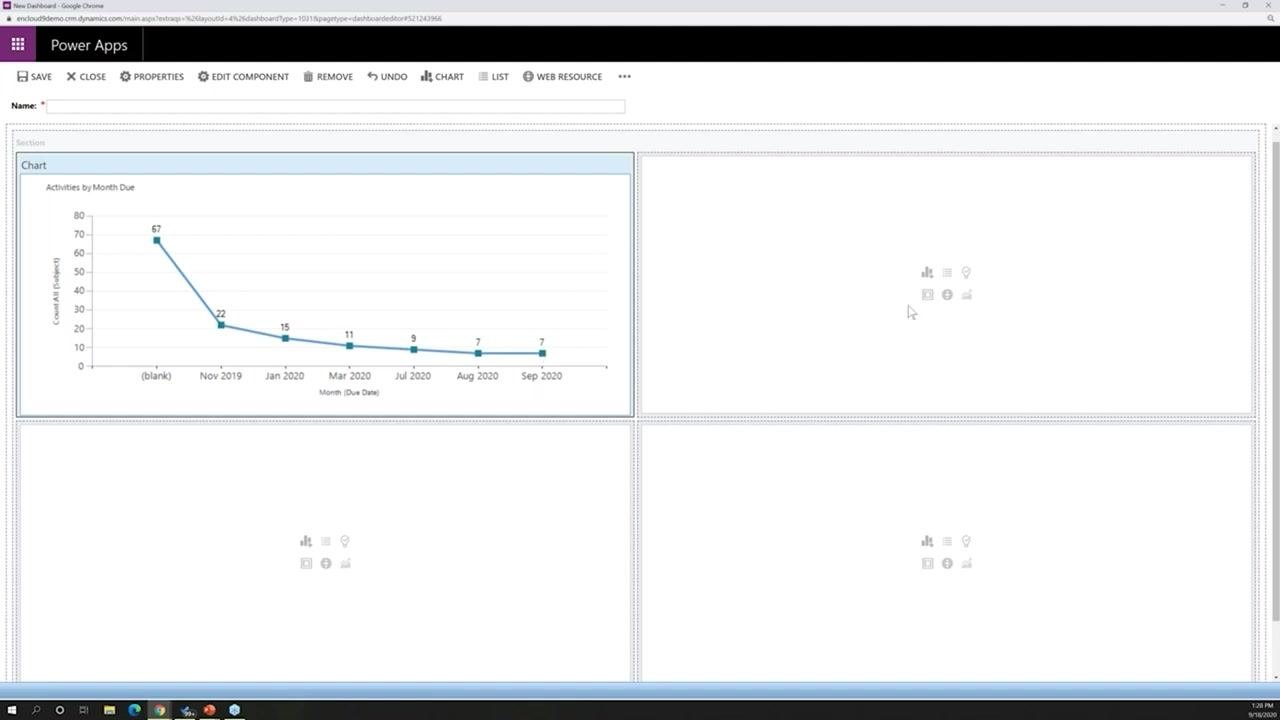
In the first section, click the chart icon. In the Add Component dialog, select Activities as the Record Type, choose the Activities by Month Due chart, and click Add.
Step 28: Review the activities chart
The Activities by Month Due chart appears in the first section, showing activity counts per month—for example, 67 (blank), 22 (Nov 2019), 15 (Jan 2020), 11 (Mar 2020), 9 (Jul 2020), 7 (Aug 2020), and 7 (Sep 2020). You can click a specific month to view and start working on those activities.
Step 29: Add a chart for open opportunities
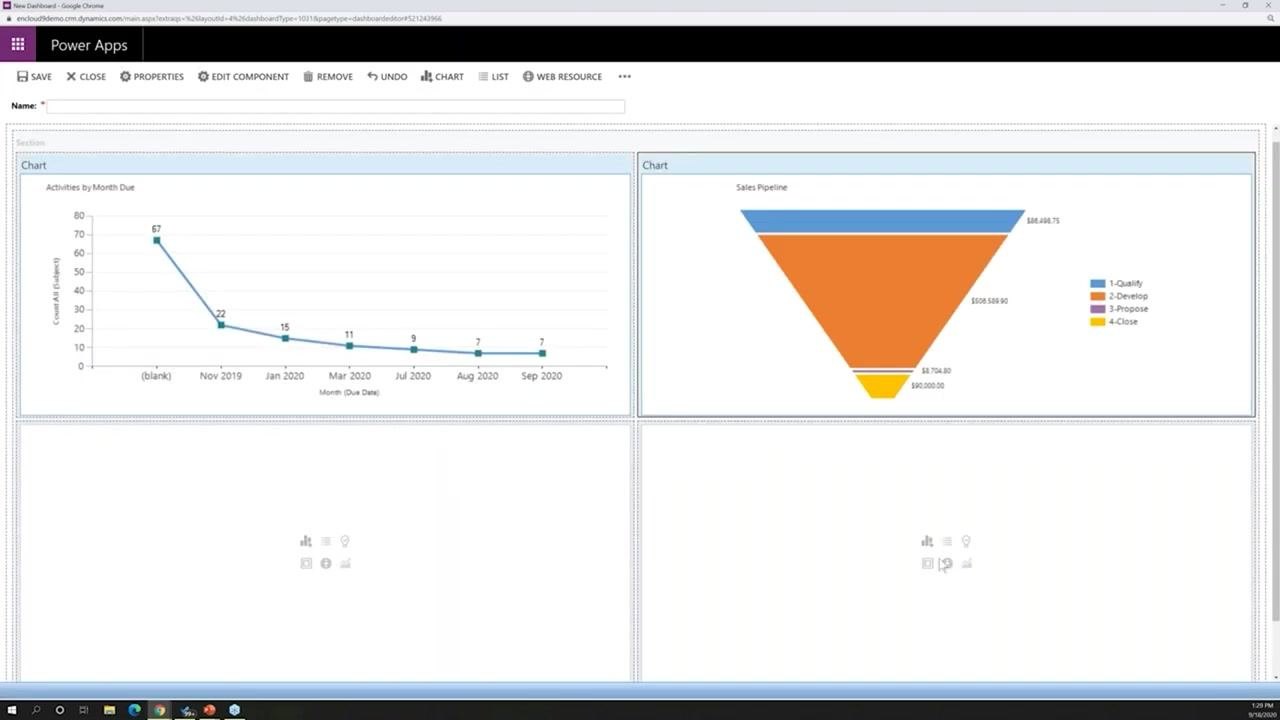
In the second section, click the chart icon. In the Add Component dialog, select Opportunity Sales Process as the Record Type, choose the appropriate chart (such as Sales Pipeline), and click Add.
Step 30: Review the sales pipeline chart
The Sales Pipeline funnel chart appears in the second section, displaying opportunity stages—1-Qualify, 2-Develop, 3-Propose, 4-Close—with corresponding values.
Step 31: Prepare to add a list
With charts in the top two sections, move to one of the remaining blank sections to insert a tabular list of records, such as your opportunities, for quick access.
Step 32: Insert a list component
In the lower left section of the layout, click the Insert List icon (shown as a table/grid symbol) to prepare the section to display a list of records.
Step 33: Configure the list for activities
In the dialog that appears, select Activities as the record type and choose the view you want (for example, My Activities) to display your personal activity records, then confirm your selection.
Step 34: Name your dashboard
In the Name field at the top of the editor, enter a descriptive name, such as "Brian's personal Dashboard." This name appears in your list of dashboards for future access.
Step 35: Save and close the editor
Click SAVE to store your changes, then click CLOSE to exit the dashboard editor and return to the main Sales Hub interface.
Finalizing and using your dashboard
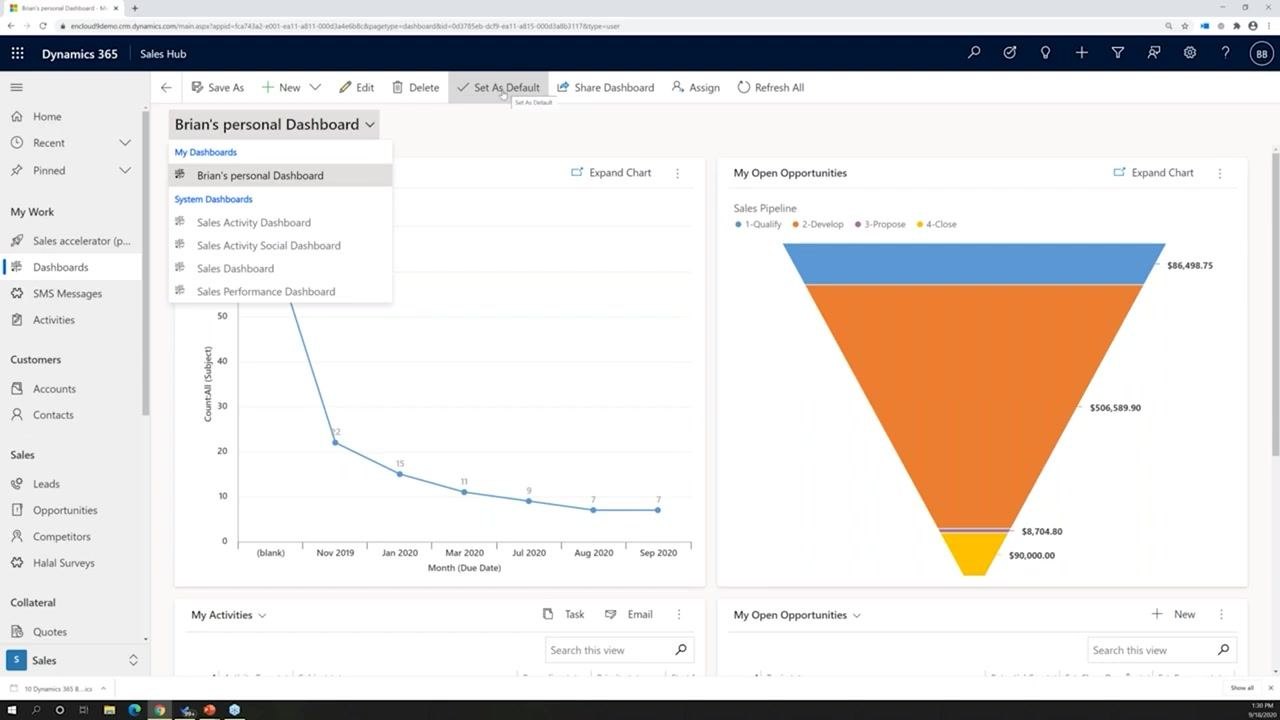
Step 36: Set your dashboard as the default view
In the Sales Hub, locate your new dashboard in the dashboard dropdown menu, click Set As Default, and select your dashboard (for example, "Brian's personal Dashboard") to make it your default landing page when opening CRM.
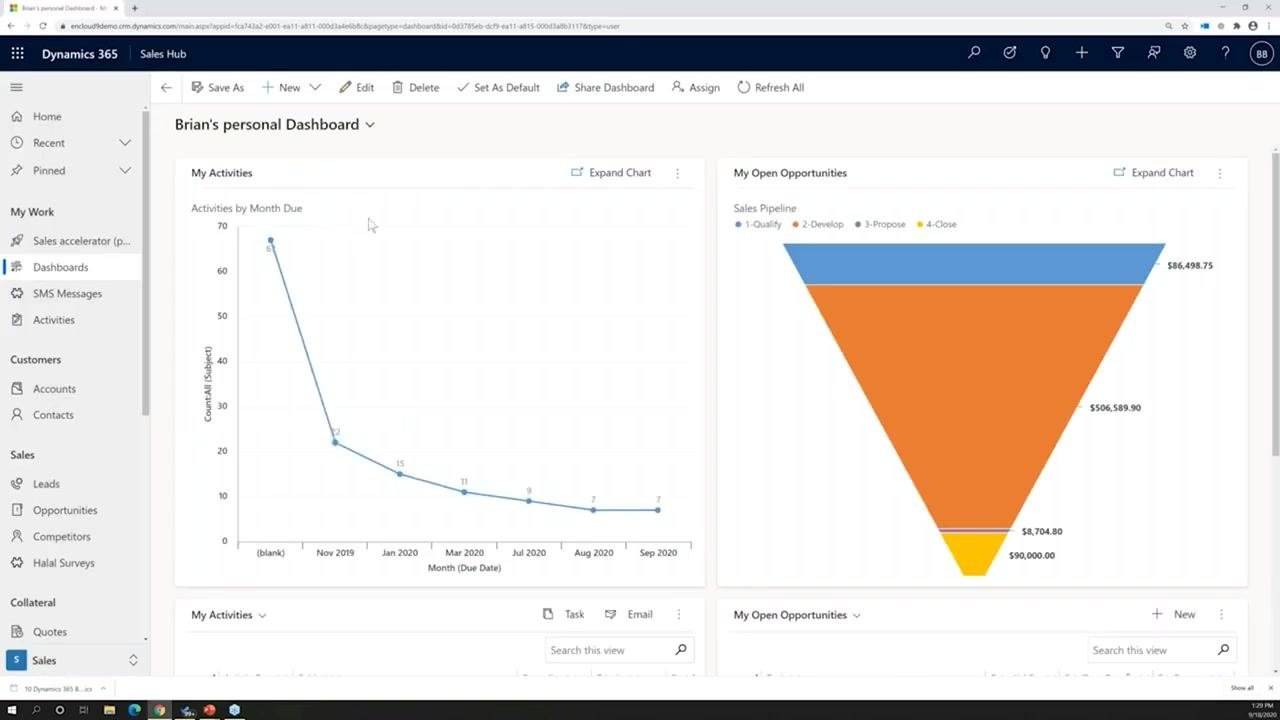
Step 37: Review your completed dashboard
Your dashboard now displays My Activities (a list of recent activities, including emails, SMS messages, and campaign emails, with columns for subject, regarding, priority, and start date), My Open Opportunities (a list of open sales opportunities with columns for topic, potential customer, estimated close date, estimated revenue, and more), and the Activities by Month Due and Sales Pipeline charts for quick insights. Use the search and filter options to find specific records within each list.
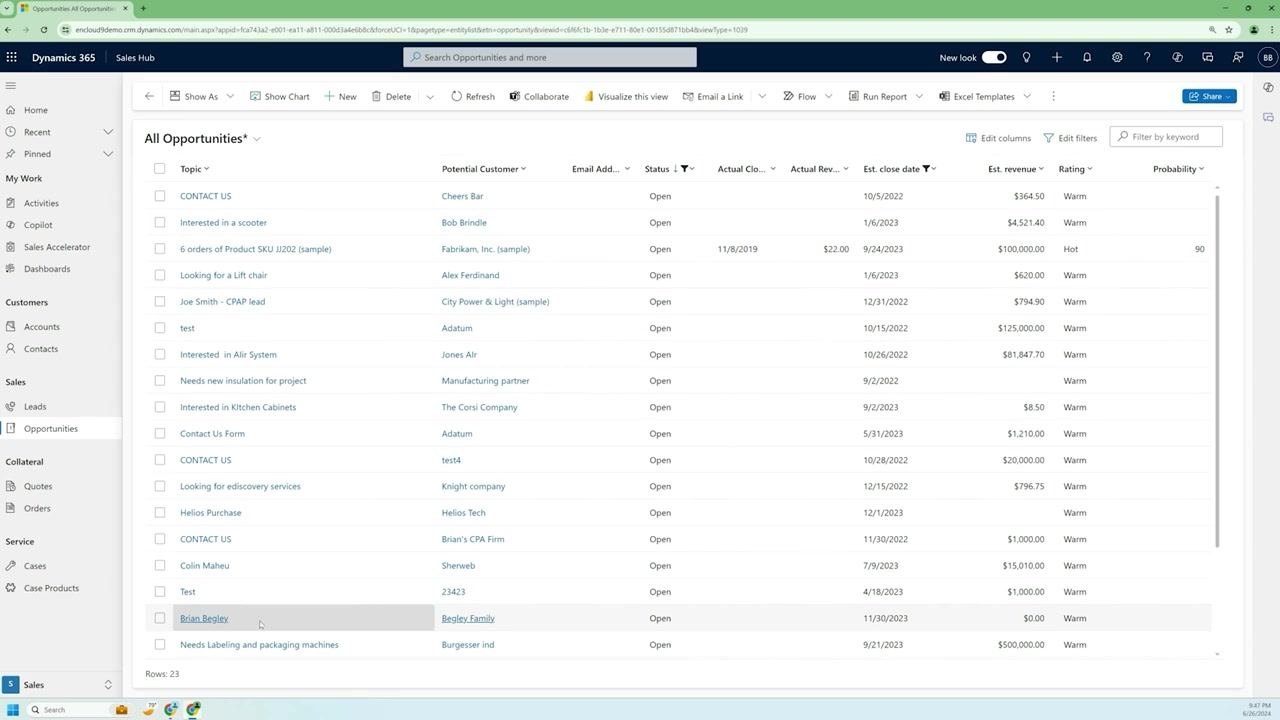
Step 38: Access and manage your opportunities
Navigate to the Opportunities section from the left menu to view all opportunities. Use the view selector to apply filtered views, such as "All Opportunities won with close date before 12/31/2023," and review columns including status, source campaign, actual close date, actual revenue, estimated close date, estimated revenue, rating, and probability.
What's next
With your custom view and dashboard in place, you have a faster way to track open opportunities and monitor your pipeline at a glance. You can repeat these steps to create additional filtered views for other entities, or build further dashboard components—such as additional charts or lists—to tailor your Sales Hub workspace to your workflow.
Generation details: cost, quality tiers
Docsie billed 4,500 credits ($3.15) to analyze this 9-minute video at standard quality. The rewrite, template fill and Word/PDF exports were included. The same video at each quality tier:
| Quality | Frames sampled | Credits | Approx. cost |
|---|---|---|---|
| Draft | every 16-30 s | 2,250 | $1.57 |
| Standard (this guide) | every 8-15 s | 4,500 | $3.15 |
| Detailed | every 4-7 s | 9,000 | $6.30 |
| Ultra | every 1-3 s | 18,000 | $12.60 |
Credits priced at $0.70 per 1,000; plans include a monthly allowance. Enterprise customers on on-premise or bring-your-own-model deployments run this on their own inference and pay no per-video credits.
Generated by Docsie Video-to-Docs on 2026-10-01 from a 8-minute video. Screenshots are frames from the source video and belong to their creator, enCloud9 | Dynamics 365 & Copilot AI, whose original is embedded above. If you own this video and want the guide removed or credited differently, contact us and we will act within one business day.