4.8
on G2
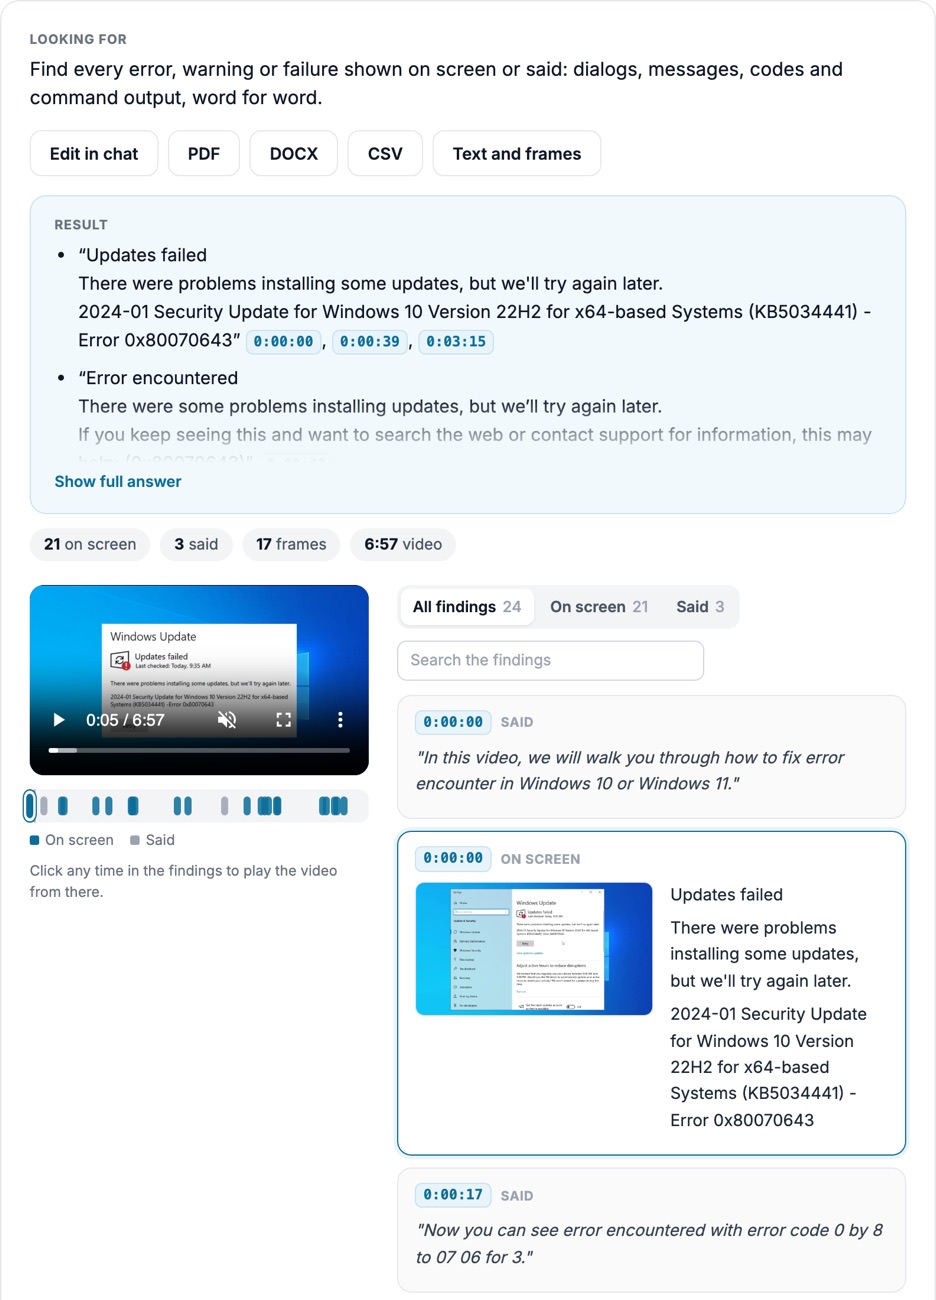
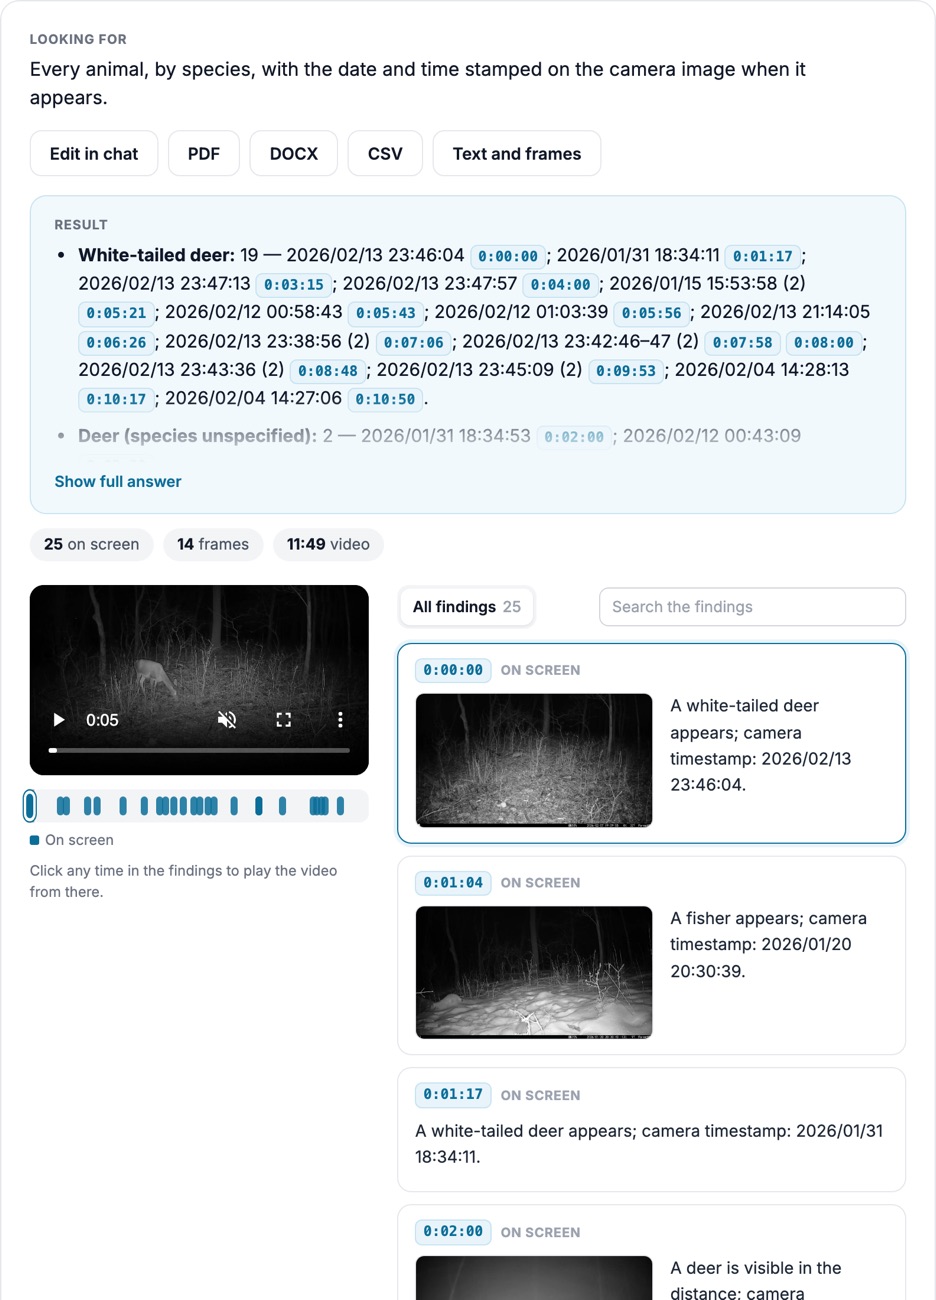
Track an object through a video, read the timers and labels in frame, and estimate speed, height or time. Every number comes with how it was measured and what was missing.
Measurements come with frames, method and limits, so students and engineers can check the reasoning.
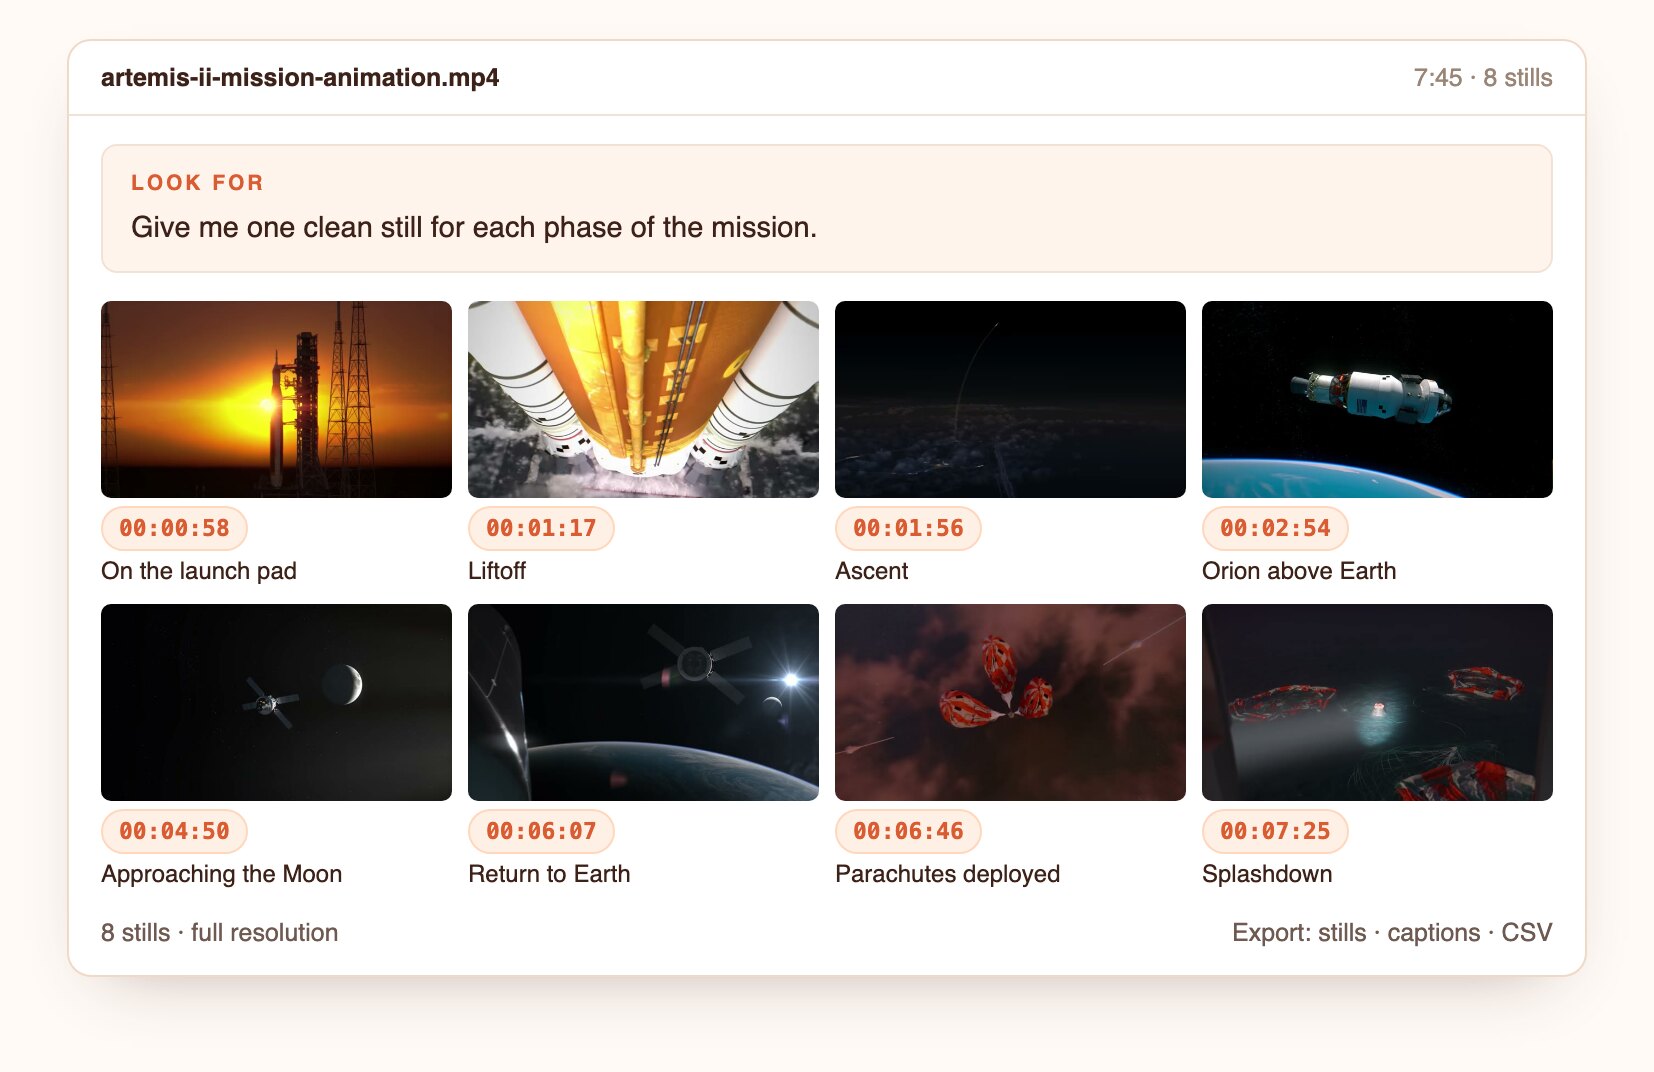
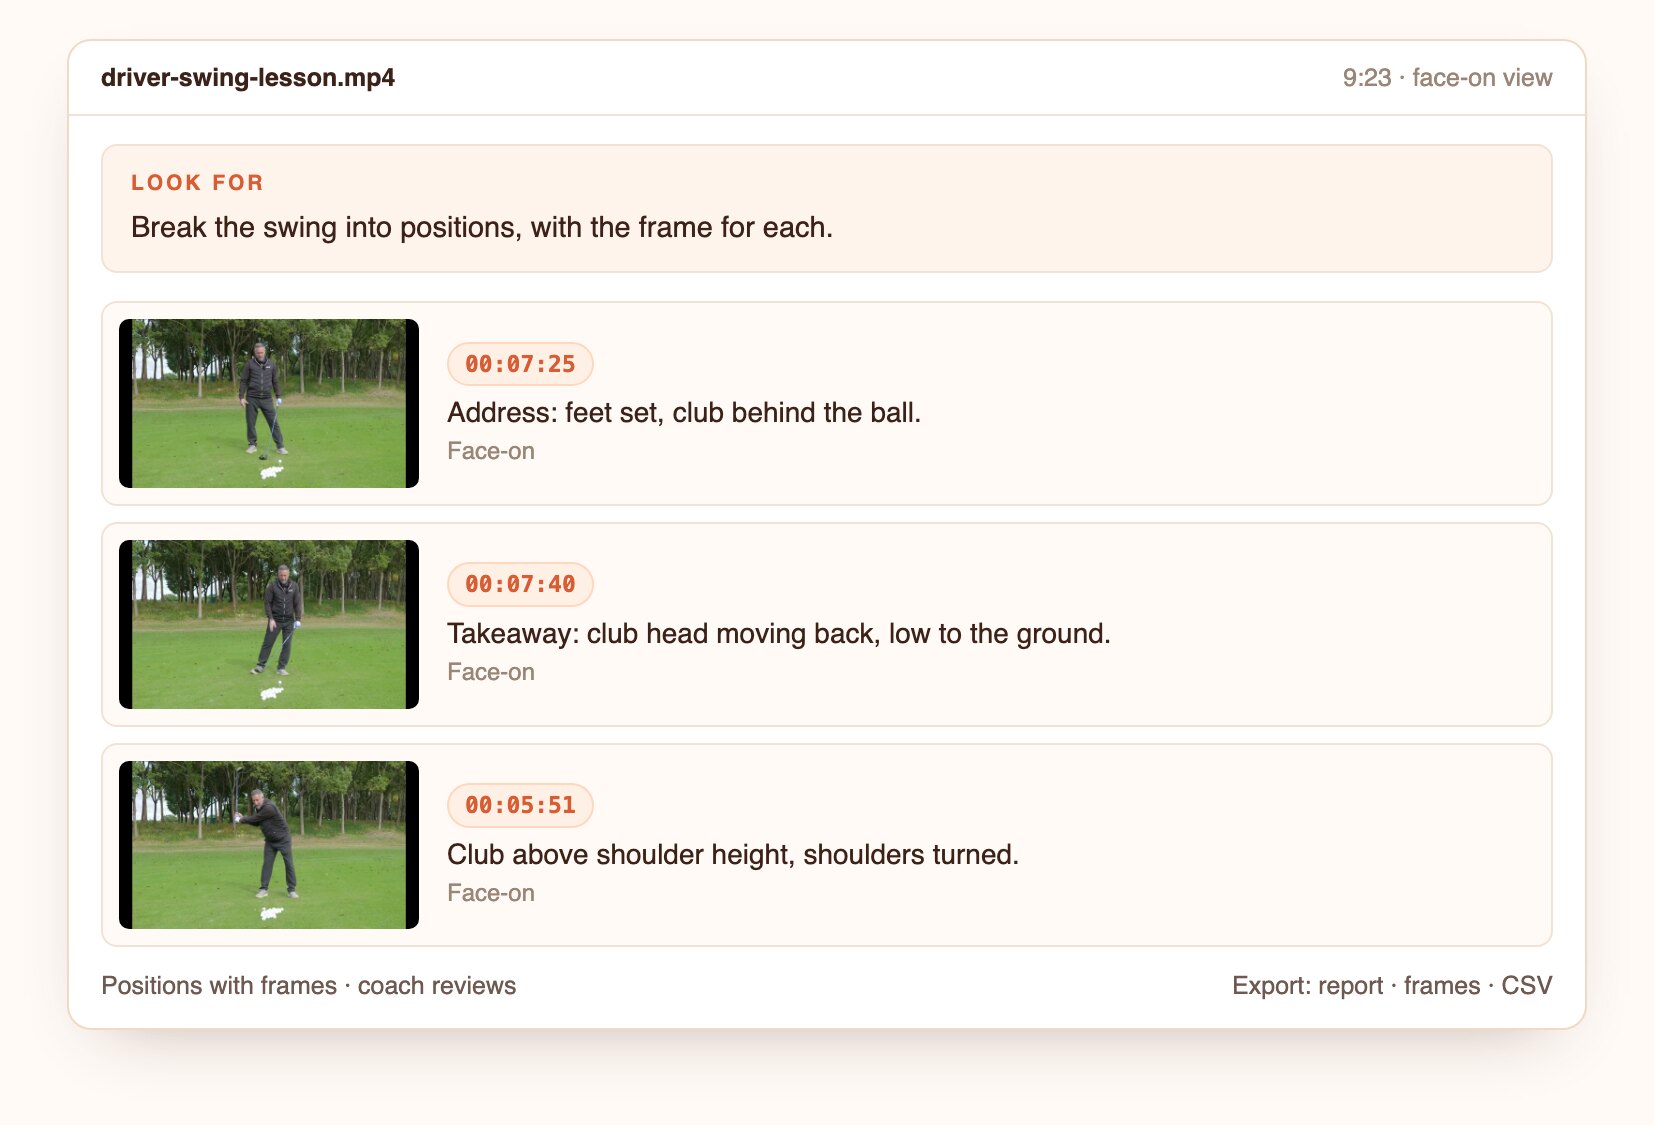
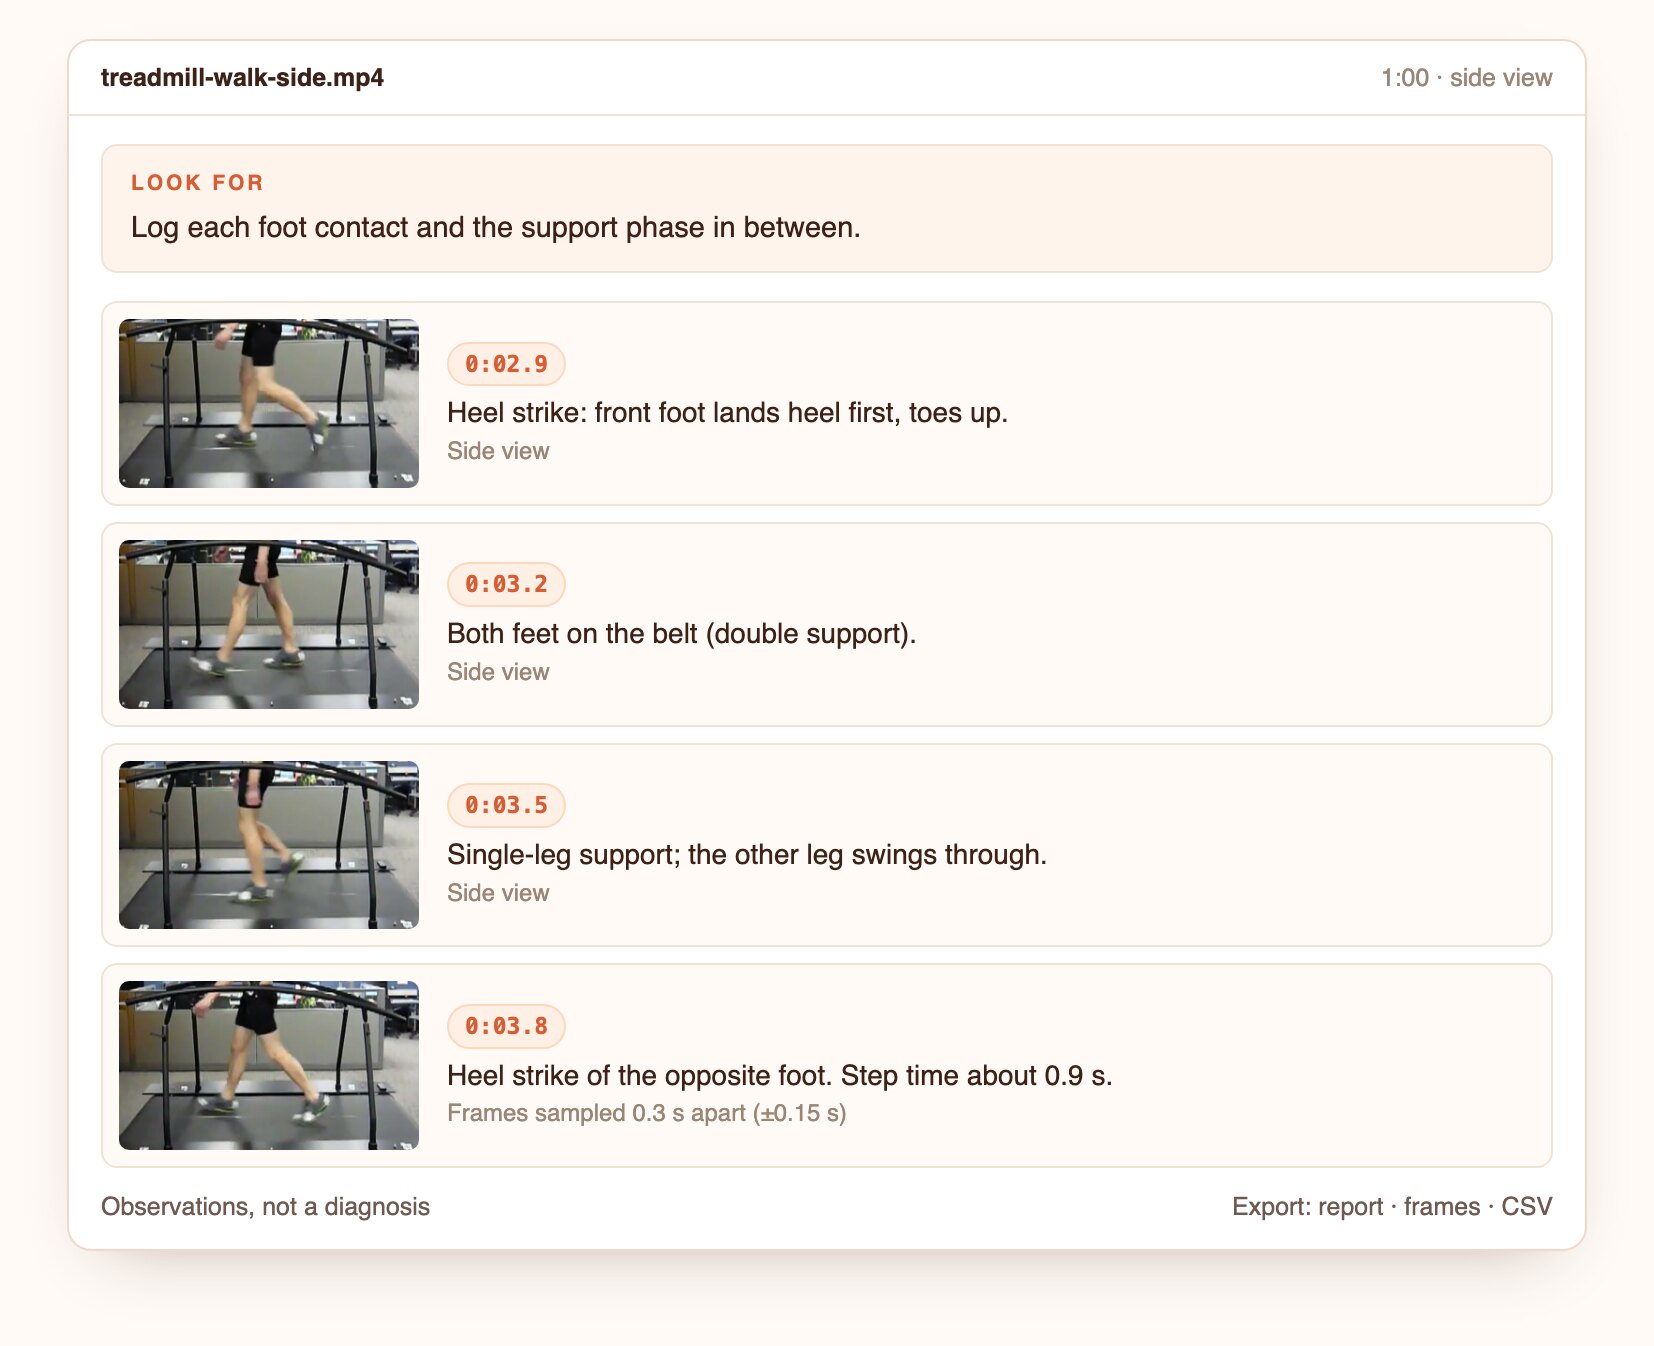
Find when an object starts, collides, peaks or stops, with the frame for each event.
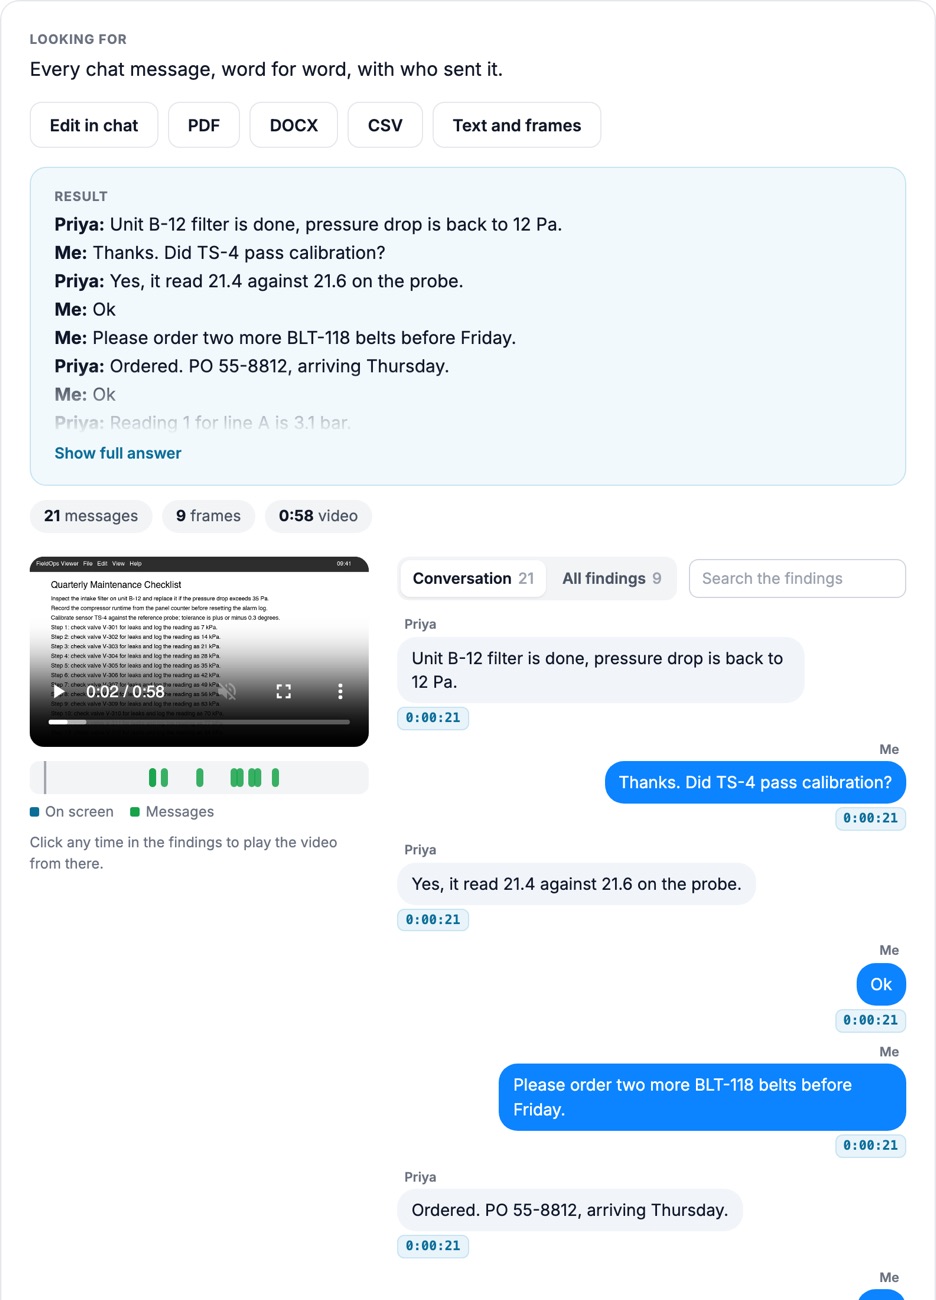
Masses, labels, rulers and stopwatches in the shot are read and used in the analysis.
If there is no scale reference or frame rate, the result says so instead of inventing a number.
How it looks
Illustrative findings built from frames of public CC BY and US federal videos. Product captures from the first live runs replace these.
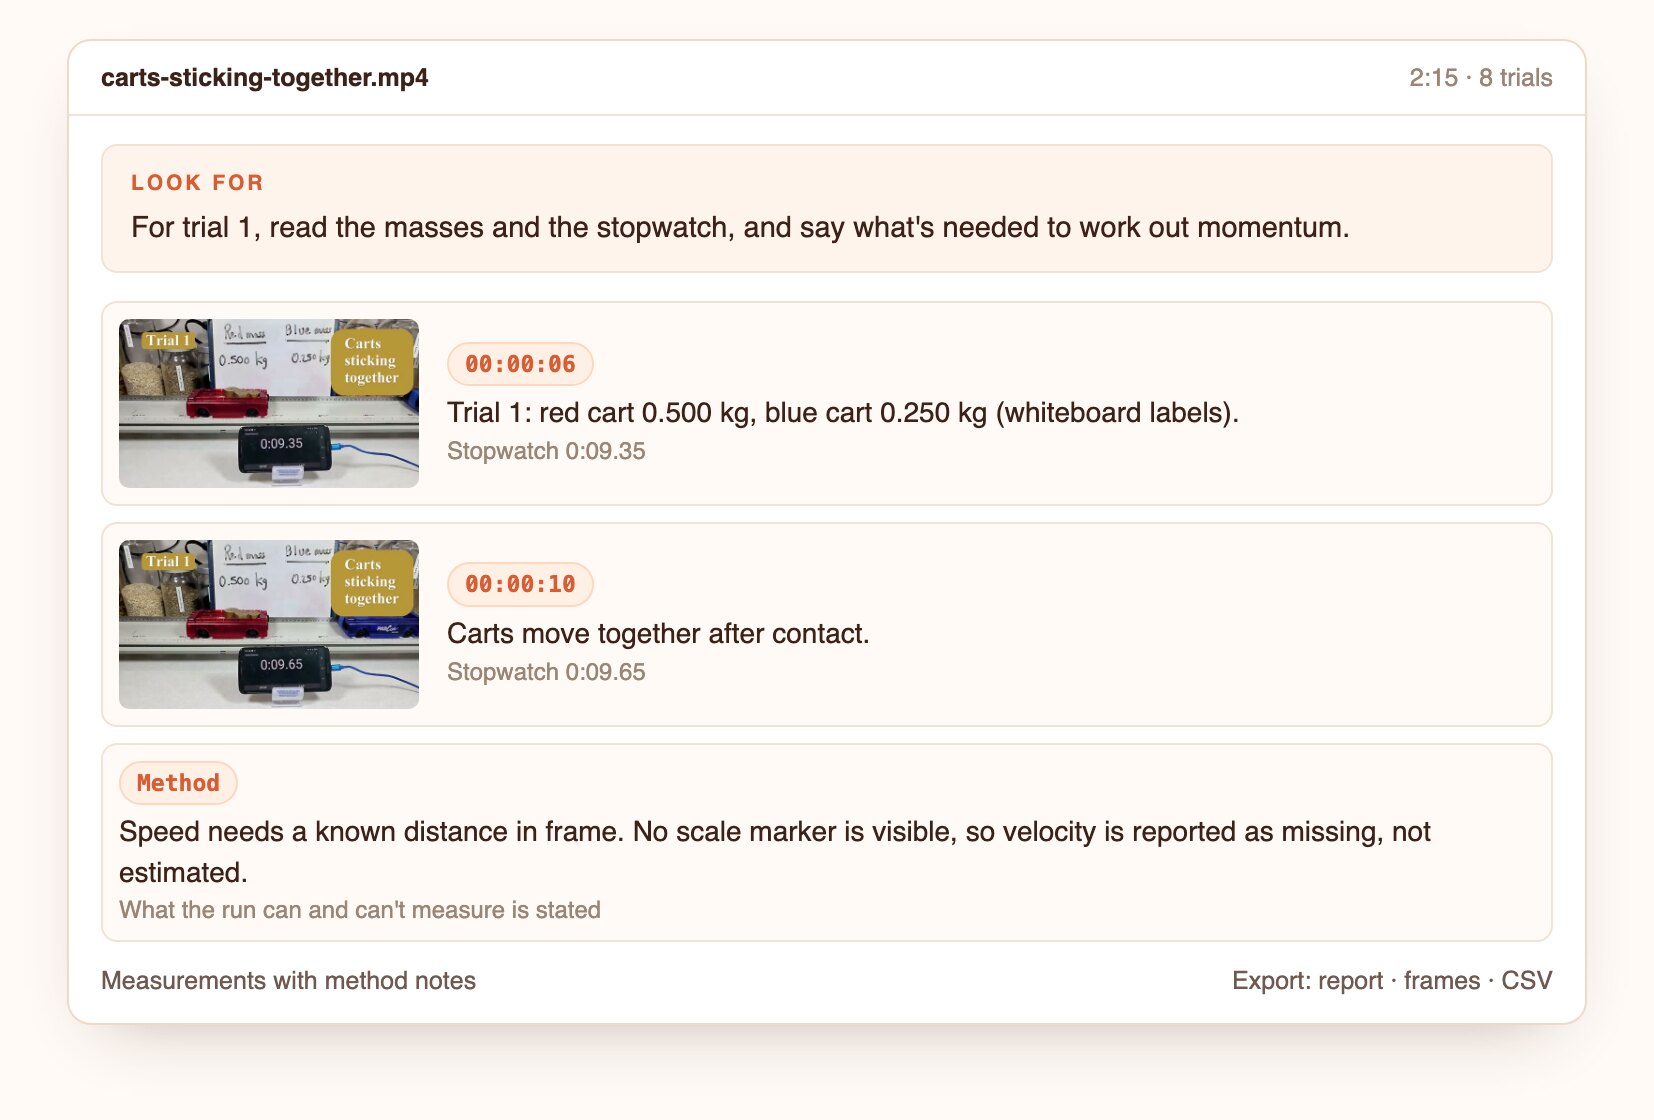
Masses and stopwatch values read from the video, and what's still needed to work out momentum.
Open the screenshot to inspect the full detail.
Labels and stopwatch readings copied exactly.
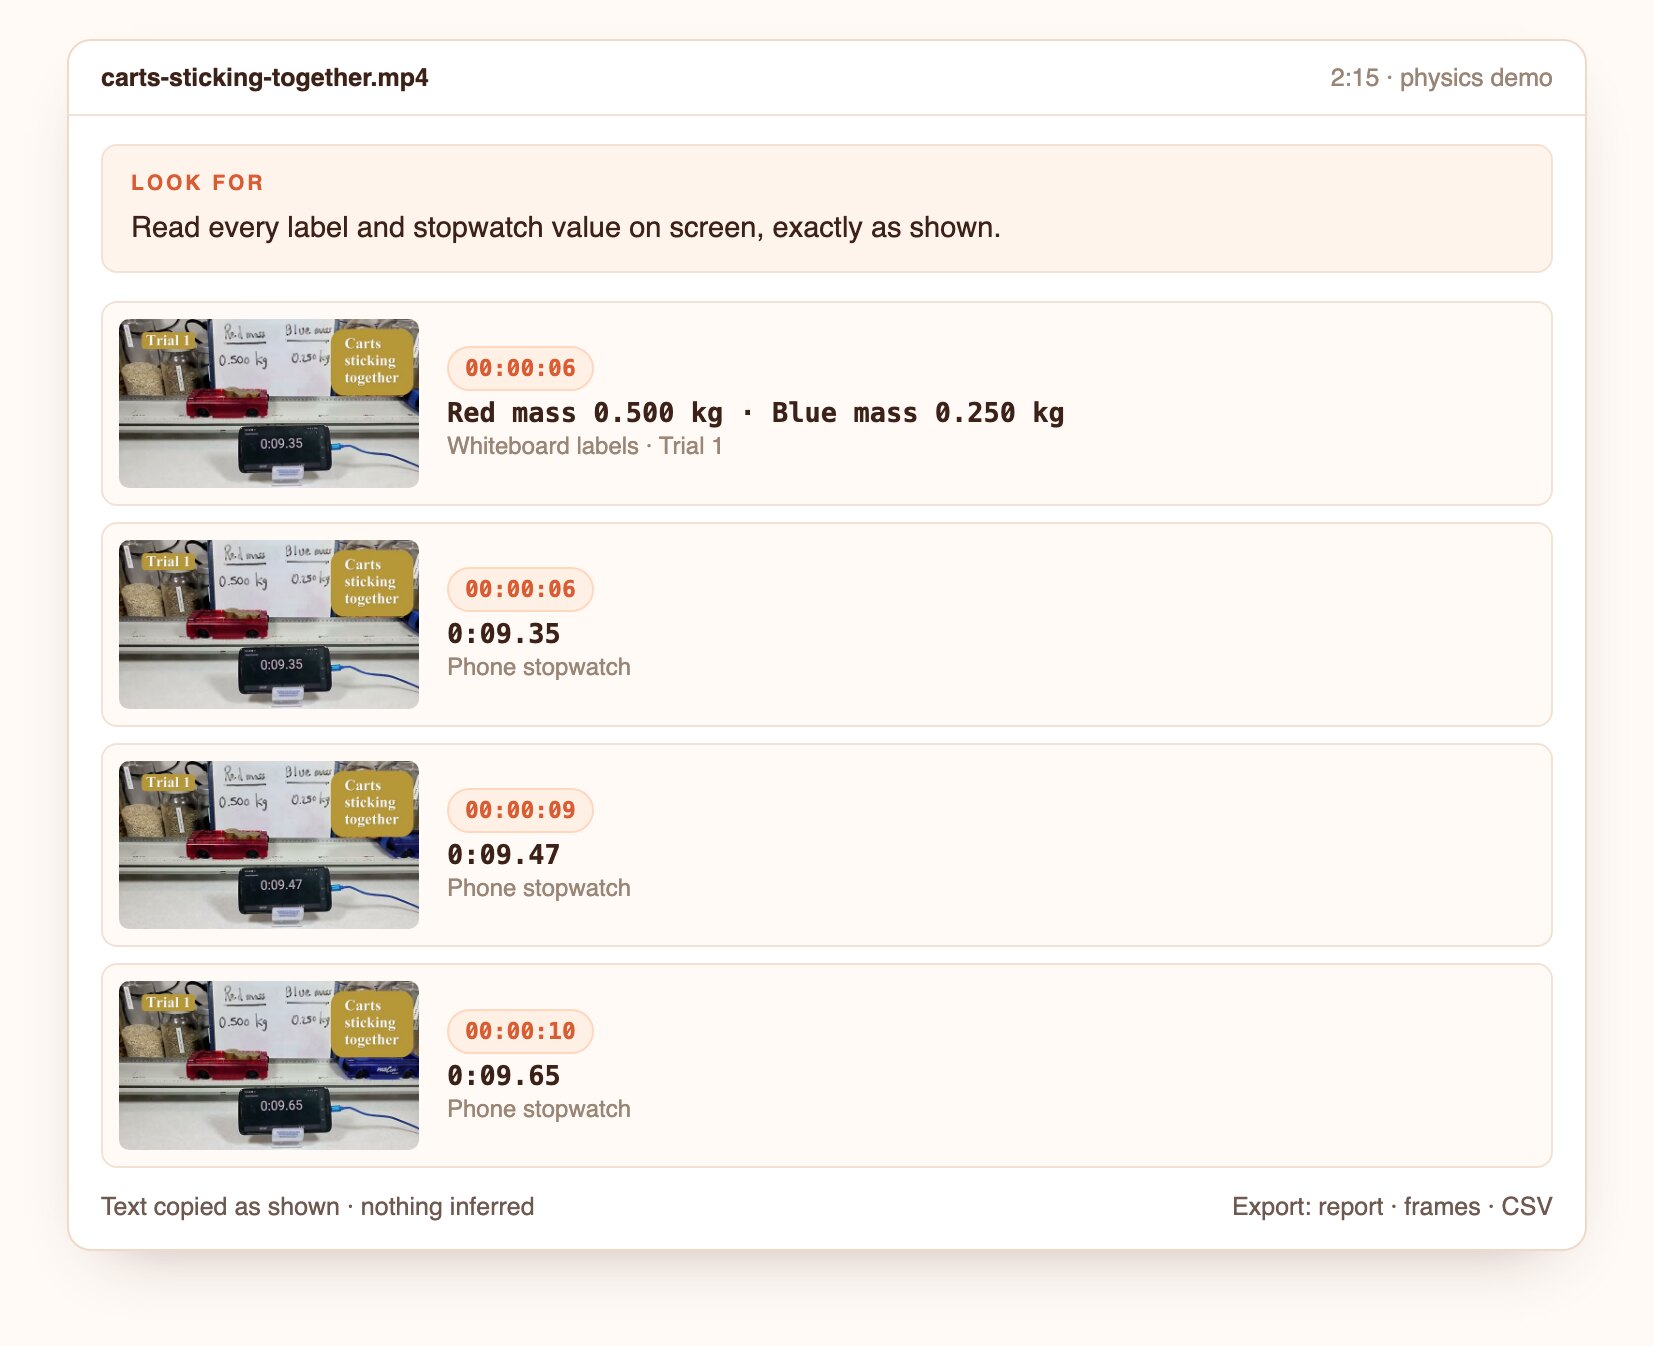
Open the screenshot to inspect the full detail.
Questions to ask
Real questions from our live-examples corpus, each paired with a public video. Results are published as Docsie produces them.
“Using the first seconds after ignition, while the launch towers are still in frame, track the top of the SLS rocket frame by frame, with the rocket's own height (98 m, 322 ft) as the scale…” Source: NASA Marshall Space Flight Center, public domain.
“ESA astronaut Andreas Mogensen bounces an inflatable globe off a rigid surface and then off a loose curtain aboard the International Space Station. For each collision, find the…” Source: NASA Johnson Space Center, public domain.
“This video shows eight trials of a red cart (0.500 kg) and a blue cart (0.250 kg) colliding and sticking together. For each trial, give the timestamp, which cart was moving, its velocity…” Source: Lee Trampleasure, CC BY.
“This Foucault pendulum video switches between real-time and 5x fast-forward segments; the clock in the lower right shows real elapsed time. Using that clock, count full oscillations over at…” Source: Zátonyi Sándor, Fizped, public domain.
“Track the three steel balls of this slowed-down Newton's cradle. For each collision give the timestamp, which ball arrives and which leaves, and the outgoing ball's maximum swing height or…” Source: Riccardo Ottanta, public domain.
“Find the drop in this NASA Langley Lift+Cruise eVTOL crash-test documentary. From the real-time wide shot, give the release and impact timestamps, the fall time, the impact speed (v = g·t)…” Source: NASA Langley Research Center, public domain.
From a lab video to measurements with a method.
Upload a file or paste a link.
Ask in plain language, or start from this preset.
Open the frame behind each finding, then export the report, frames and CSV.
Join forward-thinking teams using Docsie




_Leader_Small-Business_Leader.svg)


Common questions
Q: How do I measure speed from a video?
A: You need a known distance in frame and the frame rate. Docsie times the motion between frames and reports speed with the method, or says what's missing.
Q: Is this an alternative to Tracker or Vernier Video Analysis?
A: Those tools have you click points frame by frame. Docsie finds the events and reads the frame for you, then shows its method so you can check it.
Q: What should be in the frame to get real units?
A: A scale reference such as a ruler or a known length, a steady camera, and ideally a visible timer. The more of these you have, the better the estimate.
Q: Can it read stopwatches and labels in the video?
A: Yes. On-screen timers, masses and labels are copied exactly and used in the analysis.
Q: Can students use it for lab reports?
A: Yes. Every measurement comes with frames and method notes they can cite and check.
Q: How long can a video be?
A: Up to 40 minutes per video. Longer recordings are split, and the findings are merged onto one timeline.
Q: Where does my footage go?
A: Use Docsie's cloud, or deploy Docsie on your own infrastructure so footage stays inside your network.
See it on your own footage
Book a DemoEvents timed, values read, method shown.
Up to 40 minutes per video. Cloud or self-hosted.