
How to Create a Dashboard in ServiceNow
This guide walks you through building a complete Incident Management Dashboard in ServiceNow. You will learn how to create the dashboard, add widgets, customize the layout and tabs, rearrange and configure widgets, set up interactive filters, and share the dashboard with other users.
Video: Service Now: How to Create Dashboard by Kavitha Suresh Kumar (2023). All credit for the demonstration goes to the creator; watch the original on YouTube. The written guide below was generated from this video by Docsie. Creator? Request a change or removal.
This guide walks you through building a complete Incident Management Dashboard in ServiceNow. You will learn how to create the dashboard, add widgets, customize the layout and tabs, rearrange and configure widgets, set up interactive filters, and share the dashboard with other users.
Prerequisites
- A ServiceNow account with access to the Self-Service section and dashboard creation permissions.
- Access to the reports you intend to add as widgets (see the note on report access in the sharing section below).
Creating the incident management dashboard
- Log in to your ServiceNow account. After logging in, you will see the ServiceNow homepage. In this example, the homepage displays the "App Engine Studio" with a "Let's Go" button.
-
Navigate to Dashboards. Locate the navigation menu at the top, then find and click the Dashboards option under the Self-Service section.
-
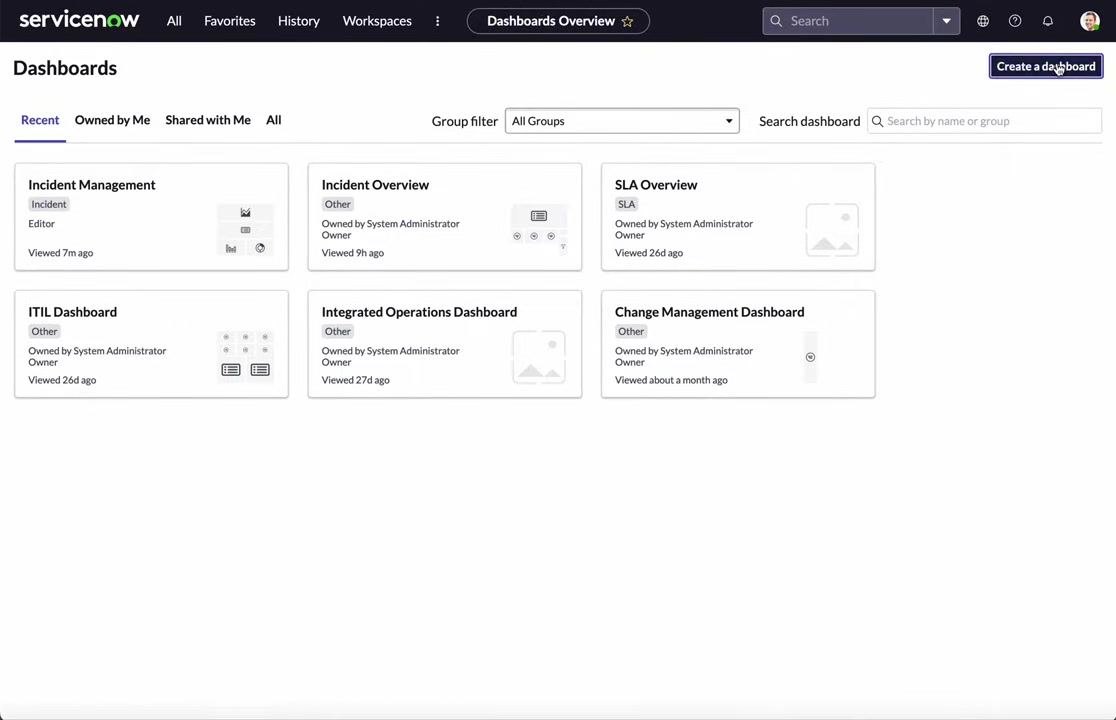
Open the Dashboards Overview. You will see the Dashboards Overview page, listing available dashboards such as "Incident Management," "Incident Overview," "SLA Overview," "ITIL Dashboard," "Integrated Operations Dashboard," and "Change Management Dashboard." Click the Create a dashboard button in the upper right corner.
-
Enter the dashboard details. In the Dashboard - New Record form, fill in the following fields:
- Name: Enter "Incident Management Dashboard".
- Group: Leave blank unless you want to assign the dashboard to a specific group.
- Order: Leave blank unless you want to specify a display order.
- Restrict to roles: If you want to restrict access, click the pencil icon and select specific user roles. Otherwise, leave it unrestricted.
- Active: Ensure this checkbox is enabled (checked) by default.
- Owner: By default, you are set as the owner (for example, "System Administrator"). You can change this if needed.
-
Submit the dashboard. Click the Submit button at the bottom left of the form to create the dashboard.
-
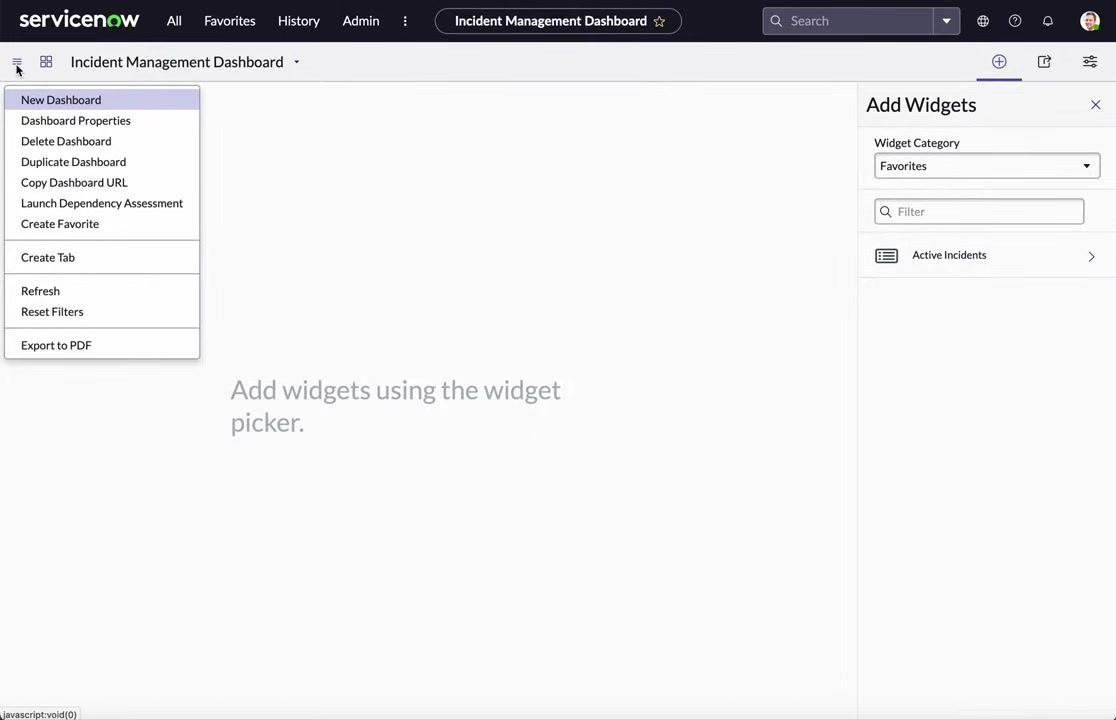
Access the dashboard menu. After creation, you are taken to the new "Incident Management Dashboard" screen. The dashboard menu (hamburger icon) provides several options:
- New Dashboard
- Dashboard Properties
- Delete Dashboard
- Duplicate Dashboard
- Copy Dashboard URL
- Launch Dependency Assessment
- Create Favorite
- Create Tab
- Refresh
- Reset Filters
- Export to PDF
The right panel allows you to add widgets using the widget picker.
-
Review the available dashboard actions. From the dashboard menu, you can create a new dashboard, change dashboard properties, delete, duplicate, or copy the dashboard URL, mark the dashboard as a favorite, create additional tabs, export the dashboard to PDF, and add widgets using the widget picker (currently, no widgets are present).
-
Prepare to add widgets. The dashboard is now ready for customization. The next step is to add widgets to display incident data and other relevant information.
You have now created an Incident Management Dashboard in ServiceNow and are ready to add widgets for further customization.
Adding widgets to the dashboard
- Open the widget picker (if not already open). If the widget picker panel is not visible on the right, click the plus (+) icon in the upper right corner to open it. The widget picker allows you to add various types of widgets to your dashboard.
- Browse widget categories.
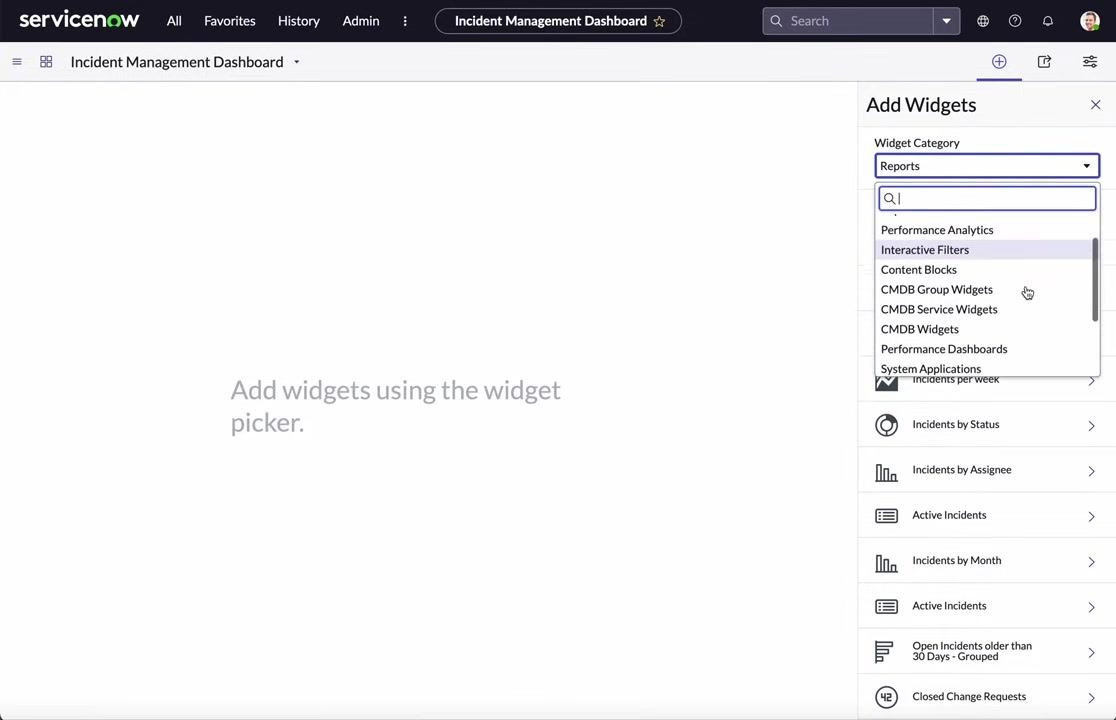
In the Add Widgets panel, locate the Widget Category dropdown and click it to view the available categories:
- Favorites
- Reports
- Performance Analytics
- Interactive Filters
- Content Blocks
- CMDB Group Widgets
- CMDB Service Widgets
- CMDB Widgets
Select the desired category to filter the available widgets.
-
Add a content block (optional). To add an external website or ServiceNow form as an iframe, select Content Blocks from the Widget Category dropdown, then click New IFrame. Review the description: "An IFrame block displays another website within an embedded, inline frame. Typically used to display content from a separate, external website, it can also be used to embed a Service-now.com form within a content page." Click Add to insert the IFrame widget, or click the configuration link to set up a reusable IFrame block.
-
Switch to the Reports category. To add incident-related reports, select Reports from the Widget Category dropdown. The right panel displays a list of available reports and a search/filter box.
-
Search for incident reports. In the search box, type incident to filter the list to incident-related reports. Example reports shown include:
- Active Incidents by Priority
- Incidents per week
- Incidents by Status
- Incidents by Assignee
- Active Incidents
- Incidents by Month
- Open Incidents older than 30 Days - Grouped
- Incidents by Priority and State older than 30 Days
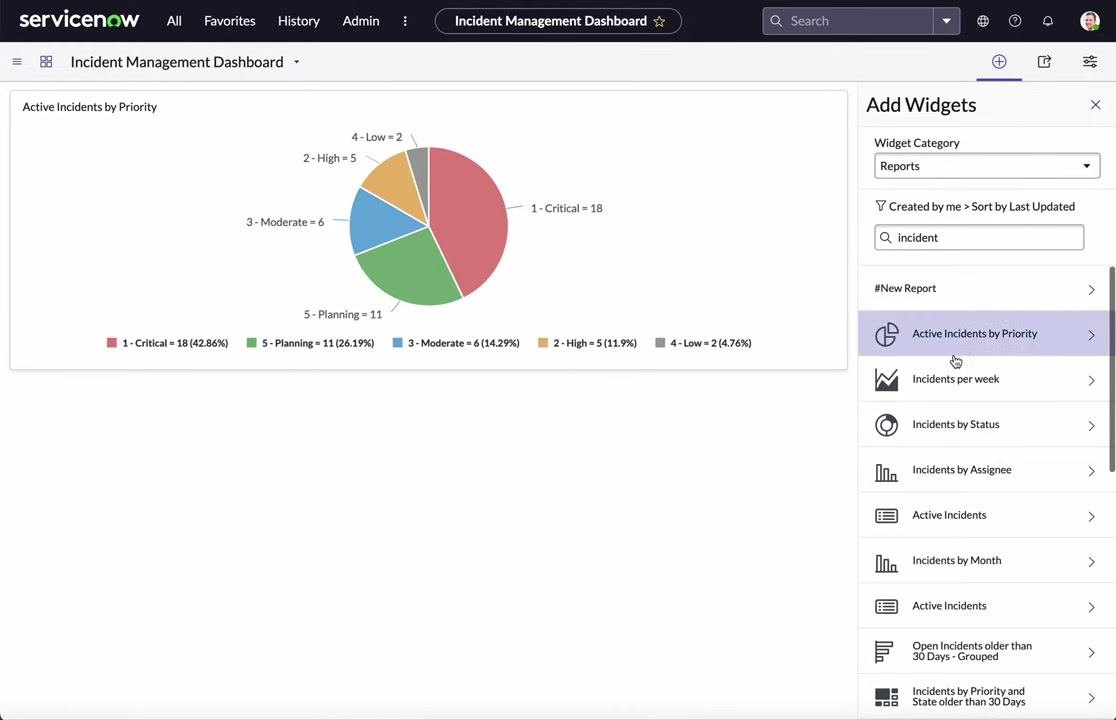
- Preview and add reports as widgets. Click on a report (for example, Active Incidents by Priority) to preview it as a widget. Review the preview (for example, a pie chart showing incident counts by priority), then click Add to insert the report as a widget on your dashboard. Repeat for other relevant reports (for example, Incidents per week, Incidents by Status, Incidents by Assignee).
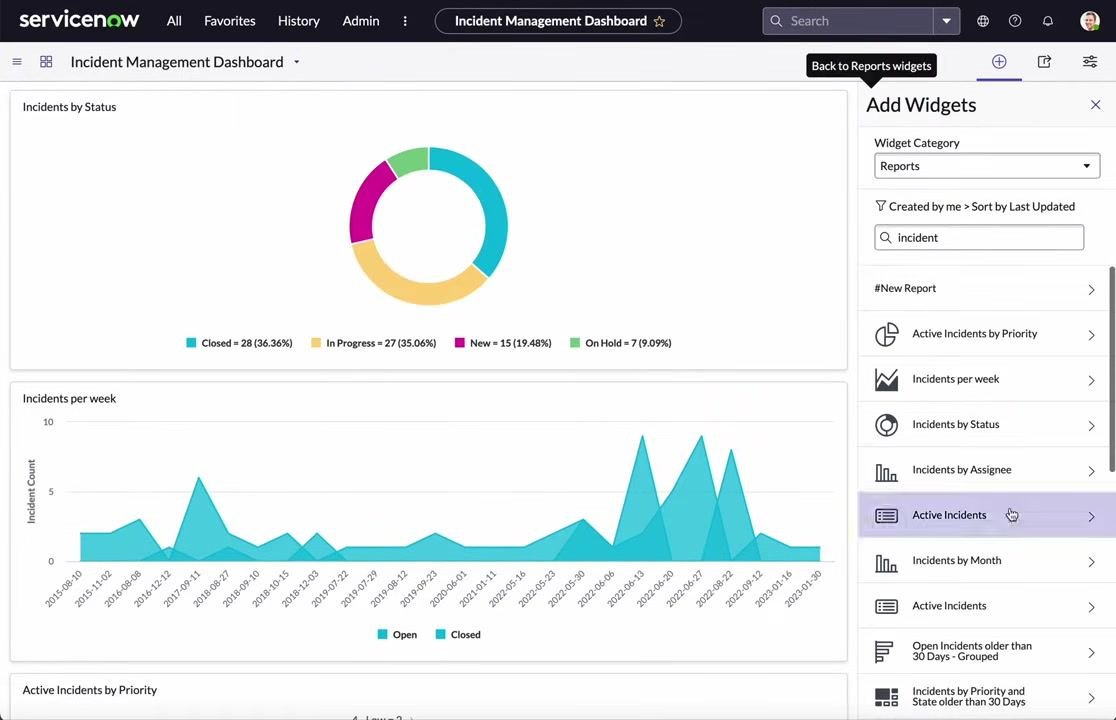
- Review the added widgets.
As you add widgets, they appear on your dashboard. You can see multiple widgets such as:
- Incidents by Status (donut chart)
- Incidents per week (line chart)
- Active Incidents by Priority (pie chart)
Continue adding, previewing, and arranging widgets as needed.
You have now added and configured widgets to your Incident Management Dashboard. Continue customizing by rearranging widgets or adding more as needed.
Customizing the dashboard layout and tabs
- Review the added widgets.
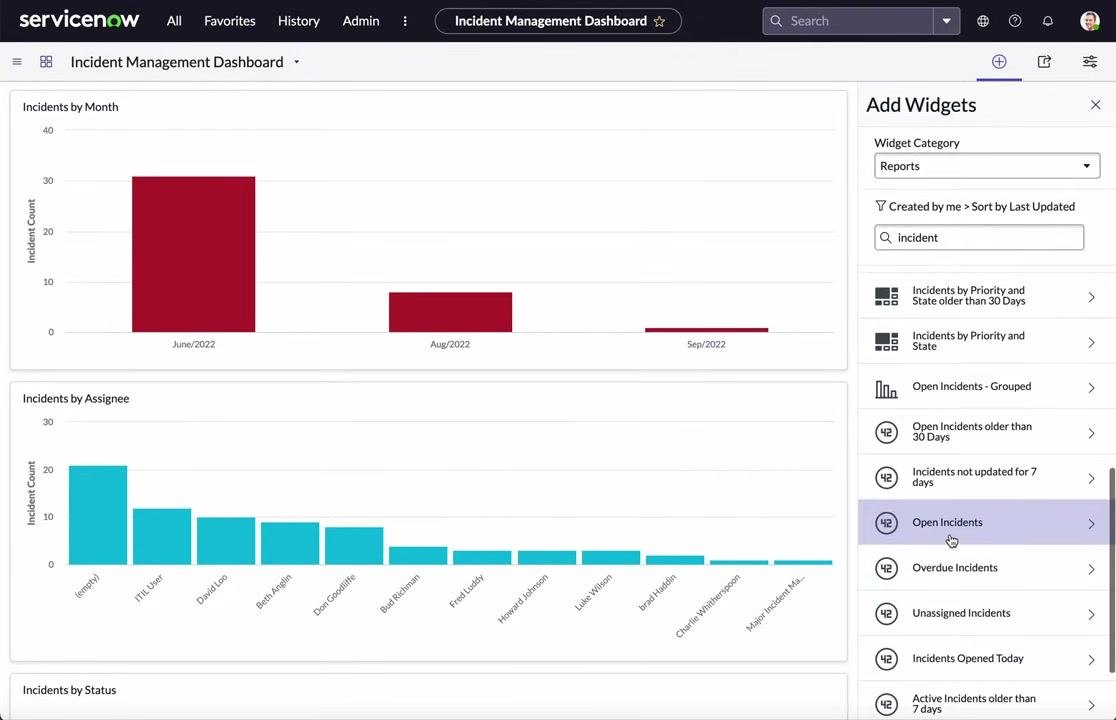
Confirm that your dashboard displays the widgets you have added, such as:
- Incidents by Month (bar chart)
- Incidents by Assignee (bar chart)
- Incidents by Status (donut chart)
- Incidents per week (line chart)
- Active Incidents by Priority (pie chart)
- Open Incidents (large number display)
The "Add Widgets" panel remains open on the right for further customization.
-
Access the configuration panel. Click the configuration icon (gear/cog) in the upper right to open the dashboard configuration panel. The configuration panel appears on the right, displaying options for creating tabs, changing the dashboard background color, and applying quick layout templates.
-
Apply a quick layout. In the configuration panel, locate the Apply Quick Layout section and click on a layout template (for example, the first option with two rows and three columns). The dashboard immediately updates to the selected layout, rearranging widgets accordingly.
-
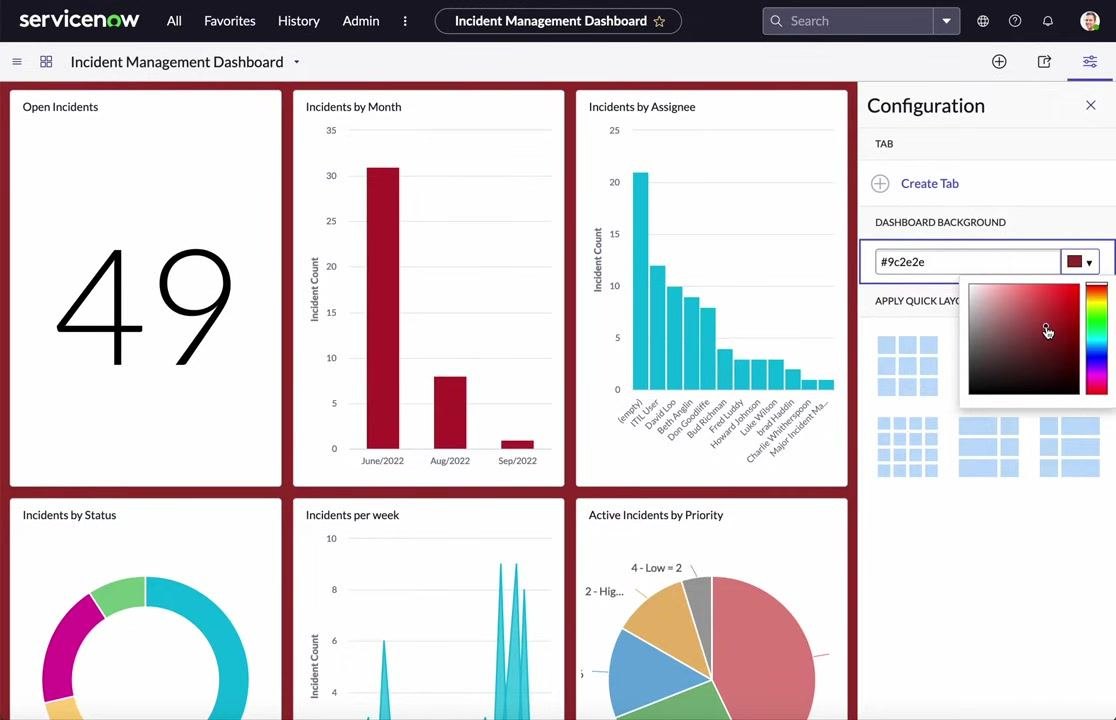
Change the dashboard background color. In the configuration panel, find the Dashboard Background field. Click the color picker icon next to the hex color code (for example,
#ffffff) and select a new color from the palette (for example, a shade of red,#9c2e2e). The dashboard background updates instantly to reflect your chosen color.
-
Experiment with different background colors. Continue adjusting the background color as desired by selecting different shades from the color picker. Observe the dashboard updating in real time with each color change.
-
Create and rename tabs. In the configuration panel, click Create Tab to add a new tab to your dashboard. Two tabs appear at the top: "Incident Management - New Tab" and "Incident Management - New Tab 2." Click a tab name to open the Rename tab dialog, enter a new name for the first tab such as Incident Management Charts, and click OK. Repeat for the second tab, naming it Incident Management Lists.
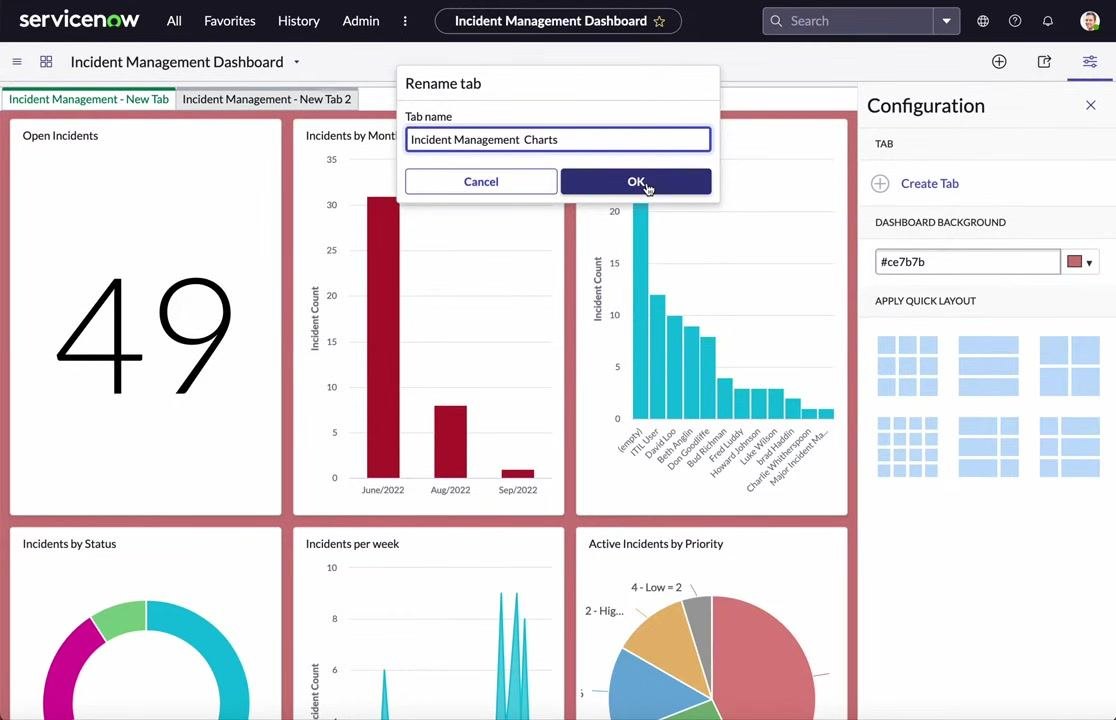
- Switch between tabs. Click on the tab labeled Incident Management Lists to switch to it. The tab displays a message: "Add widgets using the widget picker." The background color and configuration panel remain consistent with your previous settings.
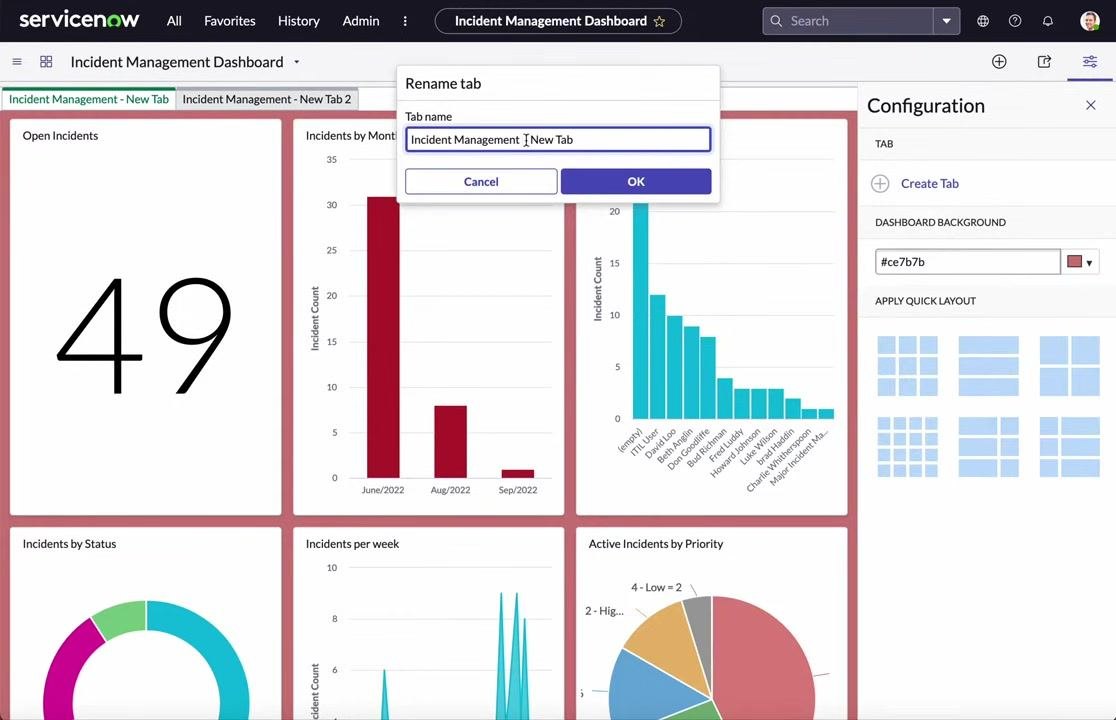
- Add widgets to the new tab. With the Incident Management Lists tab active, use the widget picker on the right to add new widgets as needed. For example, select Active Incidents from the list to add a list widget to this tab.
You have now customized your Incident Management Dashboard by applying a new layout, changing the background color, and organizing widgets into separate tabs for charts and lists. Continue adding widgets to each tab as needed to tailor the dashboard to your workflow.
Rearranging and configuring individual widgets
-
Access the Incident Management Dashboard. Ensure you are on the "Incident Management Dashboard" page and confirm you are viewing the "Incident Management Charts" tab.
-
Open the widget configuration panel. Locate the widget you want to modify (for example, "Open Incidents"). Hover over the widget to reveal the widget toolbar, then click the configuration (gear) icon to open the widget settings.
-
Change the widget height. In the widget toolbar, click the up or down arrow icon labeled "Increase Height / Decrease Height (shift)" to adjust the widget's height. This allows you to make the widget larger or smaller as needed.
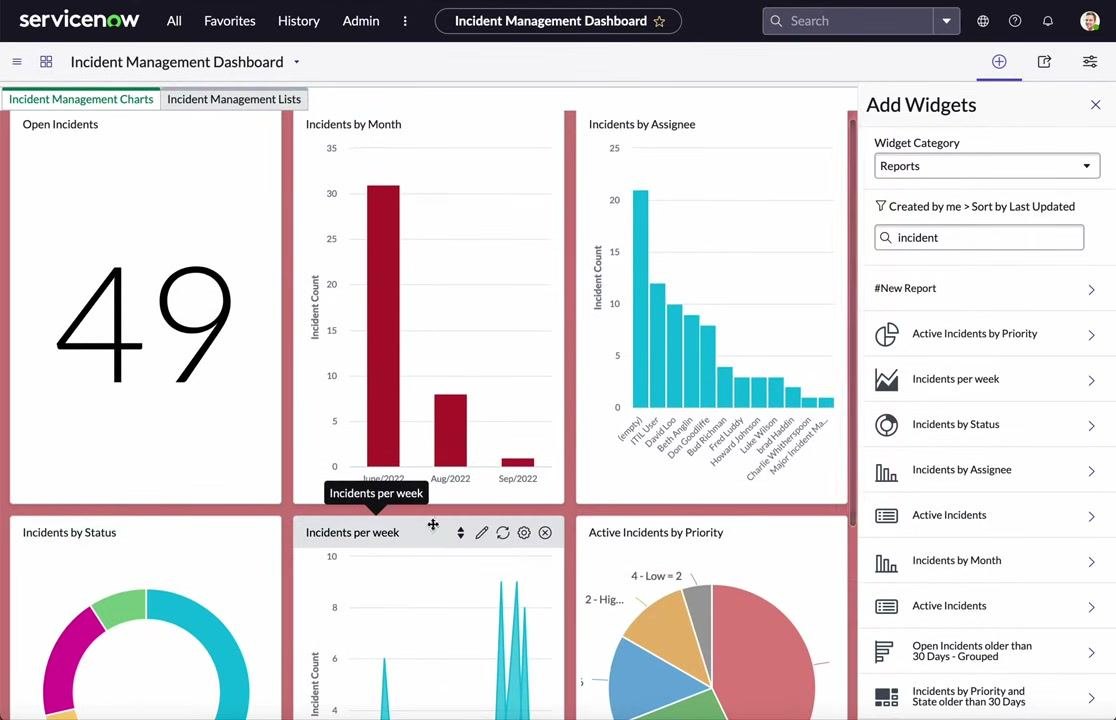
- Drag and drop widgets to rearrange them. Click and hold the widget header to drag it to a new position on the dashboard, then drop it in the desired location to rearrange the dashboard layout. You can move widgets such as "Incidents by Status," "Active Incidents by Priority," and "Incidents by Month" to the top or any preferred position.
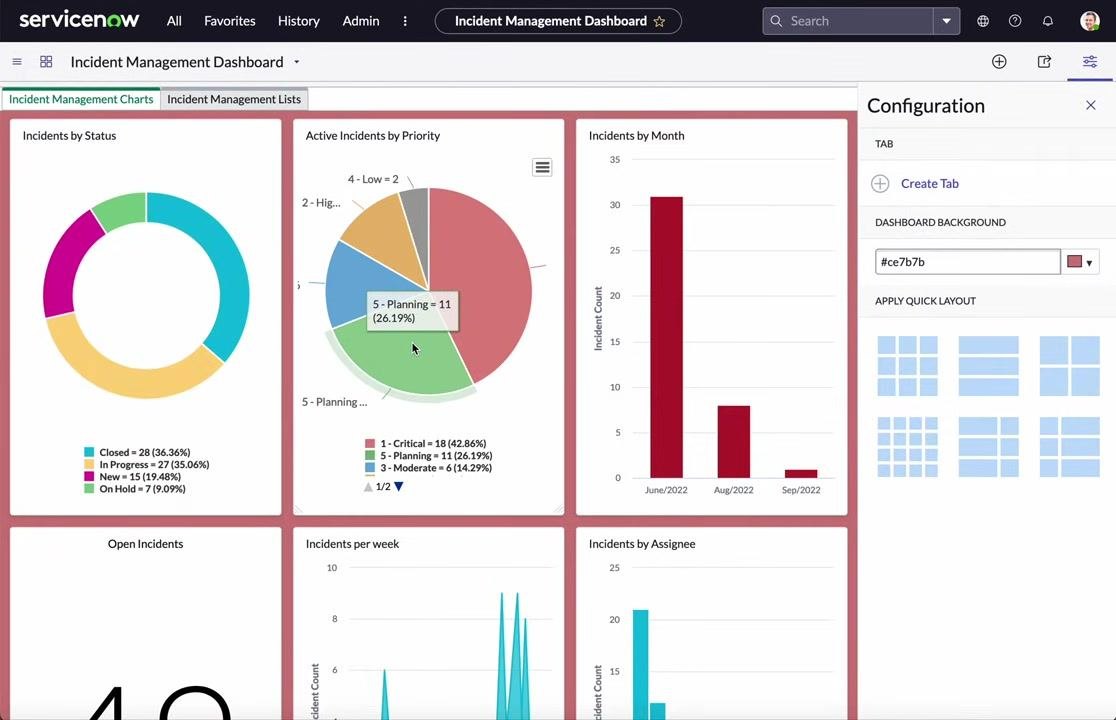
- Edit widget display options.
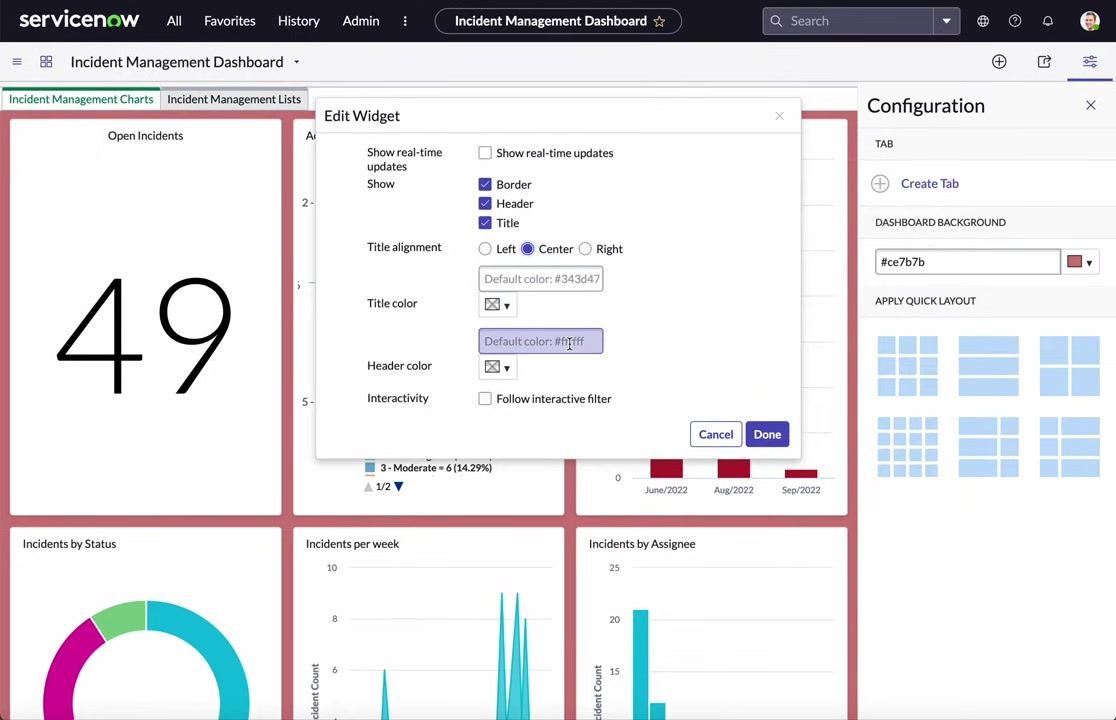
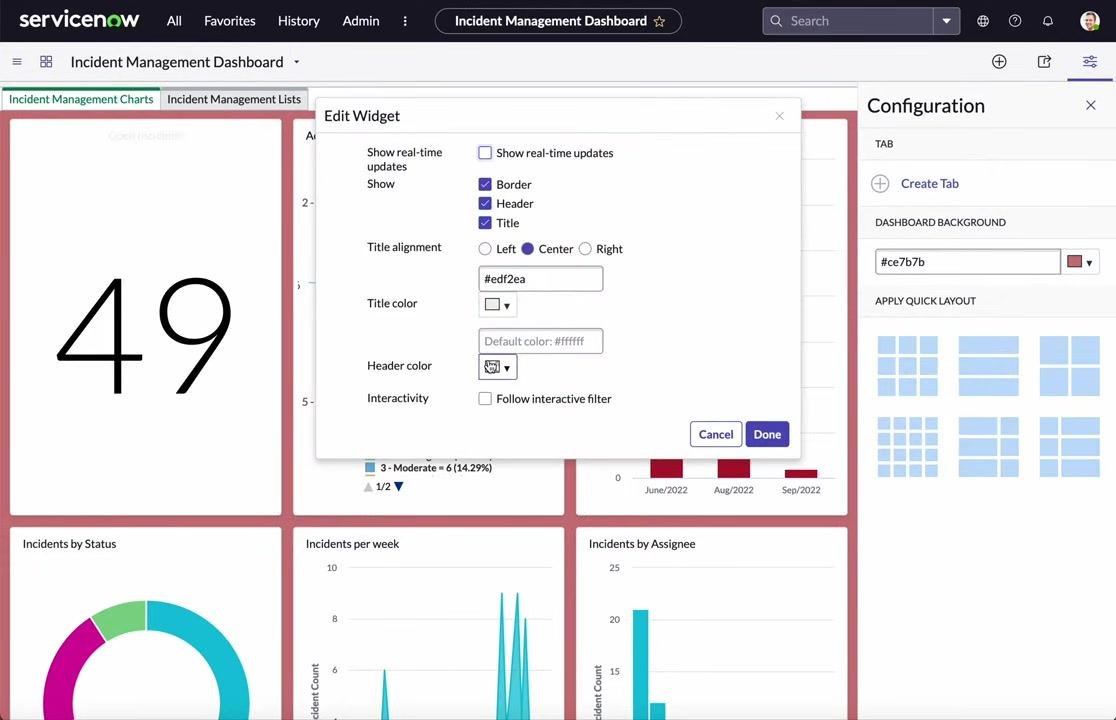
Click the pencil (edit) icon on the widget toolbar to open the Edit Widget dialog. In this dialog, you can:
- Toggle "Show real-time updates"
- Show or hide the "Border," "Header," and "Title"
- Set "Title alignment" (Left, Center, Right)
- Change "Title color" and "Header color" using color pickers or hex codes
- Enable or disable "Interactivity" (for example, follow interactive filter)
For example, to hide the title, uncheck the "Title" box.
- Apply custom colors.
In the Edit Widget dialog, enter a hex code or use the color picker to set a custom color for the title or header. For example, set the title color to
#edf2eaand the header color to your preferred value.
-
Save your widget changes. After making your desired changes, click the Done button in the Edit Widget dialog to apply the settings. Click Cancel if you do not wish to save the changes.
-
Close the configuration panel (optional). If you are finished customizing, click the X in the upper right of the configuration panel to close it.
By following these steps, you can fully customize the layout, appearance, and behavior of widgets on your ServiceNow Incident Management Dashboard to suit your reporting and monitoring needs.
Configuring widget interactivity and using interactive filters
- Review the dashboard layout and configuration panel.
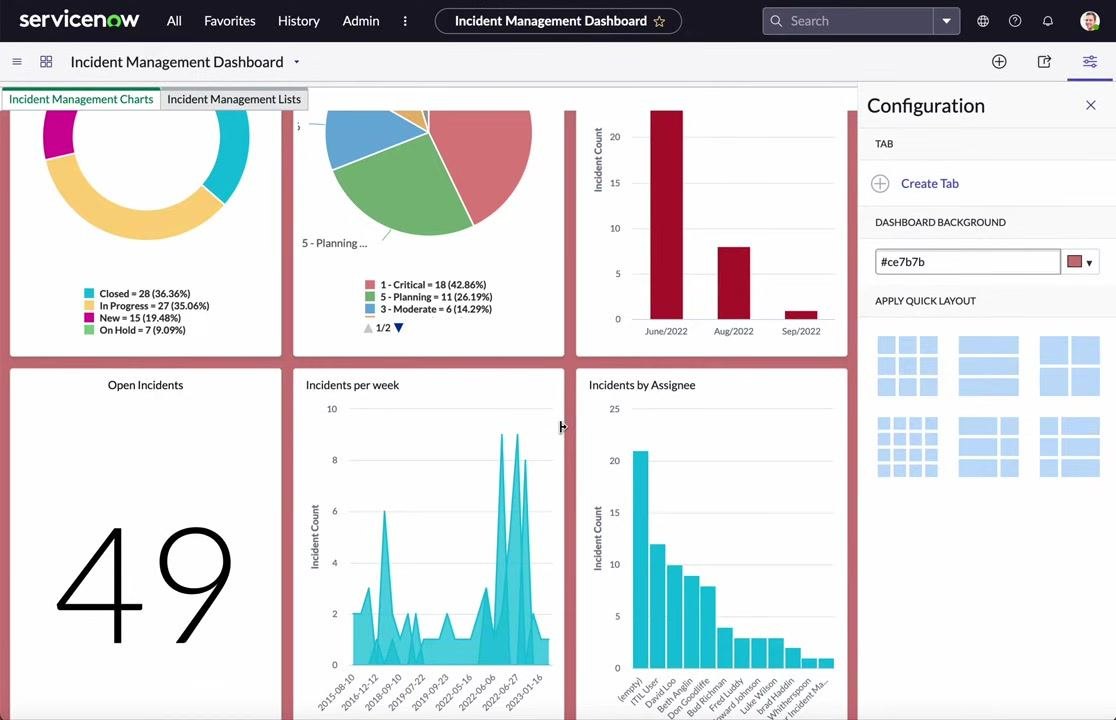
Ensure you are on the "Incident Management Dashboard" under the "Incident Management Charts" tab. Observe the dashboard layout, which includes widgets such as "Incidents by Status," "Active Incidents by Priority," "Incidents by Month," "Open Incidents," "Incidents per week," and "Incidents by Assignee." The configuration panel is open on the right, showing options for creating tabs, setting the dashboard background color (
#ce7b7b), and applying quick layouts.
-
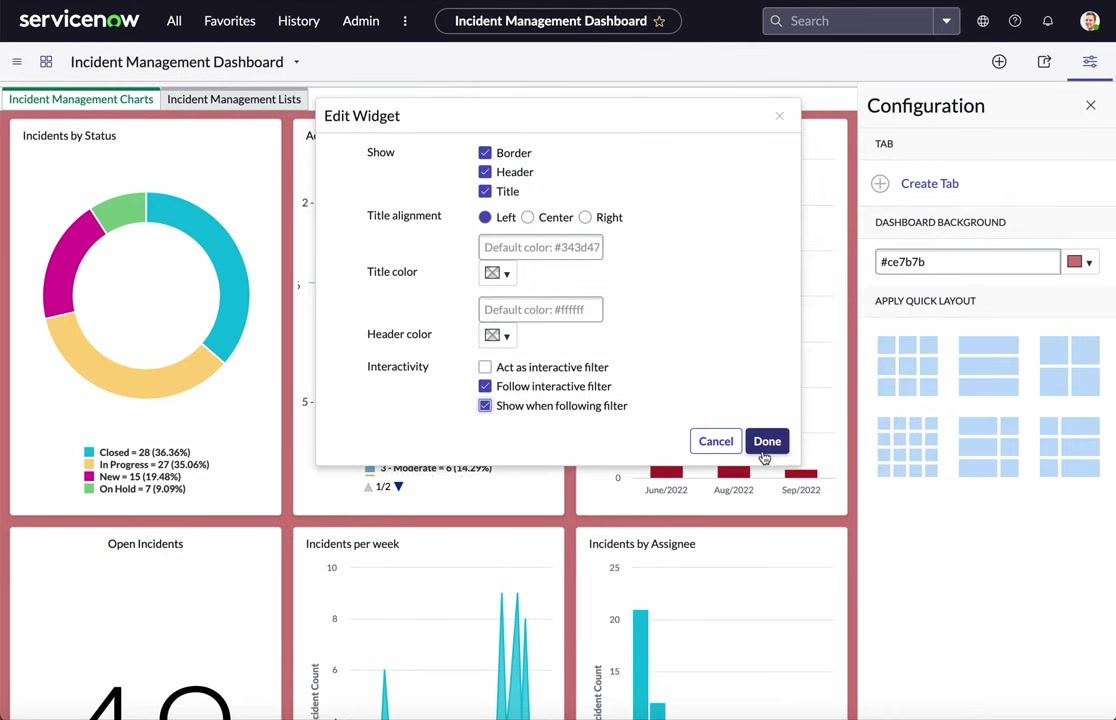
Open the Edit Widget dialog. Hover over the widget you want to configure (for example, "Incidents by Status"), then click the gear (settings) icon labeled "Edit Widget" to open the widget configuration dialog.
-
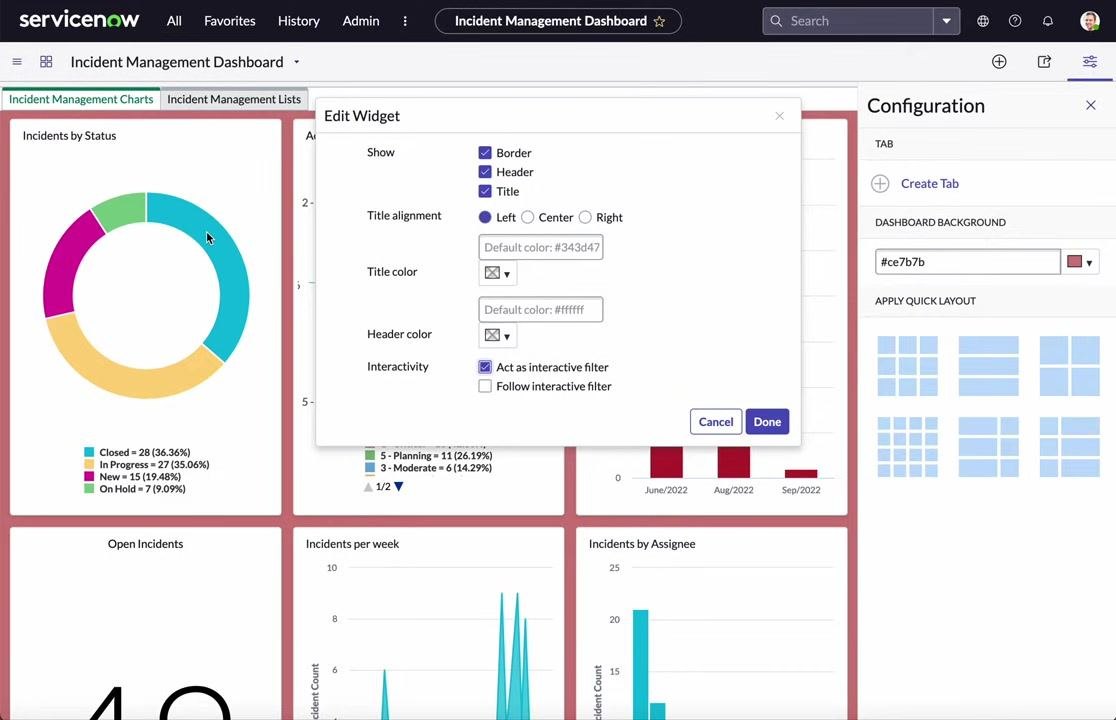
Configure widget display and interactivity. In the Edit Widget dialog, you can:
- Show or hide the "Border," "Header," and "Title" by checking or unchecking the respective boxes
- Set the "Title alignment" to Left, Center, or Right
- Specify custom colors for the title and header using color pickers or hex codes
- Enable interactivity options: Act as interactive filter allows the widget to act as a filter for other widgets, while Follow interactive filter makes the widget respond to filters set by other widgets
For example, check "Act as interactive filter" to allow the widget to filter others.
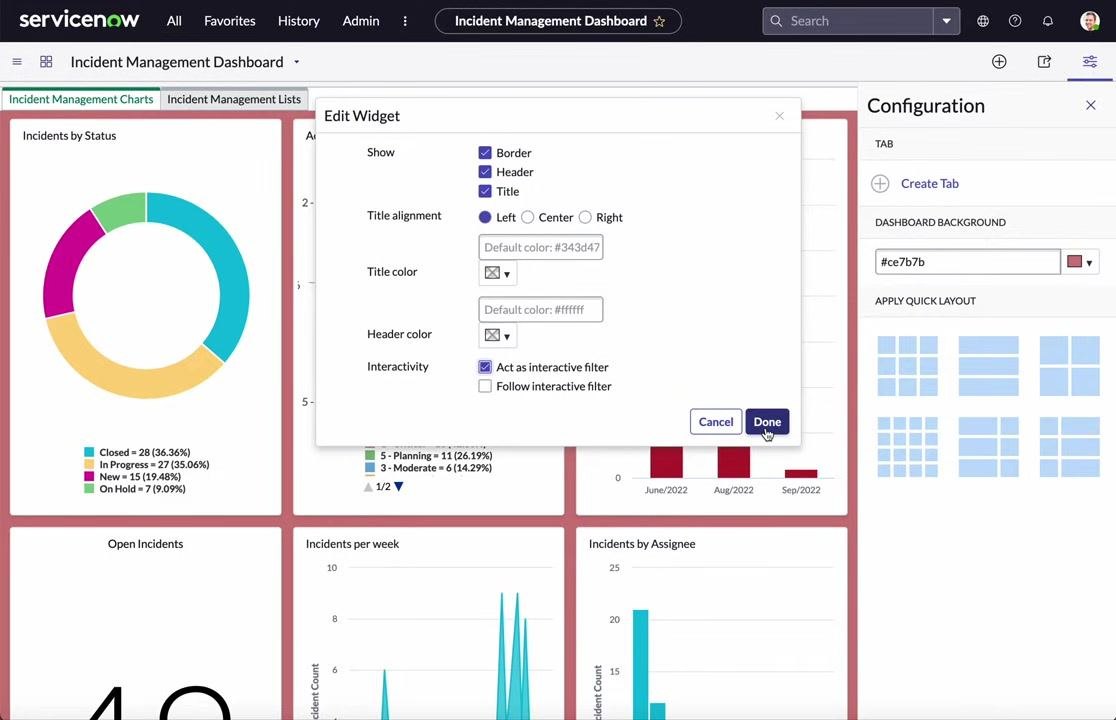
- Apply and save the widget settings. After configuring the desired options, click the Done button to save changes. The widget now acts as an interactive filter.
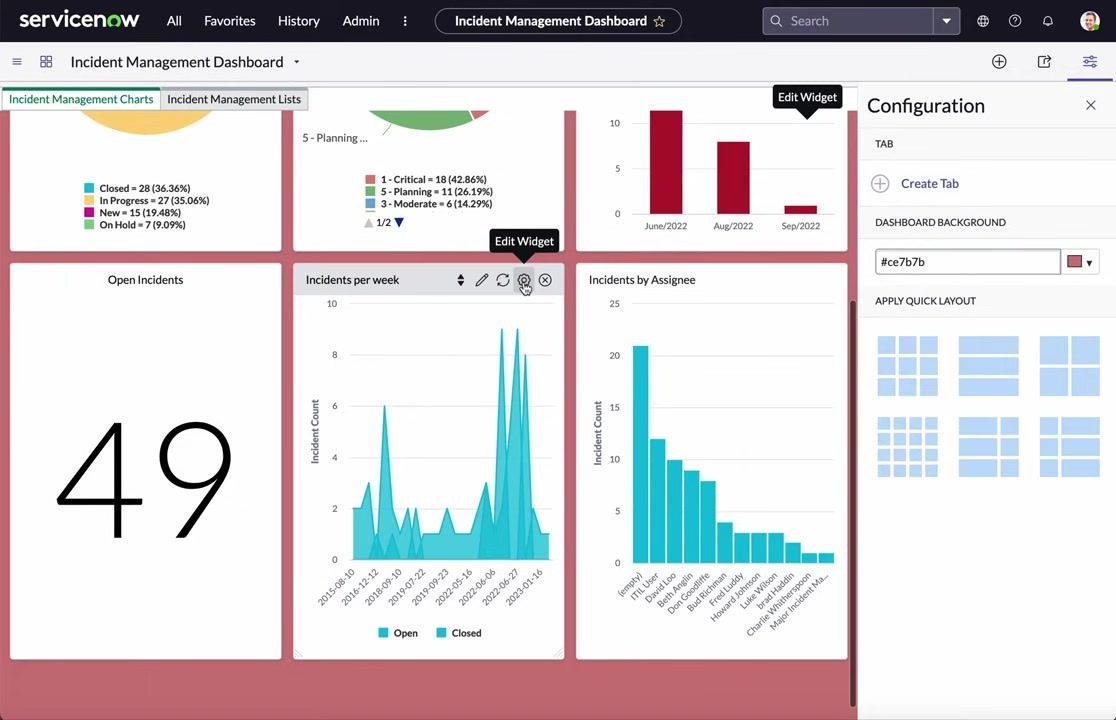
- Configure additional widgets to follow filters. Repeat the process for other widgets you want to respond to the interactive filter. Open the Edit Widget dialog for another widget (for example, "Active Incidents by Priority"), check "Follow interactive filter" and optionally "Show when following filter" to make the widget respond to the selected filter, then click Done to save the settings.
- Edit more widgets as needed. Continue editing additional widgets (for example, "Incidents per week," "Incidents by Assignee") by clicking their gear icons and configuring their interactivity settings as required.
- Use the interactive filter. Click on a segment of the widget acting as an interactive filter (for example, click the "New = 15" segment in "Incidents by Status"). Observe that all widgets configured to follow the filter update their data accordingly.
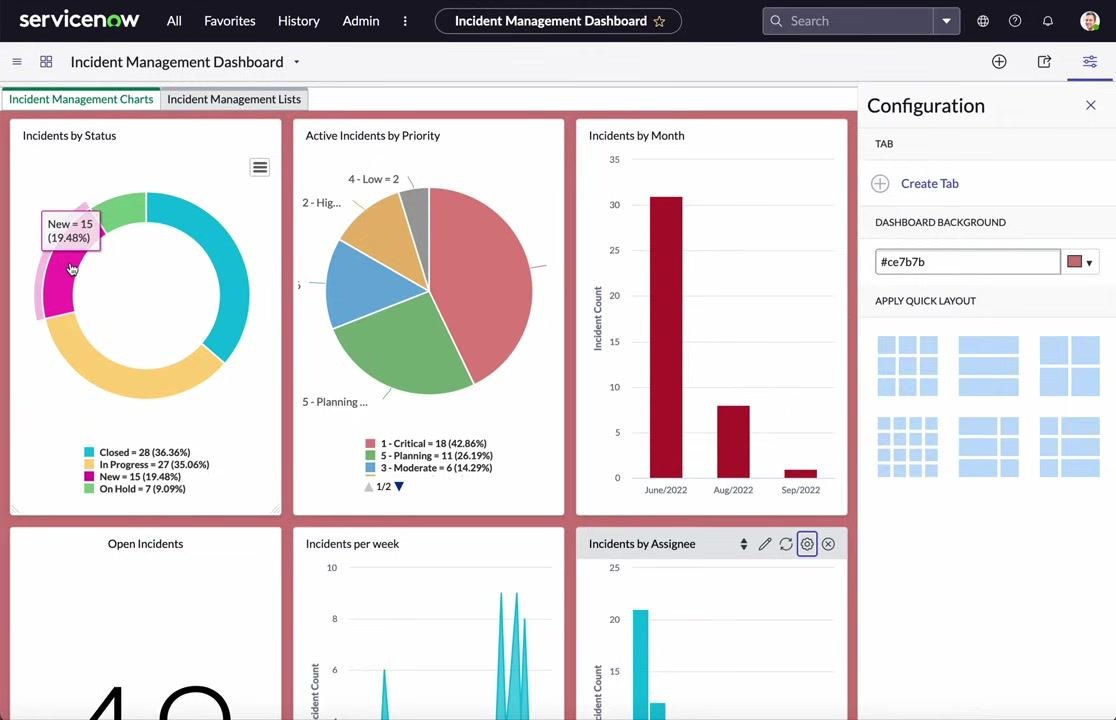
- Observe the filtered results. The widgets that follow the interactive filter (for example, "Active Incidents by Priority," "Incidents by Month," "Incidents per week," "Incidents by Assignee") refresh to display data relevant to the selected filter.
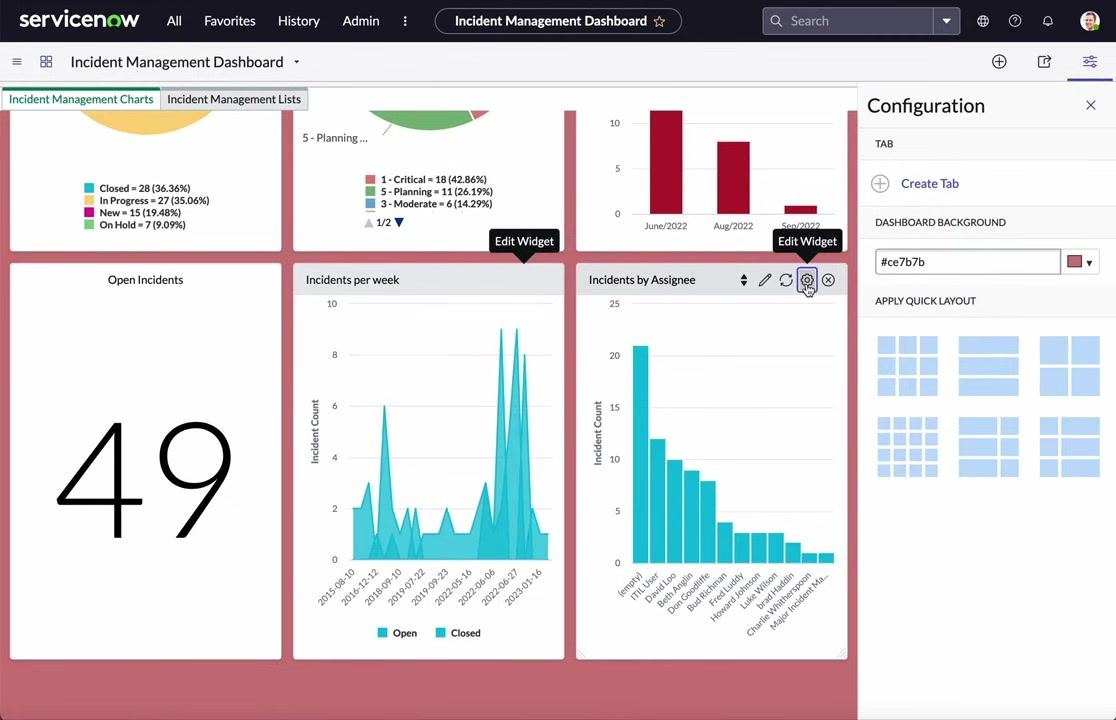
- Remove or change the filter. To remove the filter, click the selected segment again or use the filter controls provided by the widget. The widgets revert to displaying unfiltered data.
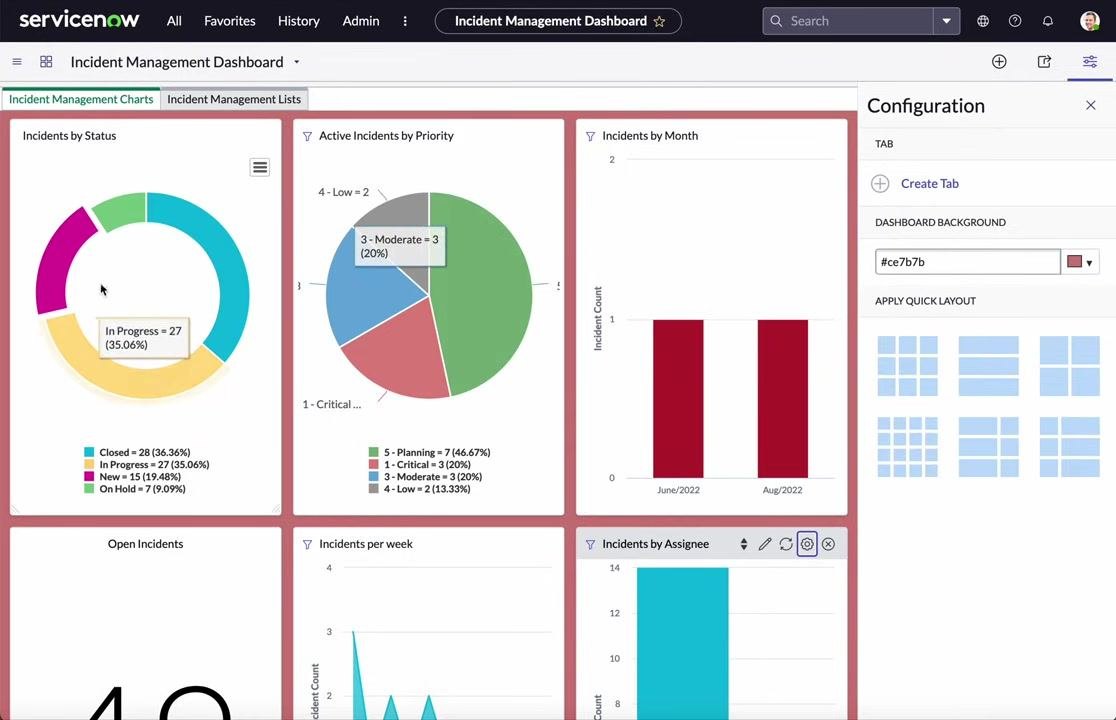
By following these steps, you can enable and utilize interactive filtering on your ServiceNow Incident Management Dashboard, allowing for dynamic and responsive data visualization across multiple widgets.
Sharing the dashboard
-
Open the Share panel. Locate and click the Share icon (typically found in the dashboard header or options menu). The Share panel appears on the right side of the screen.
-
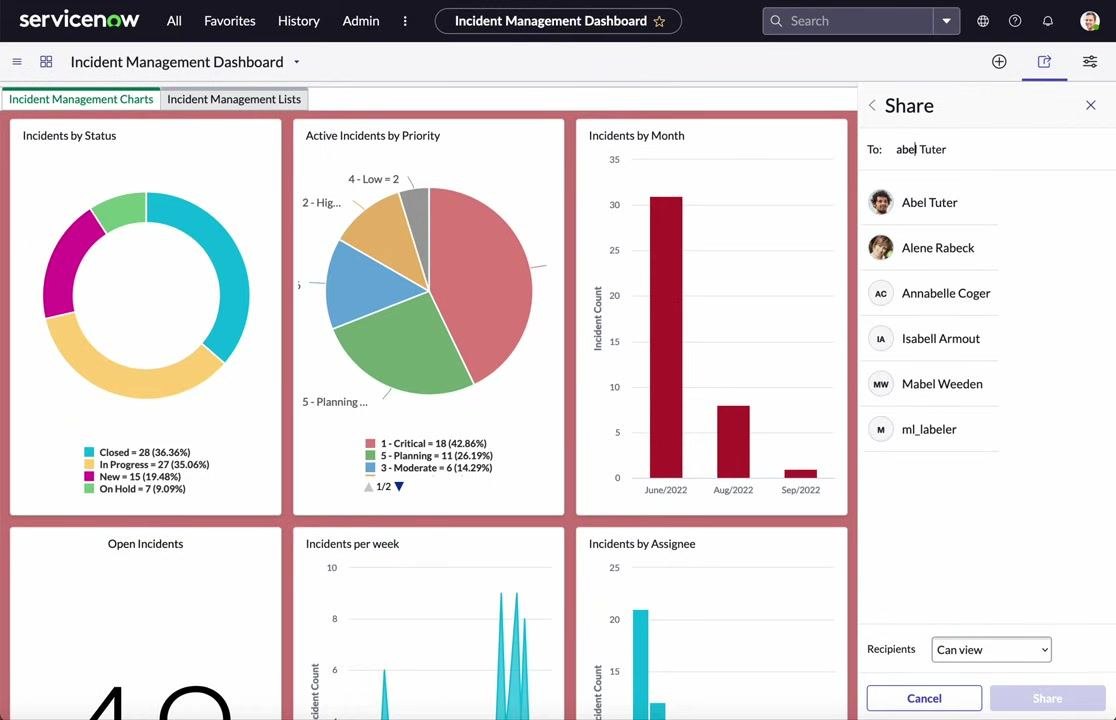
Search for the user to share with. In the To: field, begin typing the name of the user you wish to share the dashboard with (for example, type "abel Tuter"). As you type, a list of matching users appears below the search field. Select the correct user from the list (for example, "Abel Tuter").
-
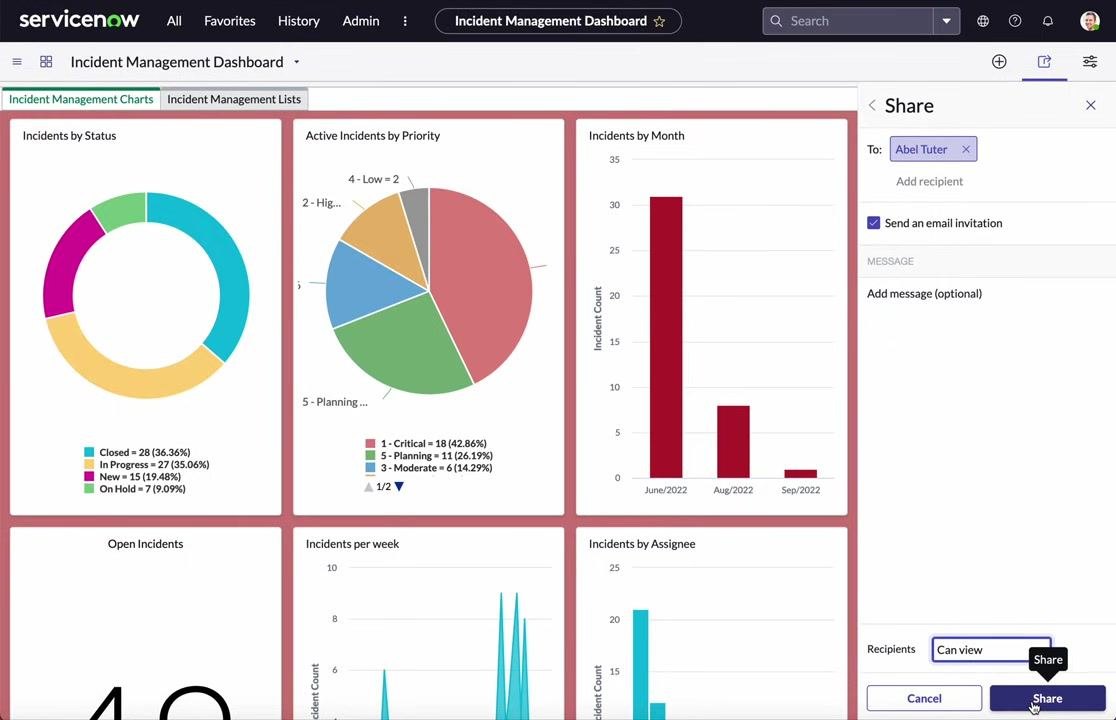
Add the user as a recipient. After selecting the user, their name appears in the To: field as a recipient. You may add additional recipients by repeating the search and selection process.
-
Set sharing permissions. In the Recipients dropdown at the bottom of the Share panel, select the appropriate permission level (for example, "Can view"). By default, "Can view" is selected, allowing recipients to view but not edit the dashboard.
-
Add a message (optional). In the MESSAGE section, you can add an optional message to accompany the sharing invitation.
-
Send an email invitation. Ensure the "Send an email invitation" checkbox is checked if you want the recipient(s) to receive an email notification.
-
Share the dashboard. Click the Share button at the bottom right of the panel to send the invitation and grant access.
-
Note on report access. Remember that the dashboard may contain multiple reports. Ensure that the user you are sharing with has access to each individual report within the dashboard. If the user only has dashboard access but not report access, they may not be able to view all data or widgets.
-
Verify sharing and permissions. After sharing, confirm with the recipient that they can access both the dashboard and its underlying reports. If issues arise, review and adjust report-level permissions as needed.
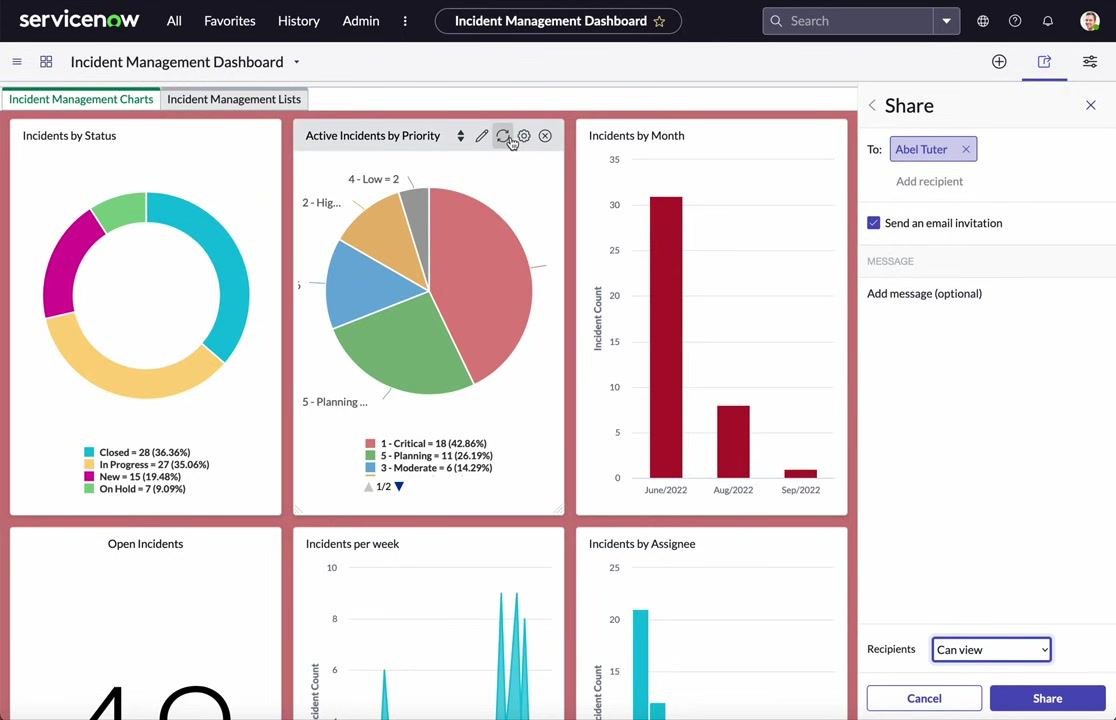
- Complete the sharing process. Once sharing is complete, you can close the Share panel. The dashboard is now accessible to the specified users with the permissions you set.
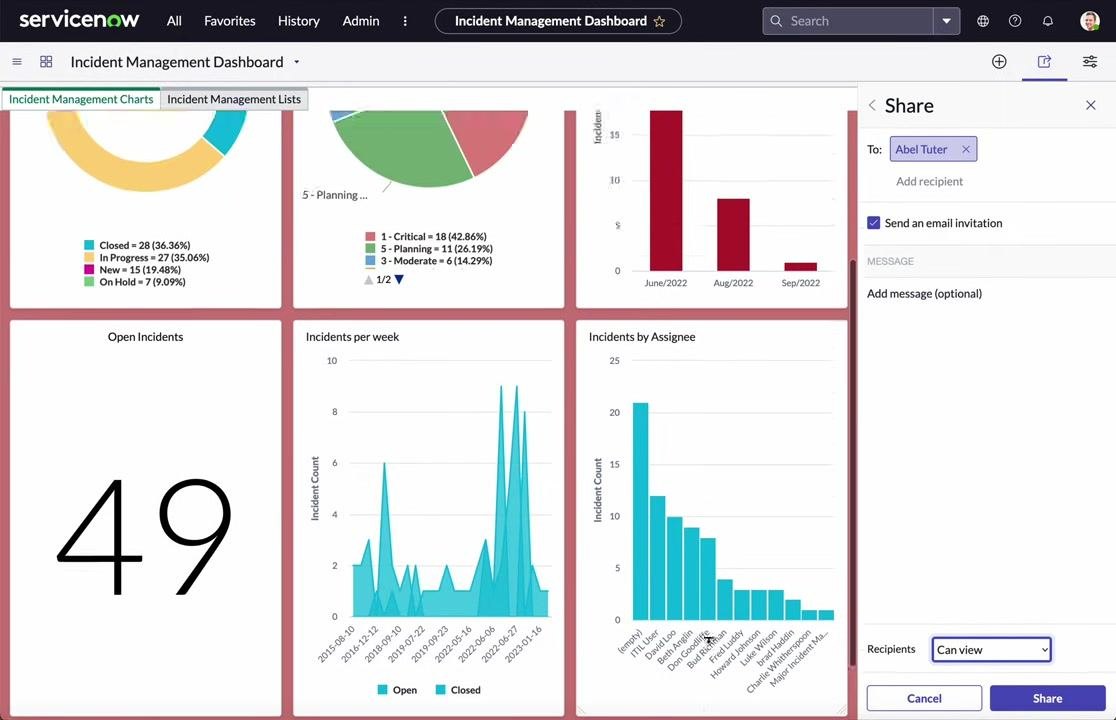
By following these steps, you can securely share your ServiceNow Incident Management Dashboard with colleagues, ensuring they have the necessary access to both the dashboard and its underlying reports. Always verify permissions to prevent access issues.
Summary
You have now built a fully functional Incident Management Dashboard in ServiceNow: created the dashboard, added report and content block widgets, organized them across multiple tabs with a custom layout and background color, rearranged and styled individual widgets, configured interactive filters to link widget data, and shared the dashboard with other users while accounting for underlying report permissions.
Generation details: cost, quality tiers
Docsie billed 4,500 credits ($3.15) to analyze this 9-minute video at standard quality. The rewrite, template fill and Word/PDF exports were included. The same video at each quality tier:
| Quality | Frames sampled | Credits | Approx. cost |
|---|---|---|---|
| Draft | every 16-30 s | 2,250 | $1.57 |
| Standard (this guide) | every 8-15 s | 4,500 | $3.15 |
| Detailed | every 4-7 s | 9,000 | $6.30 |
| Ultra | every 1-3 s | 18,000 | $12.60 |
Credits priced at $0.70 per 1,000; plans include a monthly allowance. Enterprise customers on on-premise or bring-your-own-model deployments run this on their own inference and pay no per-video credits.
Generated by Docsie Video-to-Docs on 2026-09-08 from a 9-minute video. Screenshots are frames from the source video and belong to their creator, Kavitha Suresh Kumar, whose original is embedded above. If you own this video and want the guide removed or credited differently, contact us and we will act within one business day.