
How to Connect ServiceNow to Power BI
The Power BI Connector for ServiceNow lets you explore and analyze your ServiceNow data directly in Power BI. By combining ServiceNow data with other sources, you can build advanced data models and reports. This guide walks you through how to connect ServiceNow to Power BI, from configuring your data source to building visualizations.
Video: ServiceNow Power BI Integration: How to Connect ServiceNow to Power BI with Power BI Connector by Alpha Serve Channel (2022). All credit for the demonstration goes to the creator; watch the original on YouTube. The written guide below was generated from this video by Docsie. Creator? Request a change or removal.
The Power BI Connector for ServiceNow lets you explore and analyze your ServiceNow data directly in Power BI. By combining ServiceNow data with other sources, you can build advanced data models and reports. This guide walks you through how to connect ServiceNow to Power BI, from configuring your data source to building visualizations.
Prerequisites
Before you connect ServiceNow to Power BI, assign the necessary role to the user within ServiceNow. This role grants the access required to use the Power BI Connector for ServiceNow.
Log in to ServiceNow
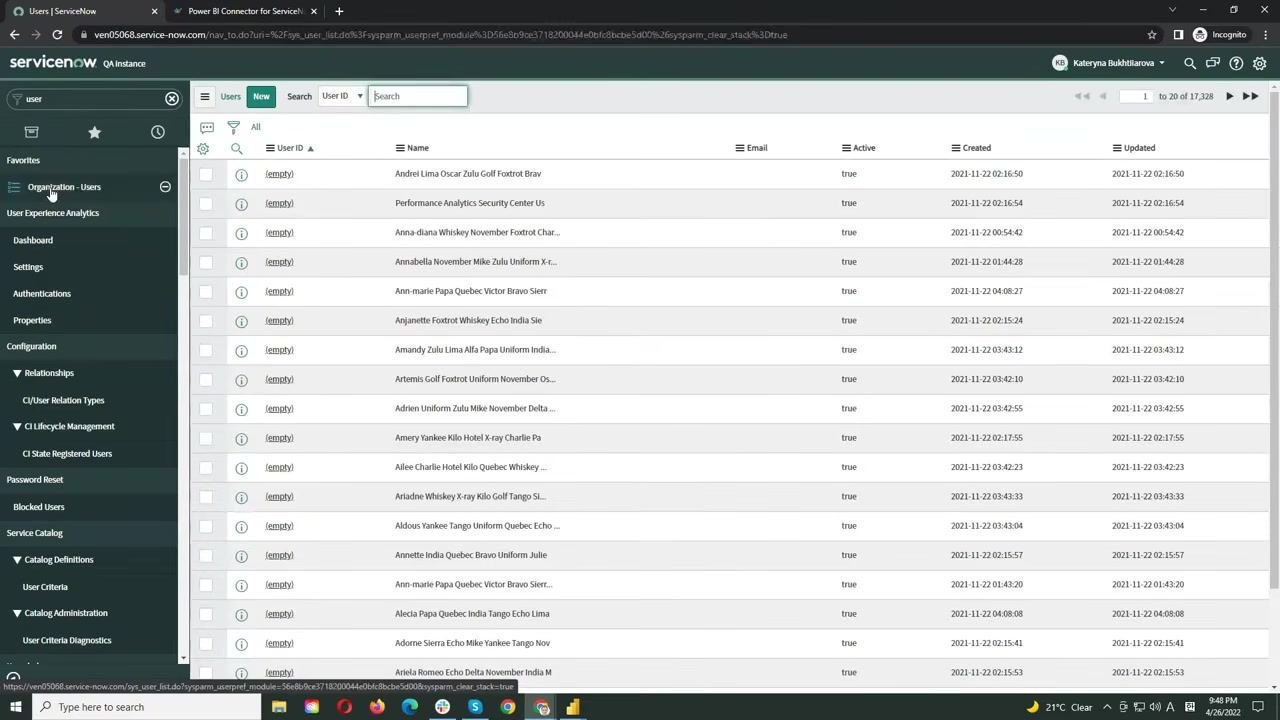
Access your ServiceNow instance using the appropriate credentials and permissions.
Find the Power BI Connector
Locate the Power BI Connector for ServiceNow in the ServiceNow Store or your ServiceNow environment. Confirm that it is compatible with your version (San Diego, Rome, or Quebec) and note the pricing if applicable ($795.00 per month). Review the product details and documentation as needed.
Open the Data Sources section
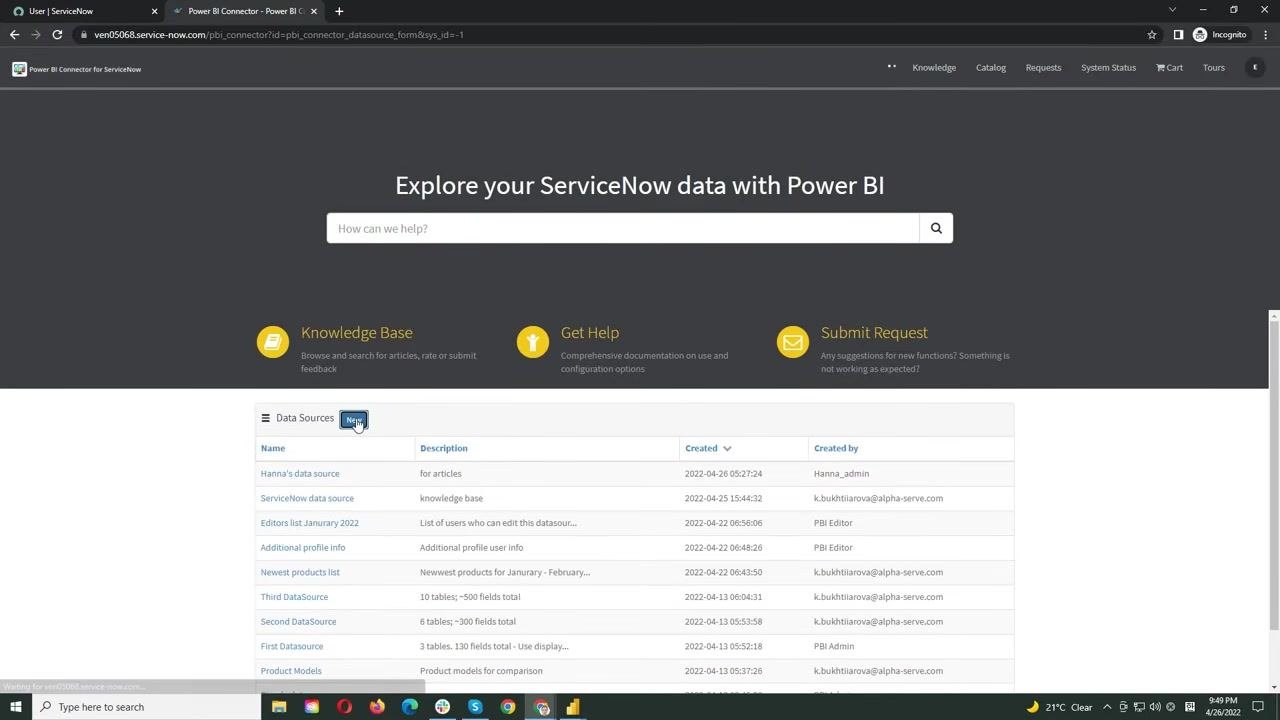
In the Power BI Connector interface, go to the Data Sources section and click the New button to create a new data source.
Configure the data source details
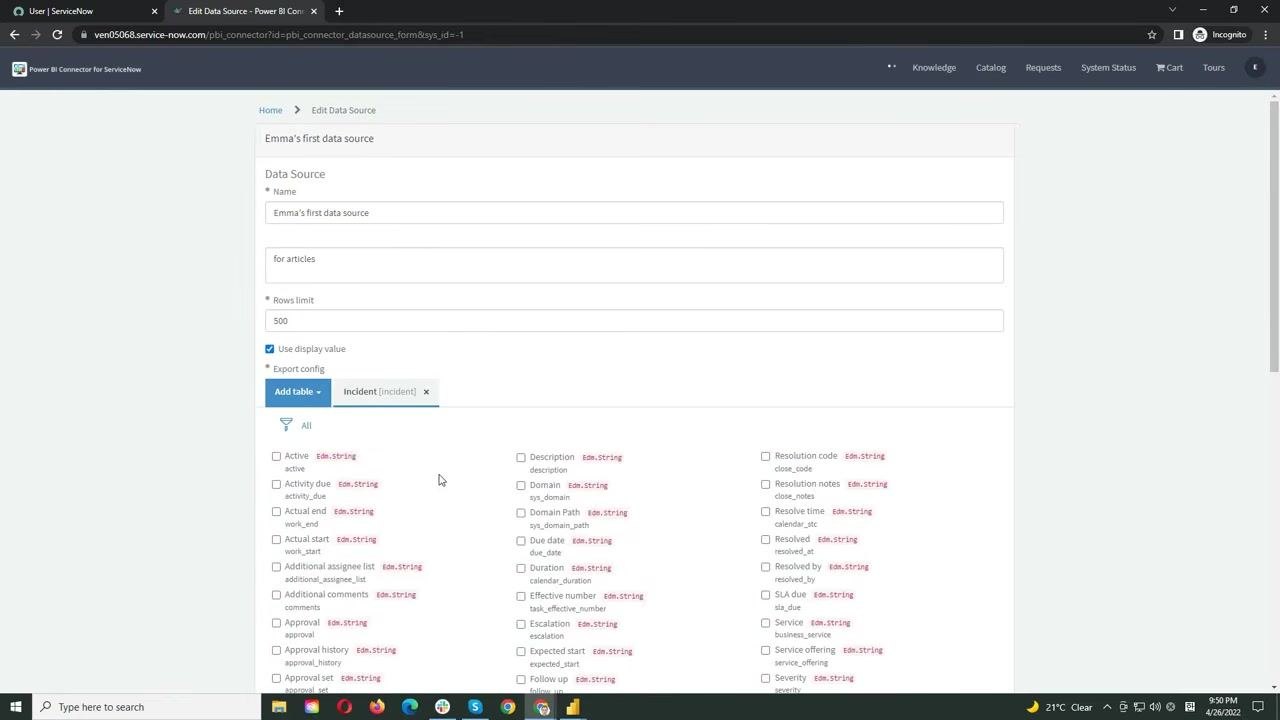
Enter a name for your data source, such as "Emma's first data source," and optionally add a description like "for articles." Set the Rows limit according to your data needs (for example, 500 or 5000). Check the Use display value option if you want data descriptions to be fully displayed.
Add tables to export
Click the Add table button, then start typing the name of the table you want to add, such as "Incident." Select the desired table from the suggestions. You can add multiple tables as needed.
Select fields for export
For each table, select the fields required for your Power BI report by checking the boxes next to the relevant fields, such as Active, Description, Domain, and Resolution code.
Apply filtering conditions
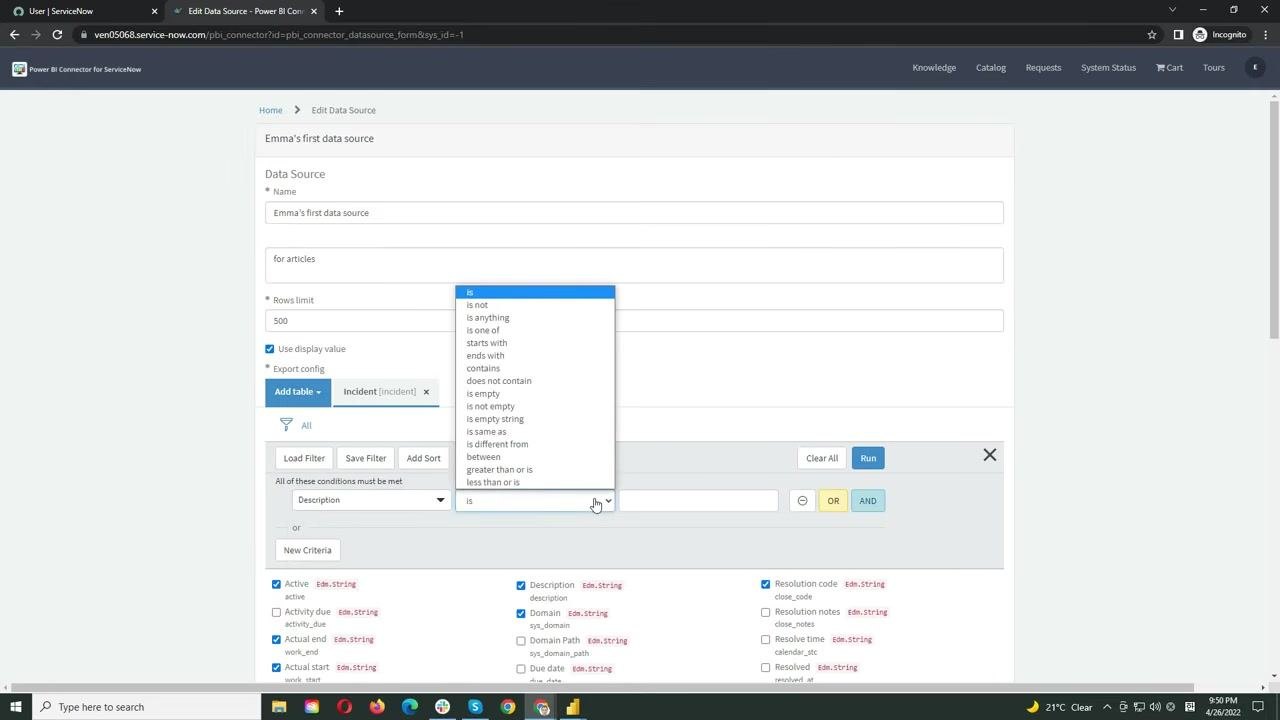
Use the filtering option to refine your data export. Click the filter icon and set conditions, such as filtering by Description with operators like is, is not, contains, or is empty. You can combine multiple criteria using AND/OR logic as needed.
Save the data source
Scroll down and click the Save button, or use Ctrl+S, to save your connector configuration. You now have a data source configured in the Power BI Connector for ServiceNow, ready for export and analysis in Power BI.
Copy the data feed URL
Click the Home link in the Power BI Connector for ServiceNow to return to the main menu. Locate and copy the data feed URL for your configured data source. You will use this URL to connect Power BI to your ServiceNow data.
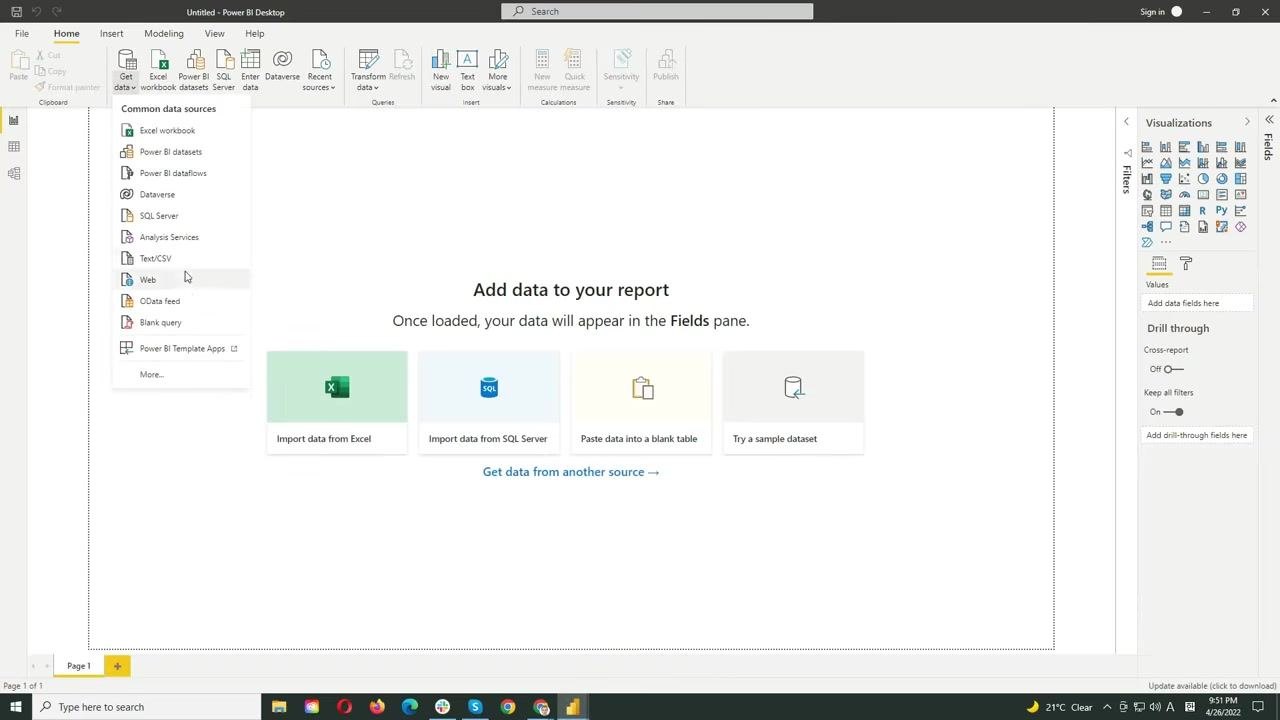
Get data from an OData feed in Power BI Desktop
Launch Power BI Desktop and click the Get data button on the Home ribbon. From the list of data sources, select OData feed, then paste the copied ServiceNow data feed URL into the OData feed dialog box.
Authenticate with ServiceNow
When prompted, enter your ServiceNow credentials using the Basic authentication tab to provide your username and password, then click Connect to proceed.
Select tables to import
After connecting, Power BI displays the tables you selected in your ServiceNow data source configuration. Choose the tables you want to import and click Load to bring the data into your Power BI workspace.
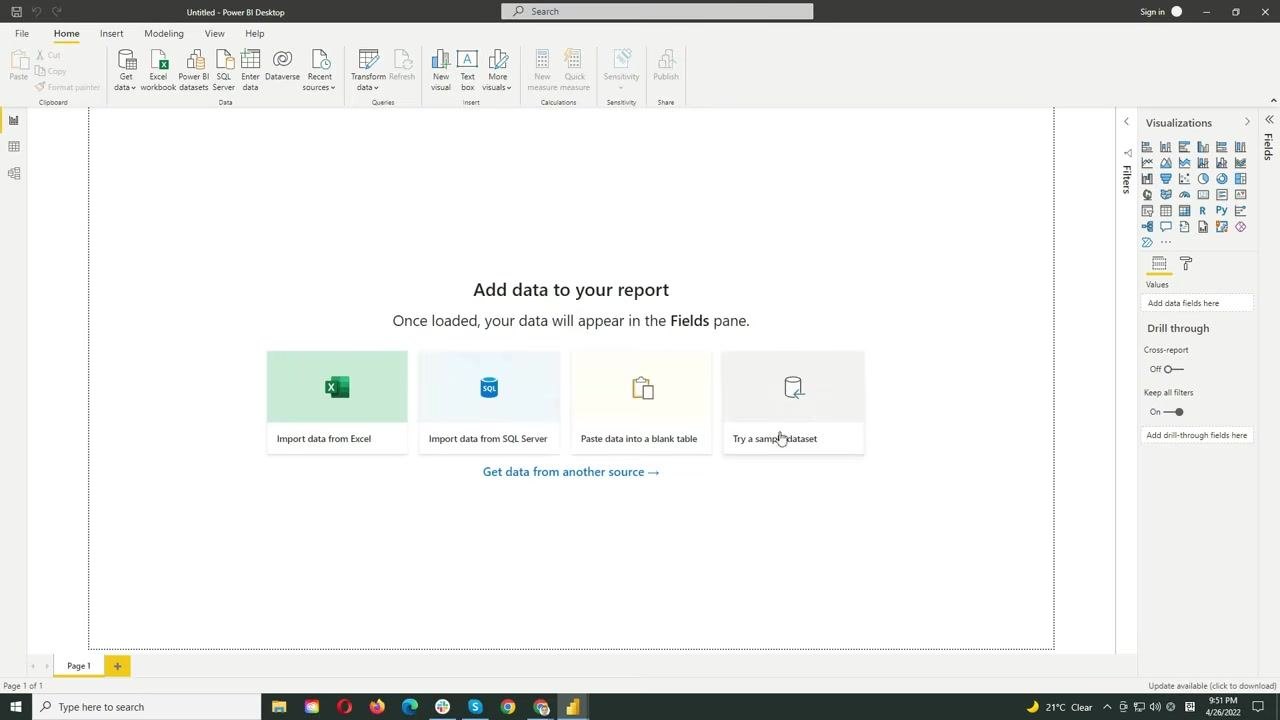
Wait for the data to load
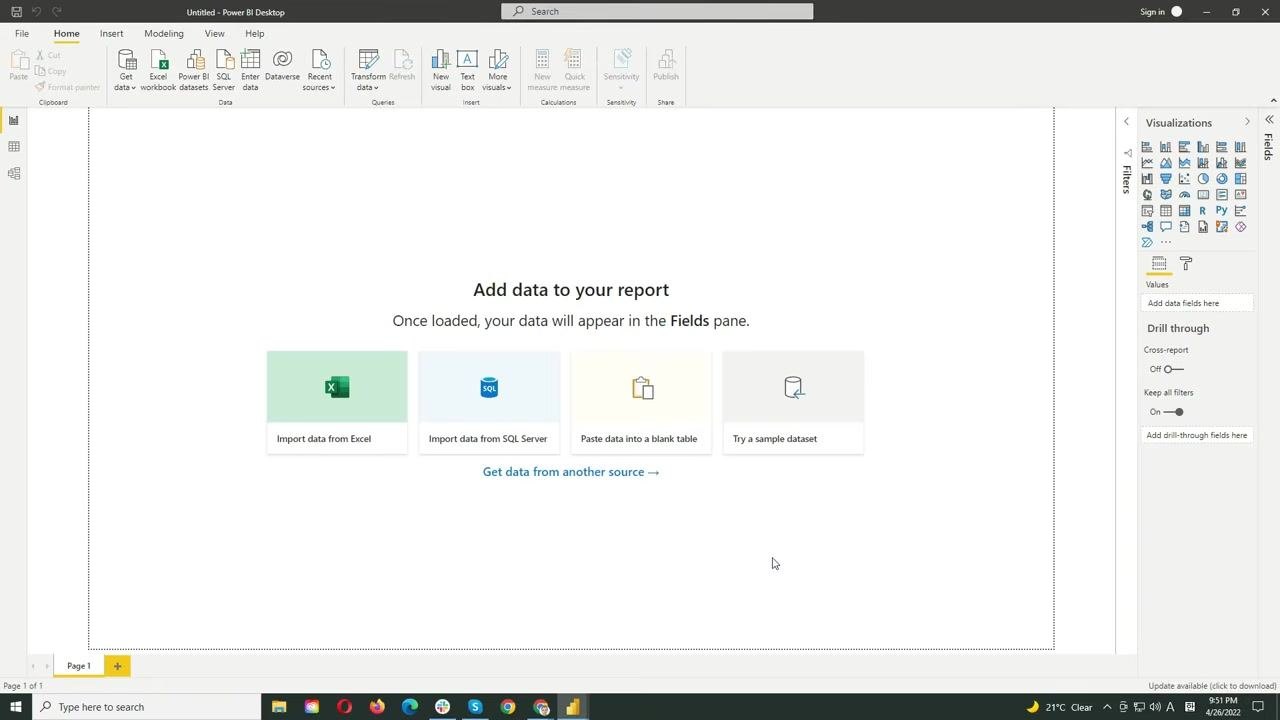
Allow a few seconds for Power BI to load your ServiceNow data. Once loaded, your tables and fields appear in the Fields pane on the right.
Build visualizations and reports
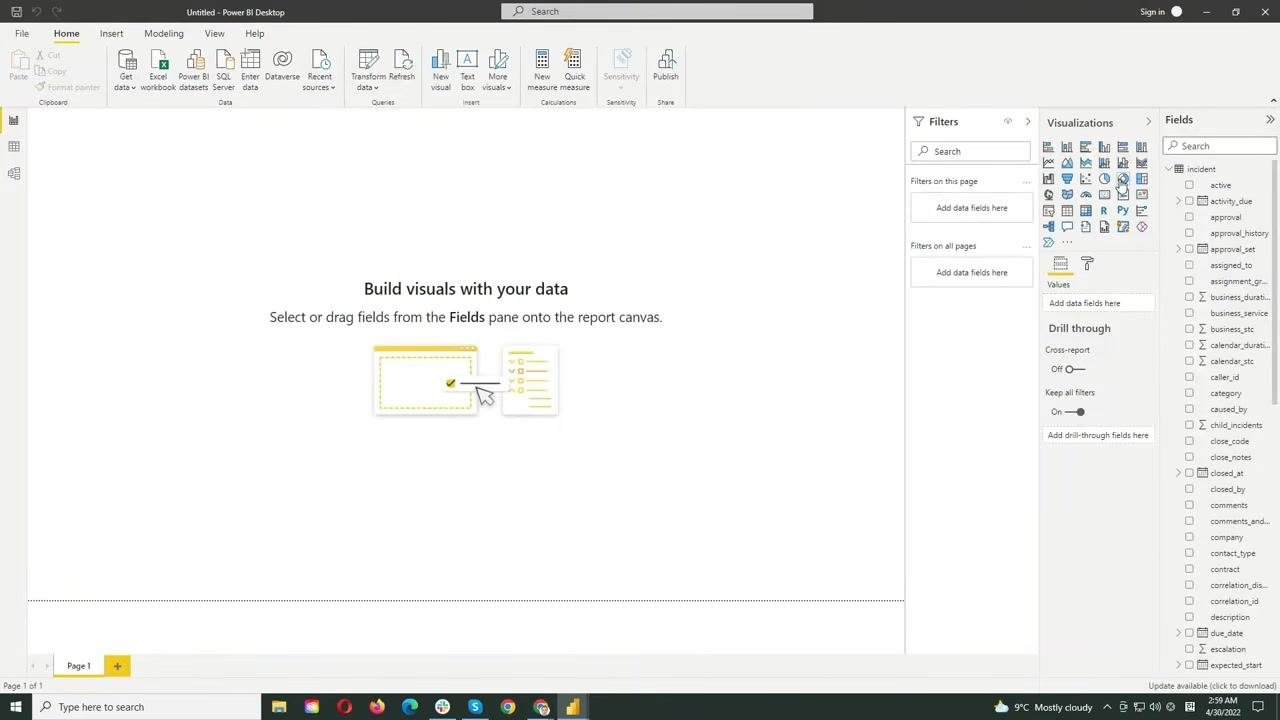
Select the visualization type you want to use from the Visualizations pane, such as a bar chart, pie chart, or table. Drag and drop relevant fields from the Fields pane onto the report canvas to build your report.
Customize and analyze your data
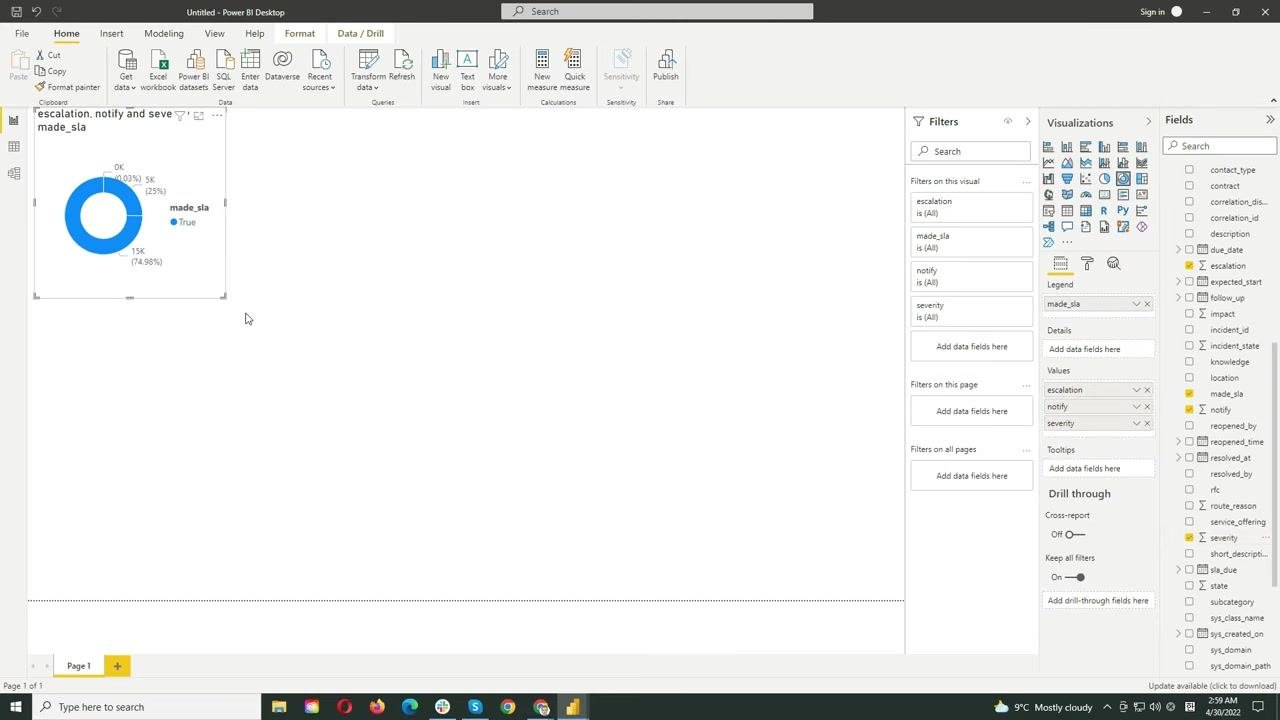
Continue adding and configuring visualizations as needed. Apply filters, adjust chart types, and organize your report layout for optimal analysis. For example, you can create a donut chart visualizing the "made_sla" field from your imported ServiceNow data.
What's next
You can try the Power BI Connector for ServiceNow for free via the ServiceNow Store. Visit the vendor's website at https://www.alphaservesp.com/products/servicenow/ for more information, documentation, and support.
Once connected, you can leverage the Power BI Connector for ServiceNow to explore and analyze your ServiceNow data directly within Power BI, using built-in visualizations such as bar charts and donut charts to gain insights from your imported data. If you encounter any issues or need assistance, refer to the support resources available on the vendor's website.
Generation details: cost, quality tiers
Docsie billed 2,000 credits ($1.40) to analyze this 4-minute video at standard quality. The rewrite, template fill and Word/PDF exports were included. The same video at each quality tier:
| Quality | Frames sampled | Credits | Approx. cost |
|---|---|---|---|
| Draft | every 16-30 s | 1,000 | $0.70 |
| Standard (this guide) | every 8-15 s | 2,000 | $1.40 |
| Detailed | every 4-7 s | 4,000 | $2.80 |
| Ultra | every 1-3 s | 8,000 | $5.60 |
Credits priced at $0.70 per 1,000; plans include a monthly allowance. Enterprise customers on on-premise or bring-your-own-model deployments run this on their own inference and pay no per-video credits.
Generated by Docsie Video-to-Docs on 2026-09-08 from a 3-minute video. Screenshots are frames from the source video and belong to their creator, Alpha Serve Channel, whose original is embedded above. If you own this video and want the guide removed or credited differently, contact us and we will act within one business day.