
How to Create a Dashboard in Oracle Fusion
This guide walks you through how to create a dashboard in Oracle Fusion using Oracle Transactional Business Intelligence (OTBI). You will explore an existing payables dashboard to understand its structure, review the underlying analyses, learn the difference between inline and dashboard prompts, and then build a new dashboard from scratch with unified, reusable prompts.
Video: Oracle Fusion OTBI For Beginners - Part 13 Your First Dashboard with Dashboard Prompts by Arun Raj (2021). All credit for the demonstration goes to the creator; watch the original on YouTube. The written guide below was generated from this video by Docsie. Creator? Request a change or removal.
This guide walks you through how to create a dashboard in Oracle Fusion using Oracle Transactional Business Intelligence (OTBI). You will explore an existing payables dashboard to understand its structure, review the underlying analyses, learn the difference between inline and dashboard prompts, and then build a new dashboard from scratch with unified, reusable prompts.
Prerequisites
- Access to Oracle BI Interactive Dashboards and the OTBI Catalog.
- Sufficient privileges to create and edit catalog objects (for example, System Administrator access).
- Existing analyses saved in a shared folder (for example,
/Shared Folders/Custom/Financials/DB/V2).
Explore the existing OIC Payables Dashboard
Open the OIC Payables Dashboard
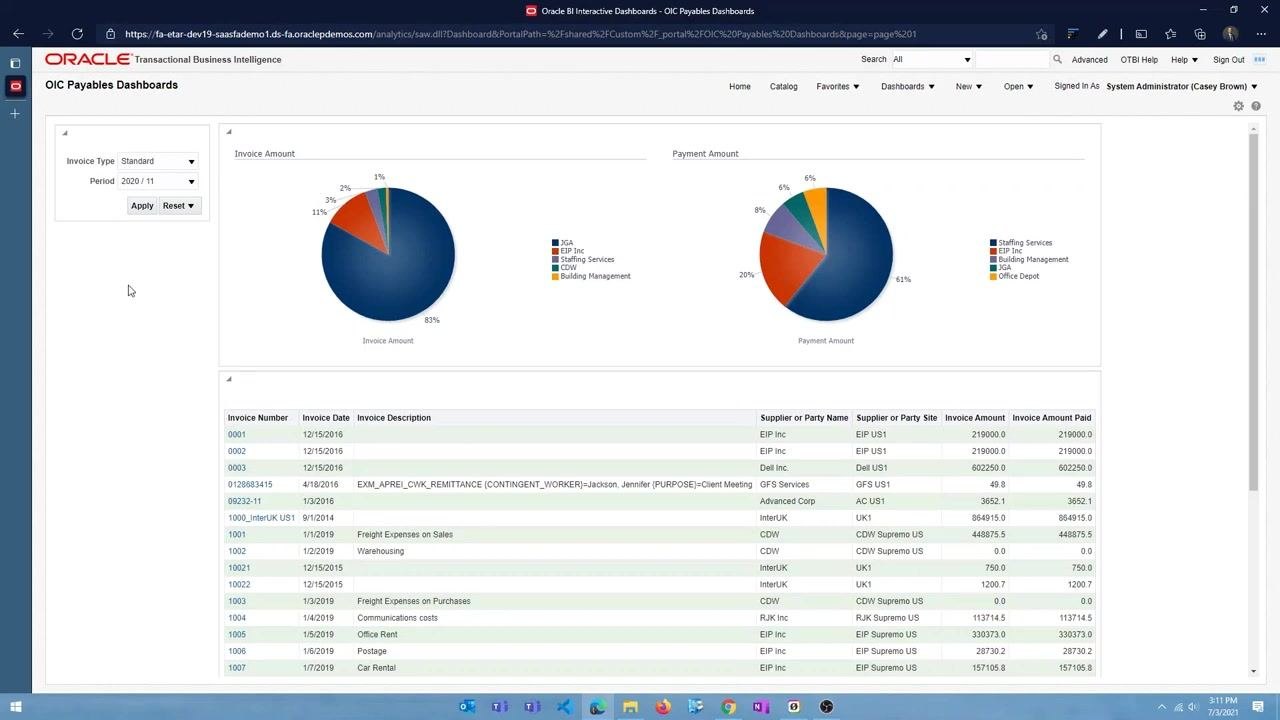
Open Oracle BI Interactive Dashboards and navigate to the OIC Payables Dashboards page to view the sample dashboard you will use as a reference.
Understand the dashboard components
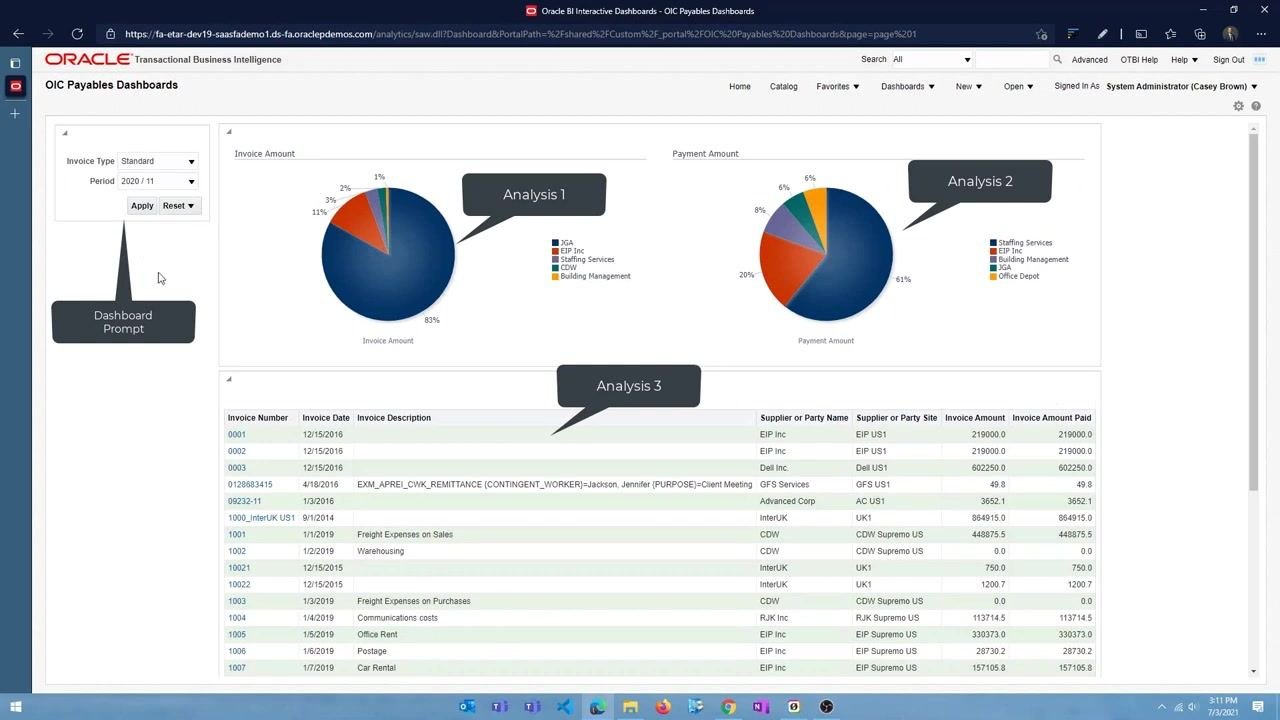
The dashboard is made up of several areas that work together:
- The dashboard prompt on the left lets you filter the data displayed across all analyses.
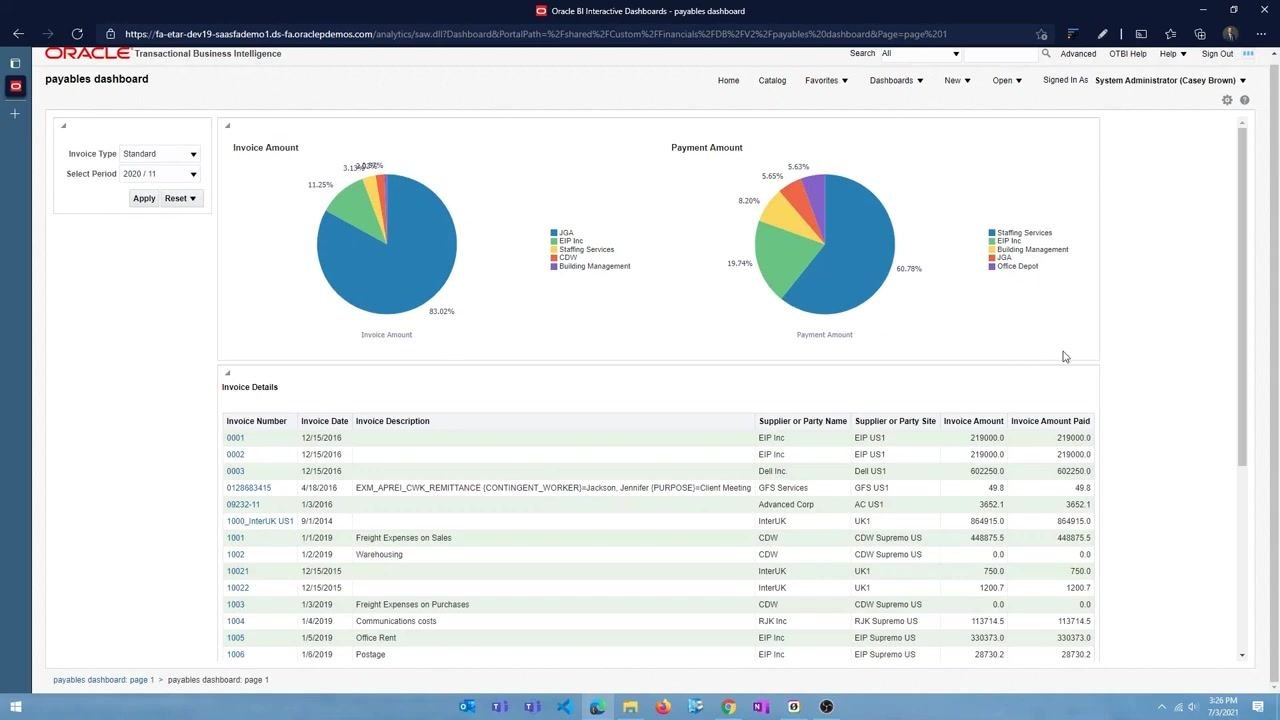
- Analysis 1 is a pie chart showing Invoice Amount by category (for example, JCA, EIP Inc, Staffing Services, COW, Building Management).
- Analysis 2 is a pie chart showing Payment Amount by category (for example, Staffing Services, EIP Inc, Building Management, JCA, Office Depot).
- Analysis 3 is a tabular section providing detailed invoice data.
Filter the dashboard data
- Select a value for Invoice Type (for example, "Standard").
- Select a value for Period (for example, "2020/11").
- Click Apply to filter the data across all analyses on the dashboard.
- Click Reset to clear the filters and return to the default view.
Review the individual OTB analyses
The dashboard is built from three Out-of-the-Box (OTB) analyses: one for invoices, one for payments, and one for invoice details. To view or edit one of them, click Edit next to the desired analysis (for example, "AP Invoices by Period"). The analysis editor opens, showing the criteria and filters applied.
In the analysis criteria, the selected columns are Supplier or Party Name and Invoice Amount. The filter section shows that Calendar Month Code is prompted, meaning the analysis uses the value entered by the user in the dashboard prompt for the period. This is what allows the dashboard to dynamically filter data based on user input.
View the structure of other analyses
Navigate back to the OTBI Catalog. You'll notice that "AP Payments by Periods" and "Invoice Details" are listed alongside "AP Invoices by Period," each with a similar prompt structure.
Open the "Invoice Details" analysis and go to the Prompts tab. Notice the prompt for Invoice Type Name, which lets you filter invoice details by type.
Understand inline prompts versus dashboard prompts
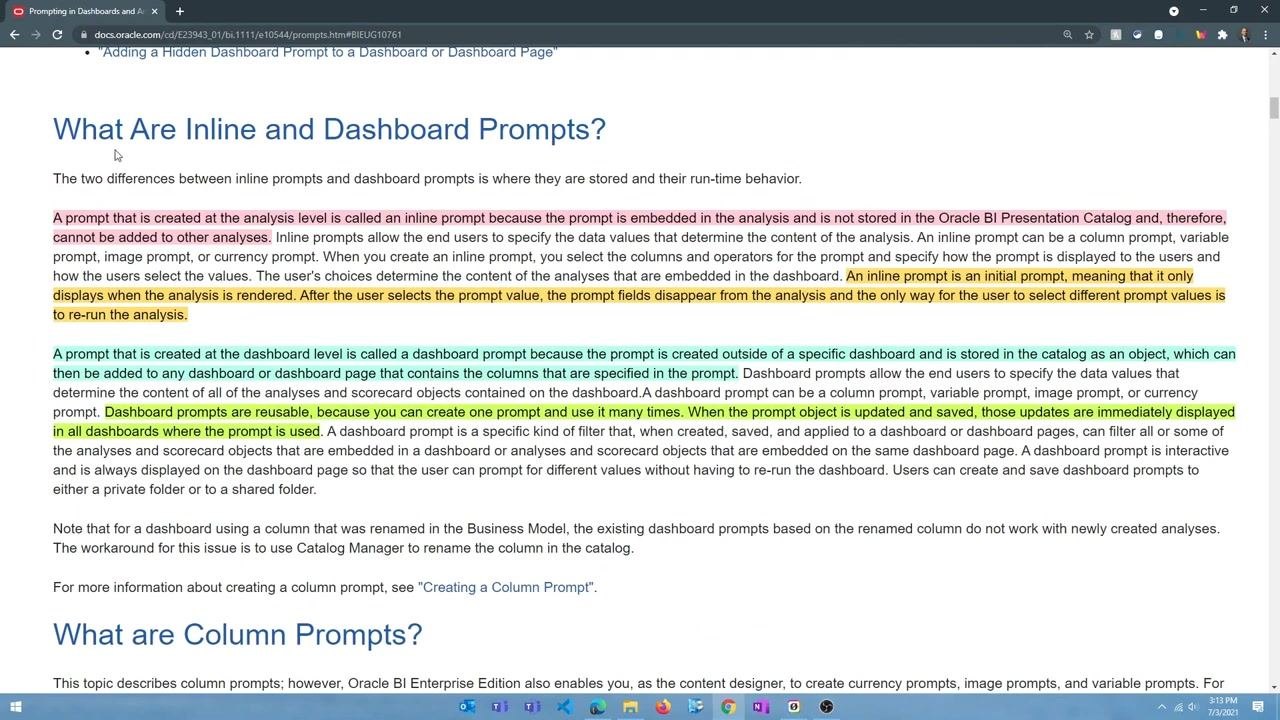
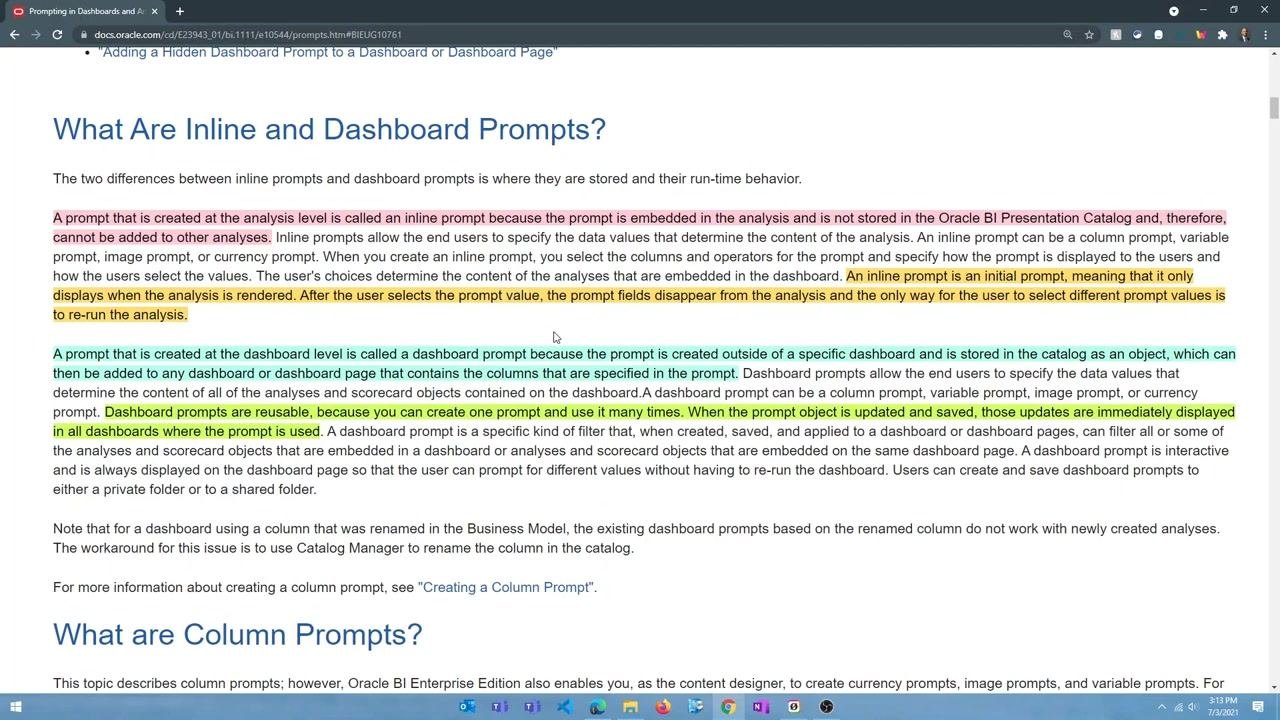
Before building a new dashboard, it helps to understand the two types of prompts available in Oracle BI:
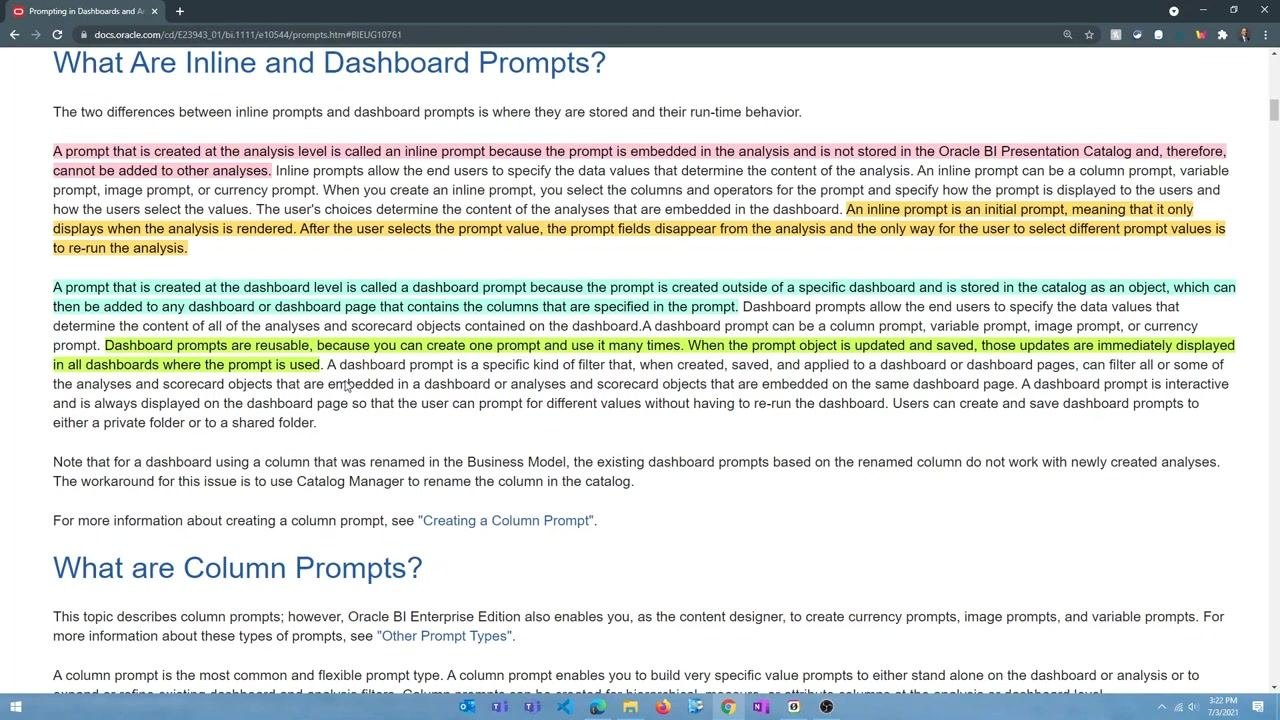
- Inline prompt – Created at the analysis level and embedded in that analysis. It is not stored in the Oracle BI Presentation Catalog, so it cannot be reused or shared with other analyses. It only appears when the analysis runs; once you select a value, the prompt disappears and the analysis renders. To change the value, you must re-run the analysis.
- Dashboard prompt – Created at the dashboard level and stored in the catalog as a reusable object. It can be used across multiple dashboards and analyses. When you update and save the prompt object, the changes appear immediately wherever that prompt is used.
Create a new dashboard
Open the OTBI Catalog
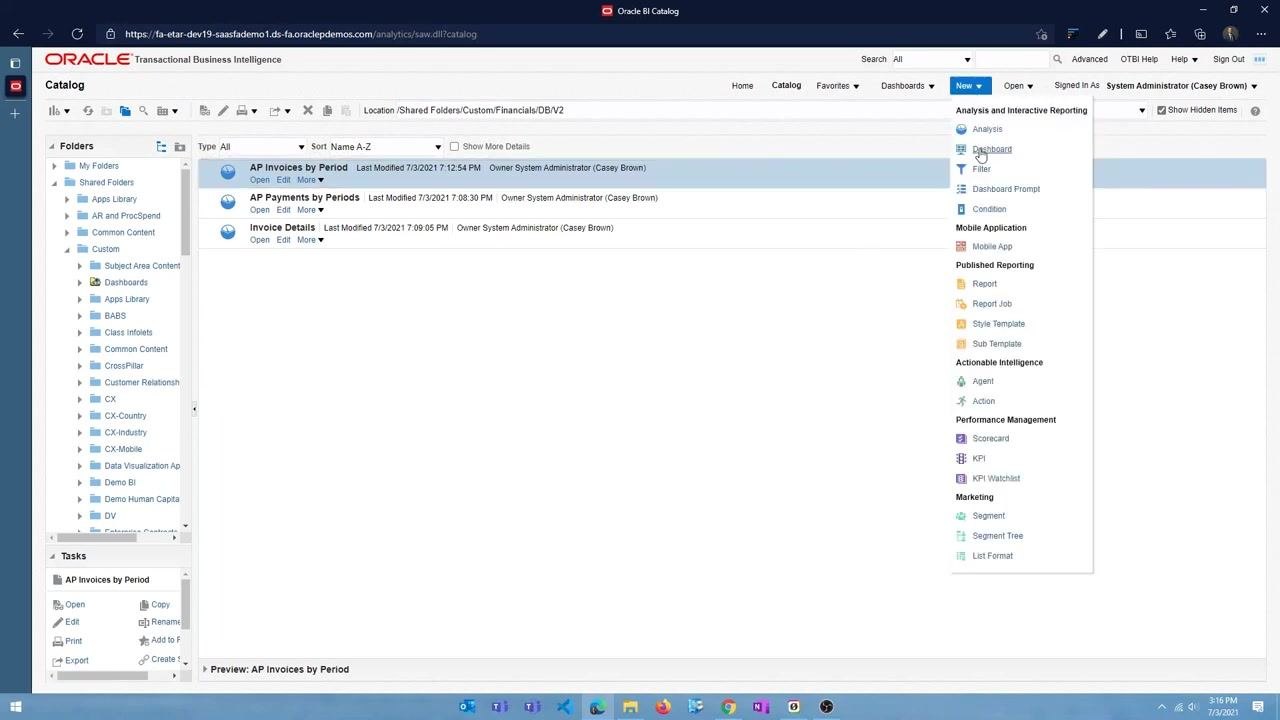
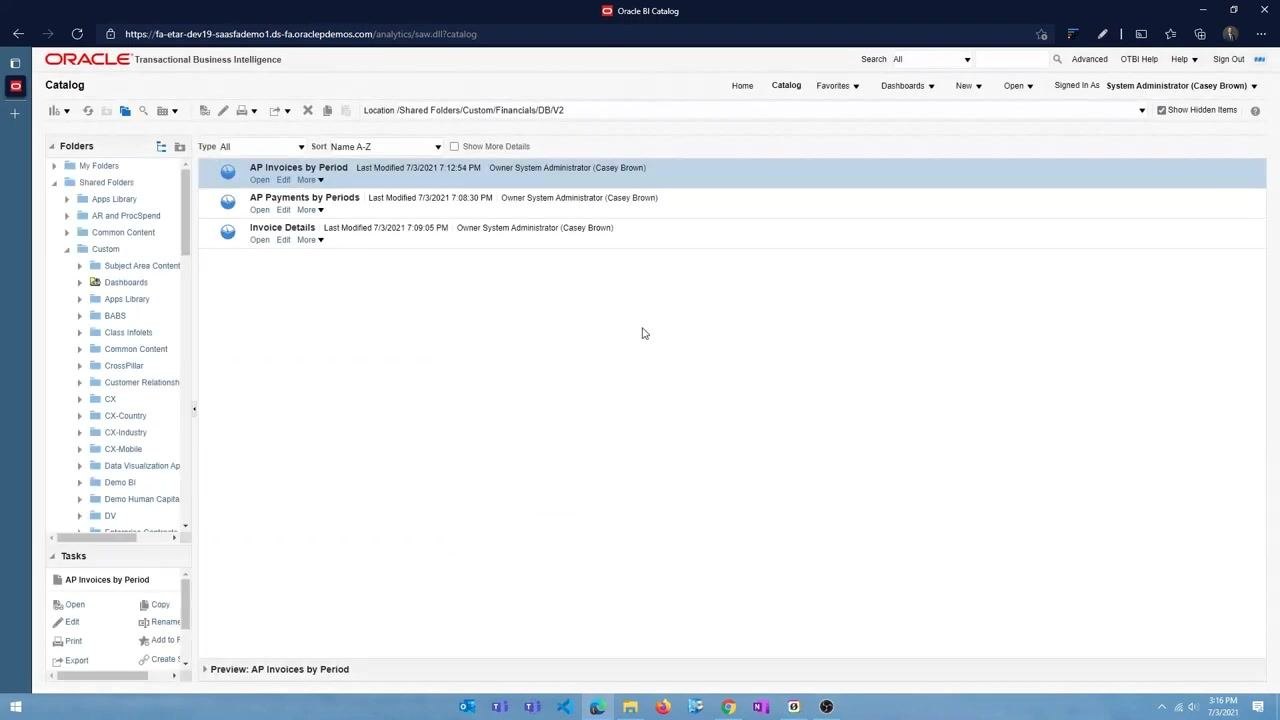
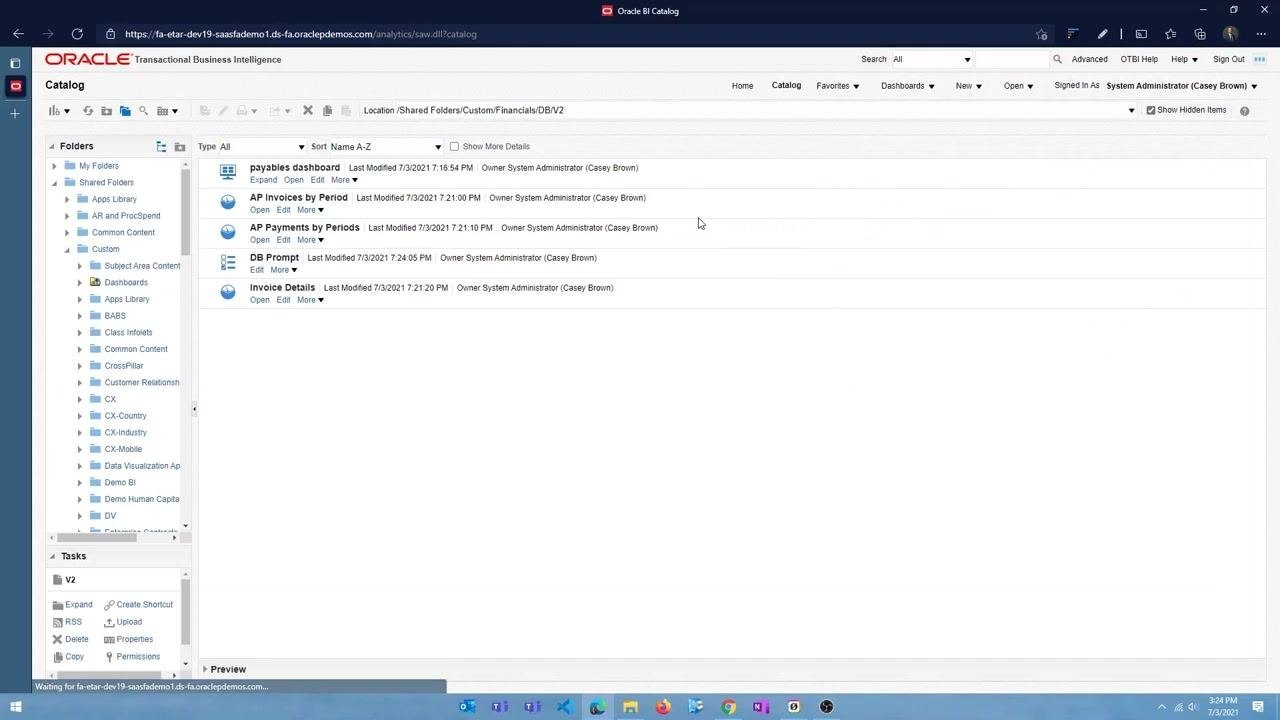
Open Oracle Transactional Business Intelligence and navigate to the Catalog, signed in as a user with sufficient privileges (for example, System Administrator). The Catalog screen displays folders and saved analyses such as "AP Invoices by Period," "AP Payments by Periods," and "Invoice Details," located at /Shared Folders/Custom/Financials/DB/V2.
Start a new dashboard
Locate the New dropdown menu in the top menu bar and click it to reveal the available creation options. Select Dashboard from the list to begin creating your new dashboard. This is the starting point for how to create a dashboard in Oracle Fusion from the Catalog view.
Prepare the dashboard layout
Drag and drop a Column, and then a Section, from the Dashboard Objects panel on the left into the dashboard workspace. You add content to a section by dragging analyses from the Catalog into it.
Add an analysis to the dashboard
Select the analysis you want (for example, "AP Invoices by Period") and drag it into the Drop Content Here area of the dashboard section.
Change the section alignment to horizontal
At the section level, open the section properties and change the layout property from Vertical to Horizontal. Verify that the analyses within the section now sit side by side, from left to right.
Add another analysis to the dashboard
Drag and drop the "Invoice Details" analysis into the dashboard. A new section is created automatically for this analysis, and it is placed within that section.
Run the dashboard to view inline prompts
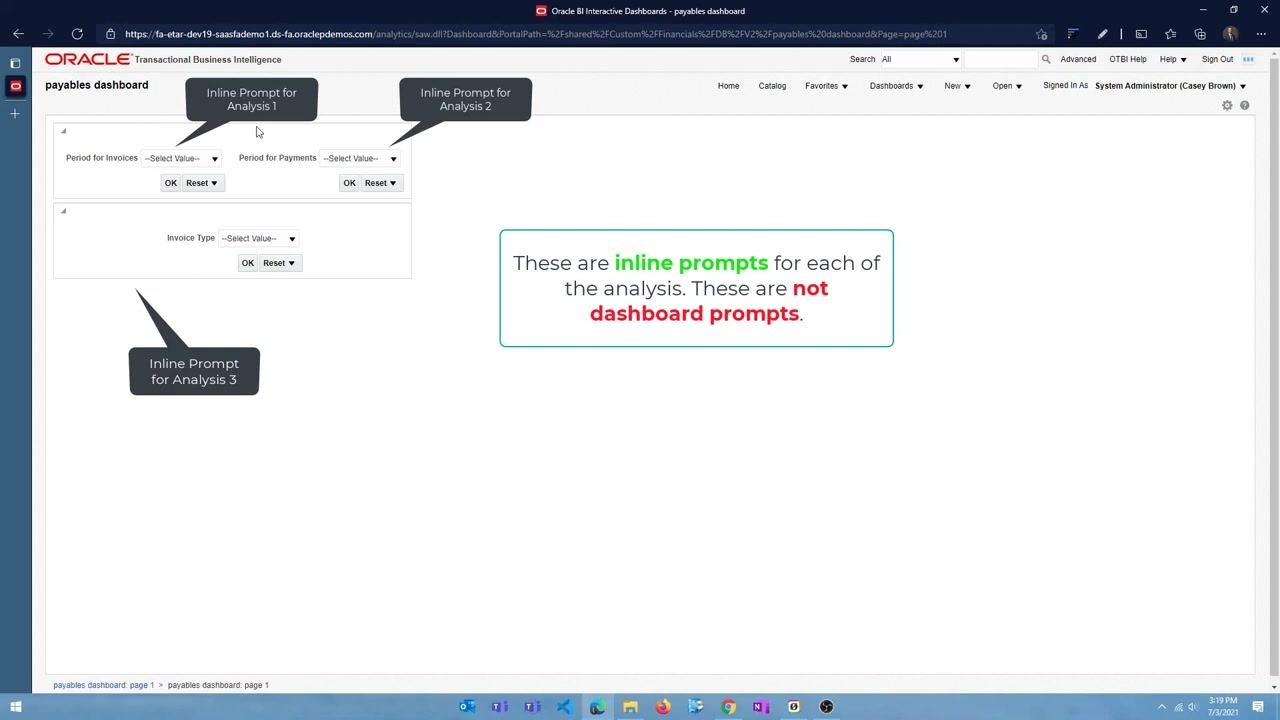
Click Run or Preview to execute the dashboard. The dashboard displays inline prompts for each analysis, letting you filter data for each one individually. These are inline prompts specific to each analysis, not dashboard-level prompts.
Understand the limitation of inline prompts
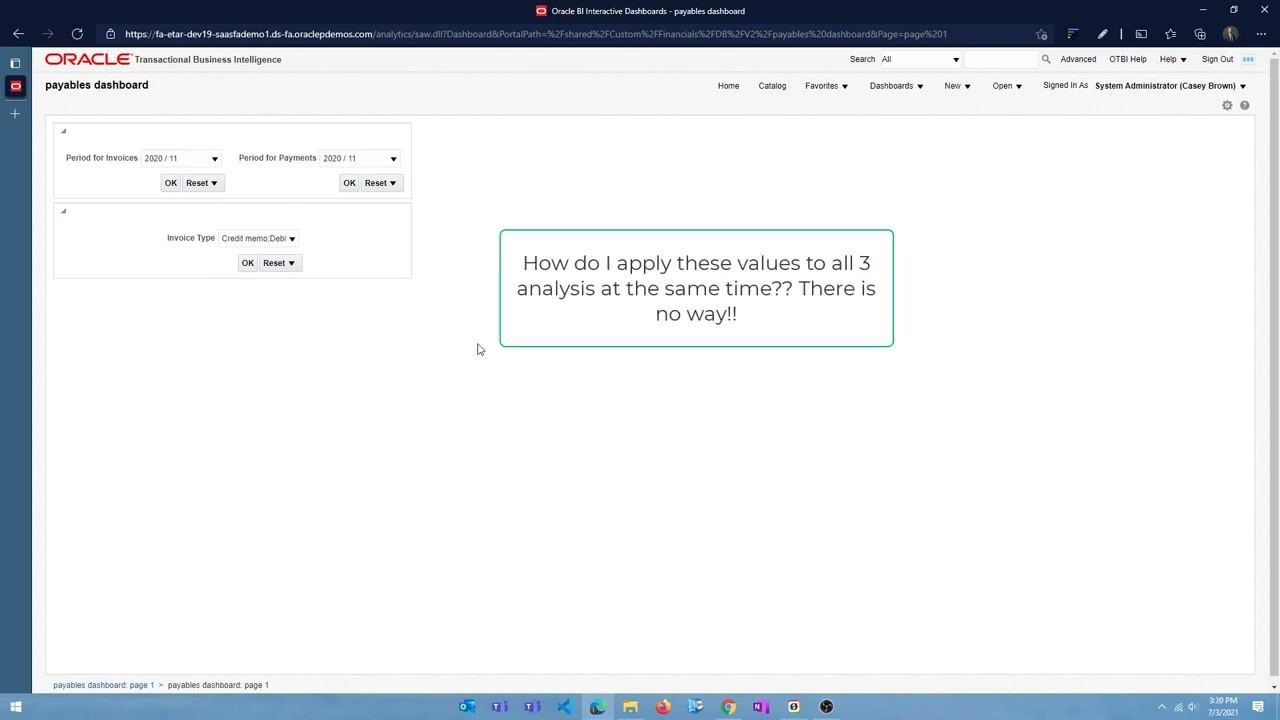
At this stage, the dashboard displays three separate inline prompts: "Period for Invoices," "Period for Payments," and "Invoice Type," each labeled as an inline prompt for its corresponding analysis. Each analysis requires its own prompt values to be set individually.
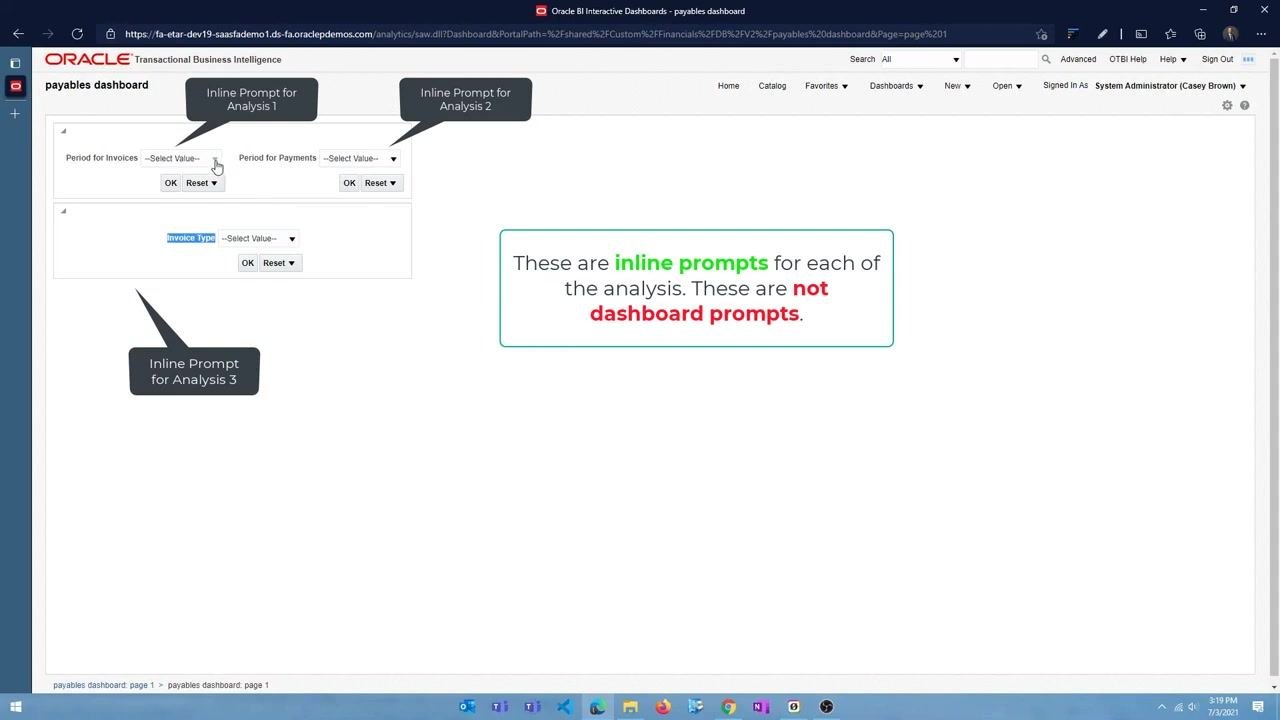
After selecting values for all three prompts, there is no unified way to apply those values to all analyses at the same time — each one must be set and applied individually.
Remove inline prompts from your analyses
To enable unified filtering, you need to remove the inline prompts and replace them with dashboard prompts.
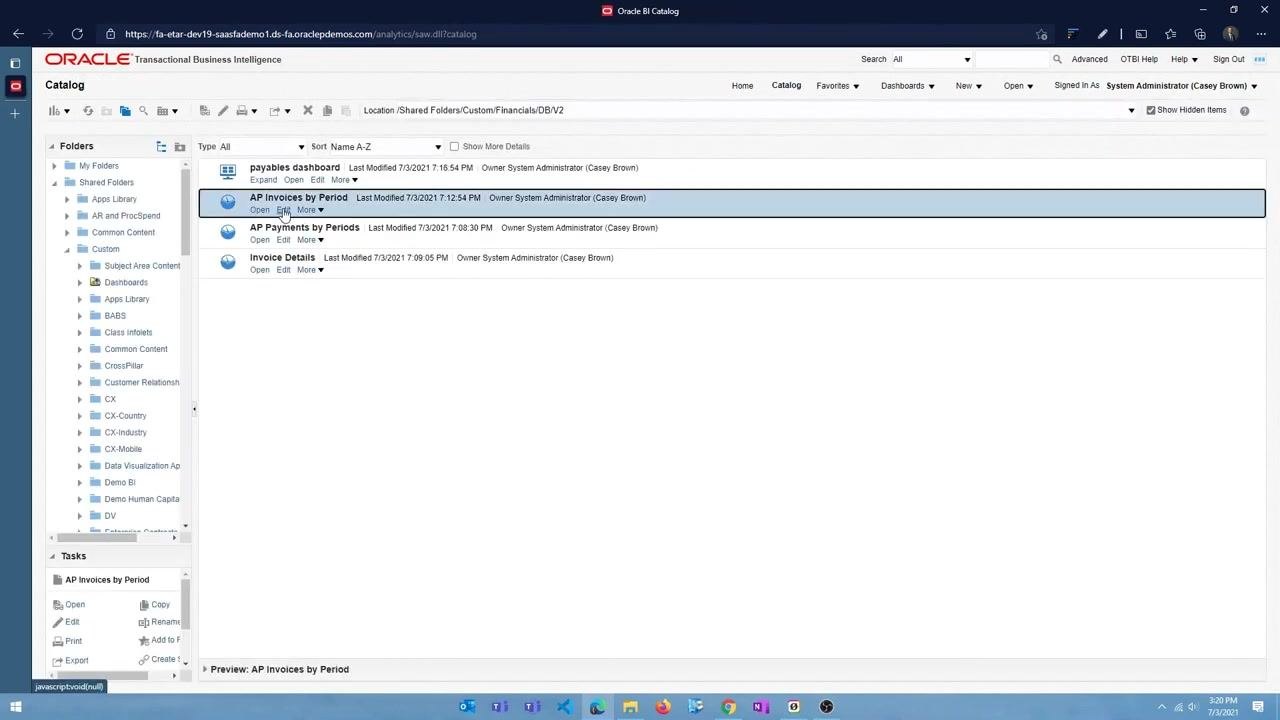
Return to the Catalog view and locate each analysis ("AP Invoices by Period," "AP Payments by Periods," "Invoice Details") in the folder /Shared Folders/Custom/Financials/DB/V2. For each one, select Edit to open it for modification.
Confirm the inline prompts are removed
After editing, confirm that the inline prompts are removed from each analysis and that the analyses no longer contain individual prompt sections.
Verify in the Catalog that all three analyses have been updated and saved without inline prompts.
Create and configure dashboard prompts
Start creating a dashboard prompt
Return to the OTBI Catalog interface and navigate to /Shared Folders/Custom/Financials/DB/V2. Click the New button in the top menu bar, then select Dashboard Prompt under the Analysis and Interactive Reporting section.
Select the subject area
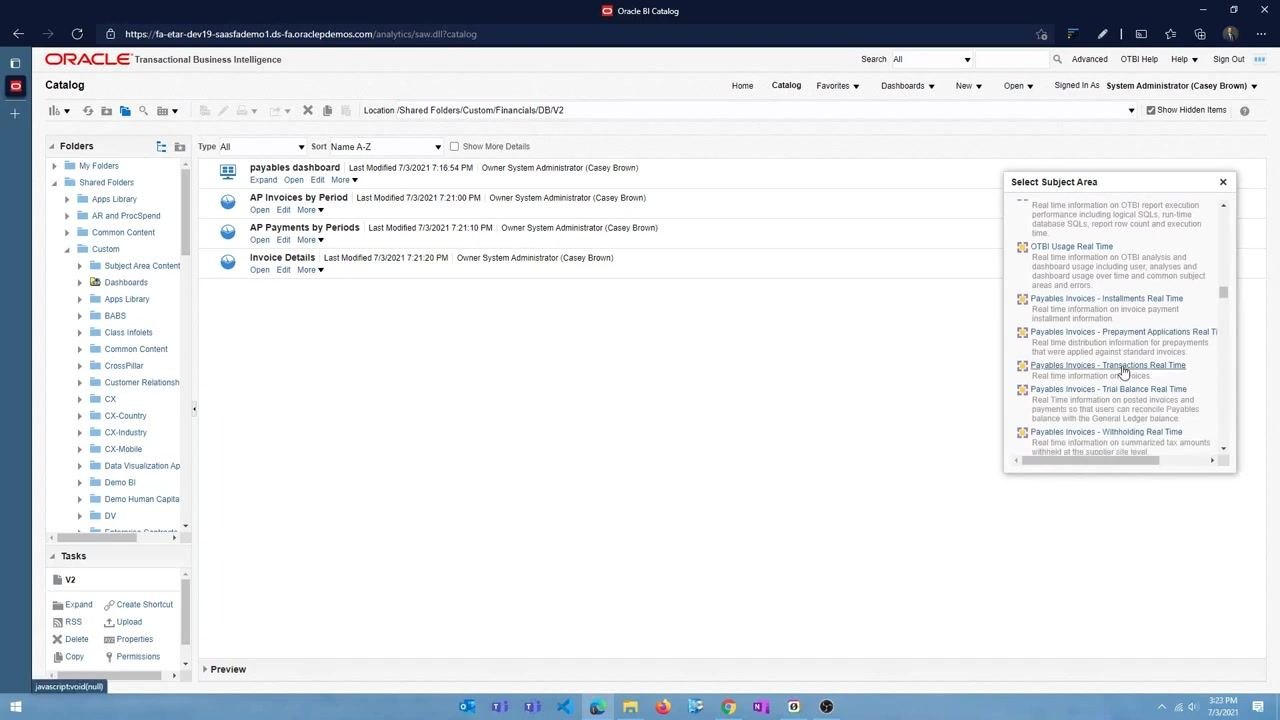
In the Select Subject Area dialog, scroll through the list and select Payables Invoices - Transactions Real Time. You will create two prompts based on this subject area.
Open the Dashboard Prompt editor
Navigate to the Oracle BI Answers interface and make sure you are on the Definition tab, where prompts are managed.
Add a column prompt for Invoice Type
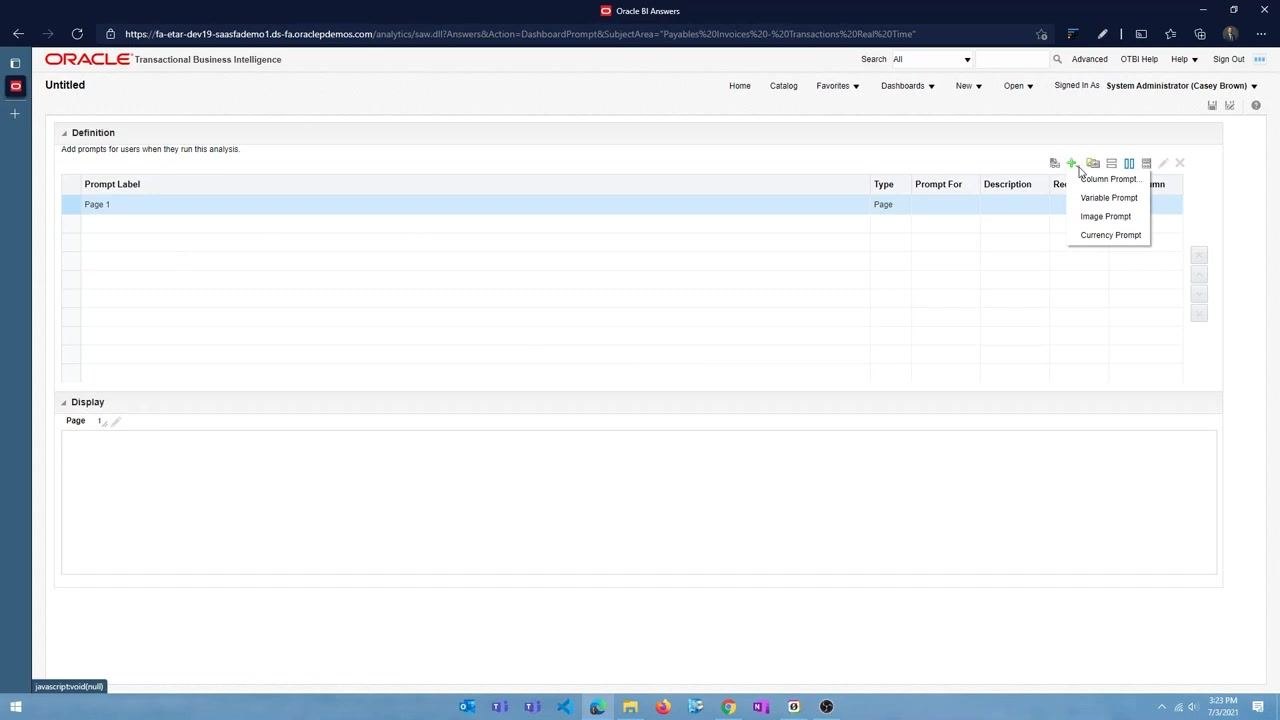
Click the green plus (+) icon and select Column Prompt from the dropdown menu. This lets you add a new prompt based on a specific data column.
In the Select Column dialog that appears, expand the folders to find the invoice type column by navigating to Payables Invoices - Transactions Real Time > Invoice Details > General Information. Select the relevant column and click OK to confirm.
Configure the Invoice Type prompt
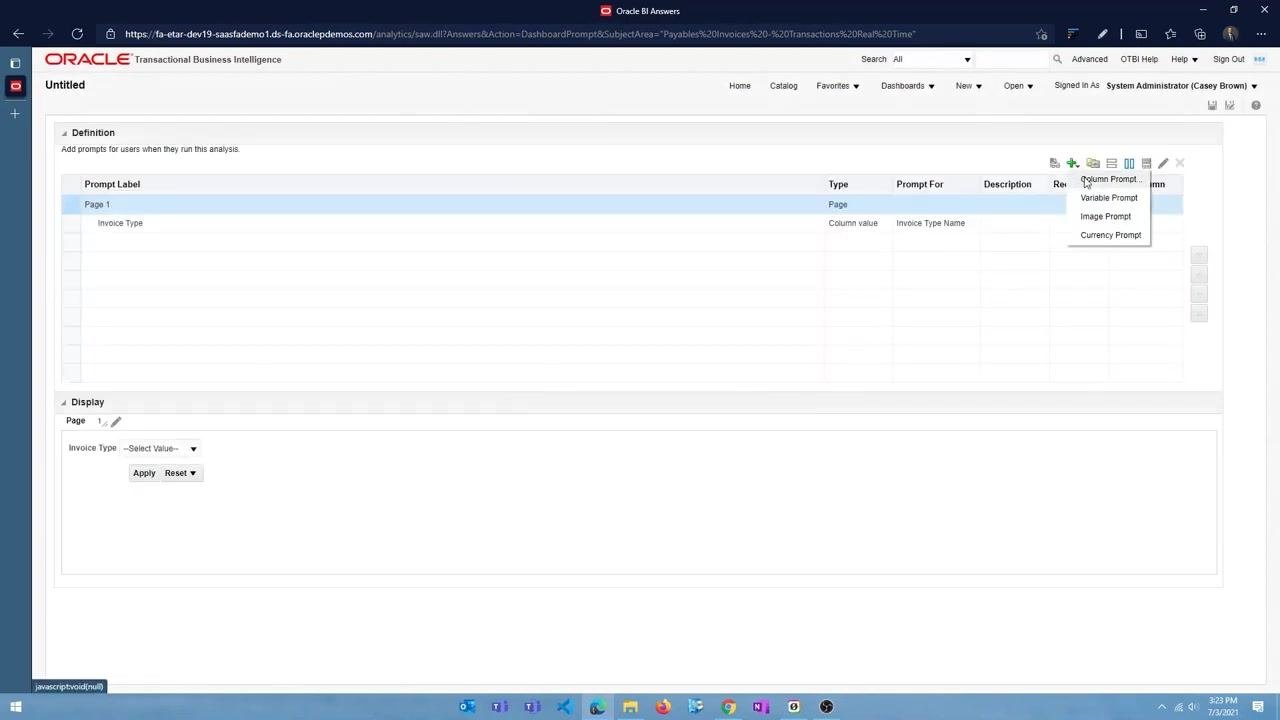
In the prompt list, a new entry labeled "Invoice Type" appears, with Type set to "Column value" and Prompt For set to "Invoice Type Name." In the Display section, an "Invoice Type" dropdown appears, allowing users to select a value.
Add a column prompt for period selection
Click the green plus (+) icon again and select Column Prompt. In the column selection dialog, expand the "Time" folder and select Calendar Month Code as the column. Click OK to add the prompt.
Rename the prompts for clarity
Change the label of the first prompt to "Invoice Type" and the label of the second prompt to "Select Period." Confirm that both prompts are listed under Prompt Label with their respective columns:
- Invoice Type → Invoice Type Name
- Select Period → Calendar Month Code
In the Display section, confirm that both dropdowns ("Invoice Type" and "Select Period") are visible and that each one provides Apply and Reset buttons.
Save the dashboard prompt
Click the Save icon, enter the name "DB Prompt" for the prompt set, and save it in the appropriate folder.
Add the prompt to your dashboard
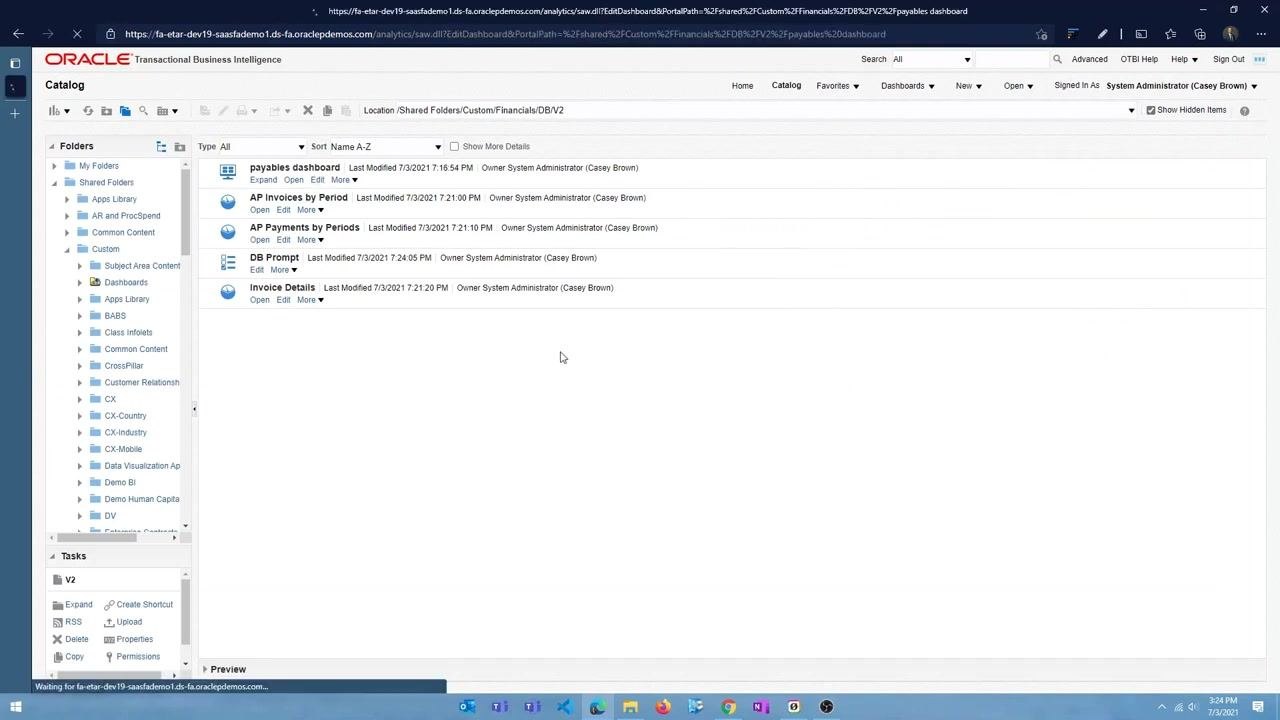
Navigate back to the Oracle BI Catalog and locate the newly saved "DB Prompt" in the folder /Shared Folders/Custom/Financials/DB/V2.
Open the dashboard you want to edit (for example, "payables dashboard") and enter editing mode.
Add a column for the prompt
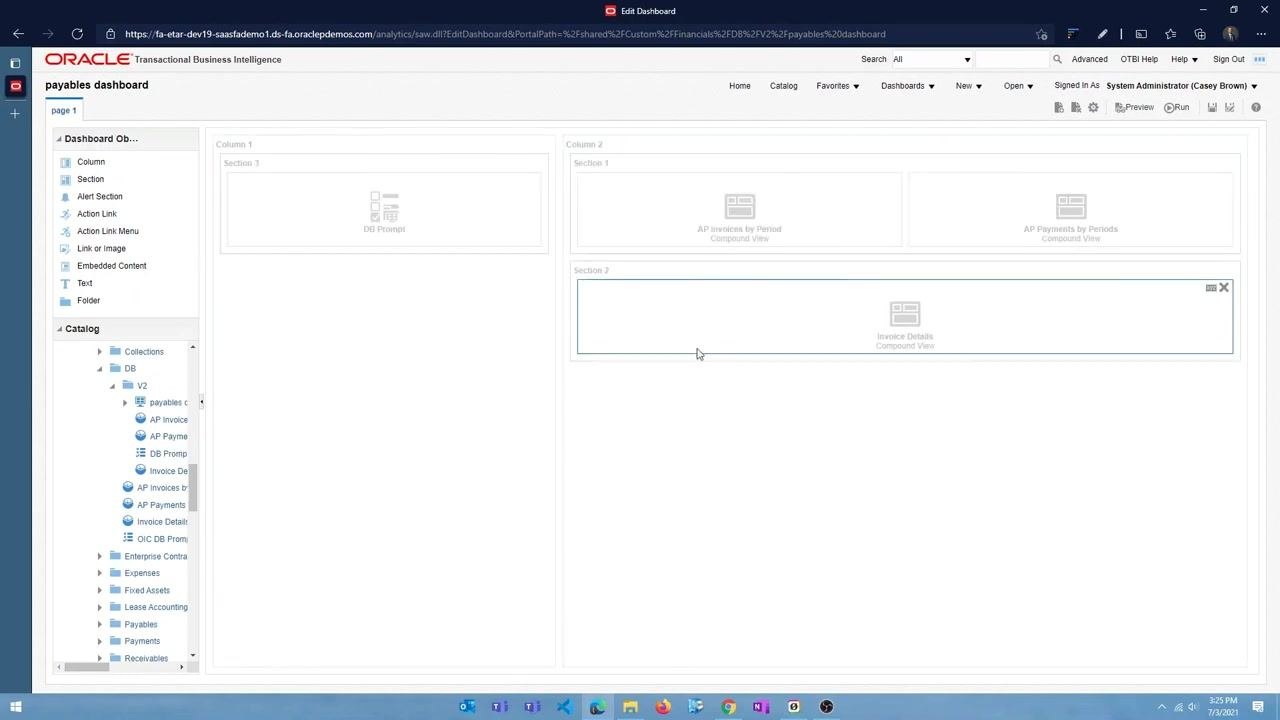
From the Dashboard Objects panel, drag a Column object to the left side of the dashboard layout. Release it when the left edge highlights in blue.
Insert the dashboard prompt
From the Catalog panel, locate the "DB Prompt" you saved earlier and drag it into the newly created column on the left side of the dashboard.
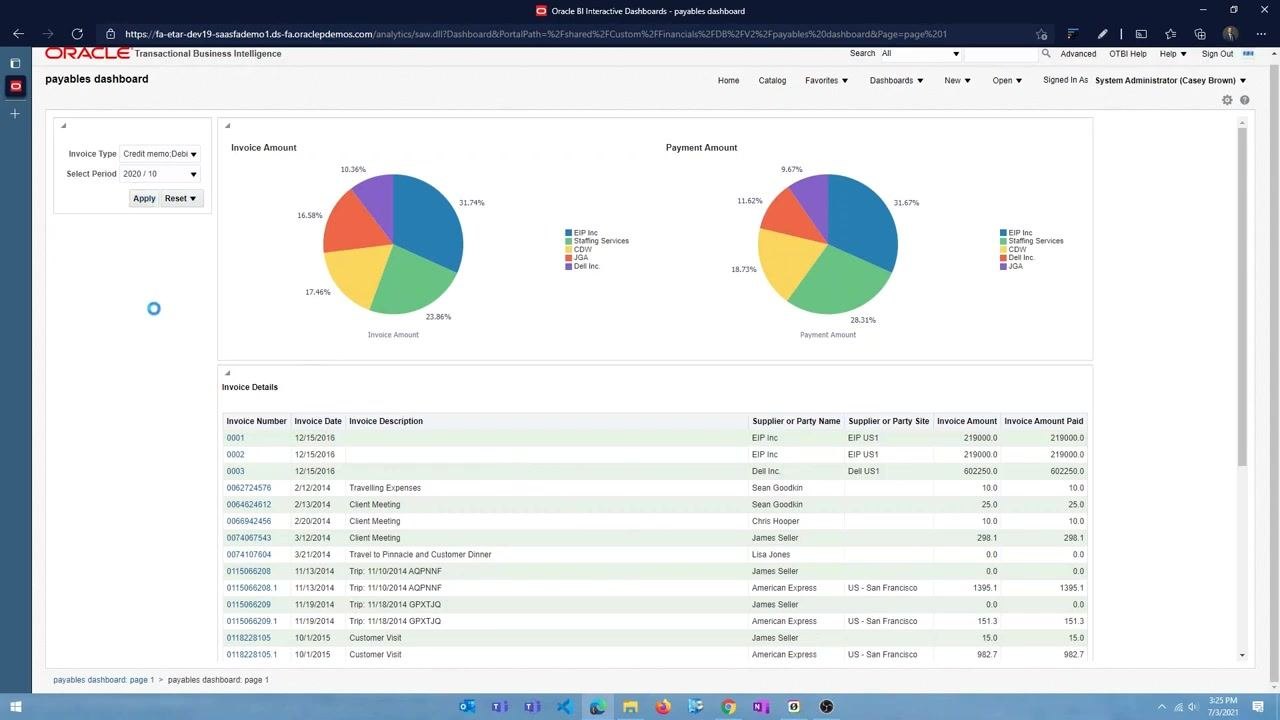
Confirm that the dashboard prompt panel appears on the left with two dropdowns — Invoice Type and Select Period — while the main dashboard area displays the two pie charts ("Invoice Amount" and "Payment Amount") and the "Invoice Details" table.
Use and test dashboard prompts
Select an invoice type
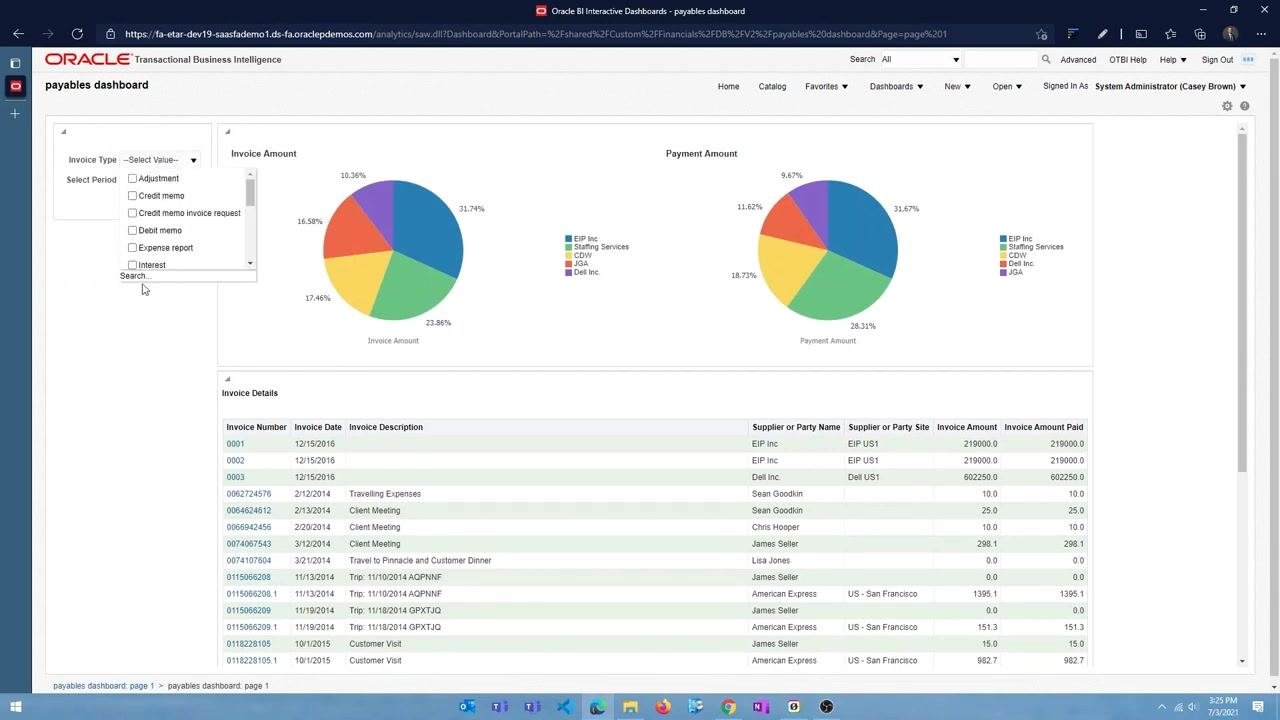
Click the Invoice Type dropdown. A list of available invoice types appears, including Adjustment, Credit memo, Credit memo invoice request, Debit memo, Expense report, and Interest. Select "Credit memo" from the list.
Select a period
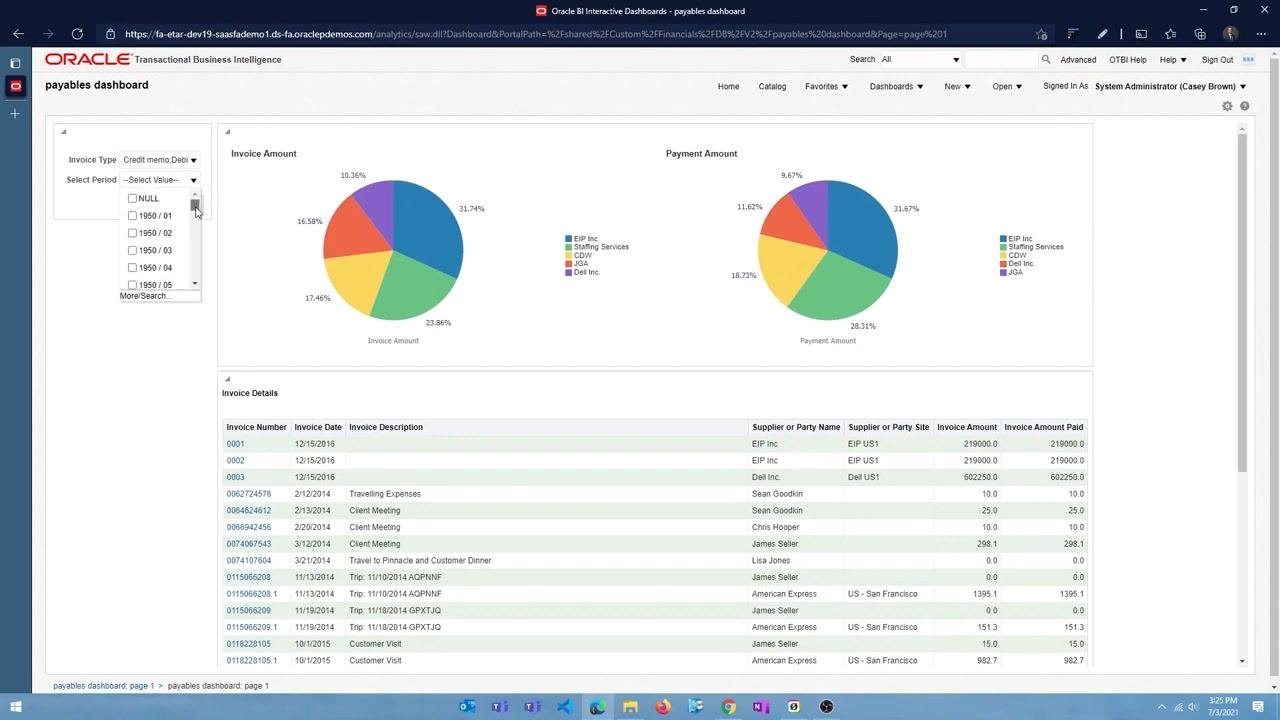
Click the Select Period dropdown. A list of available periods appears, such as NULL, 1950/01, 1950/02, 1950/03, 1950/04, and 1950/05, among others. Select the desired period, for example "2020/10." You can select multiple values if the prompt allows it.
Apply the filters
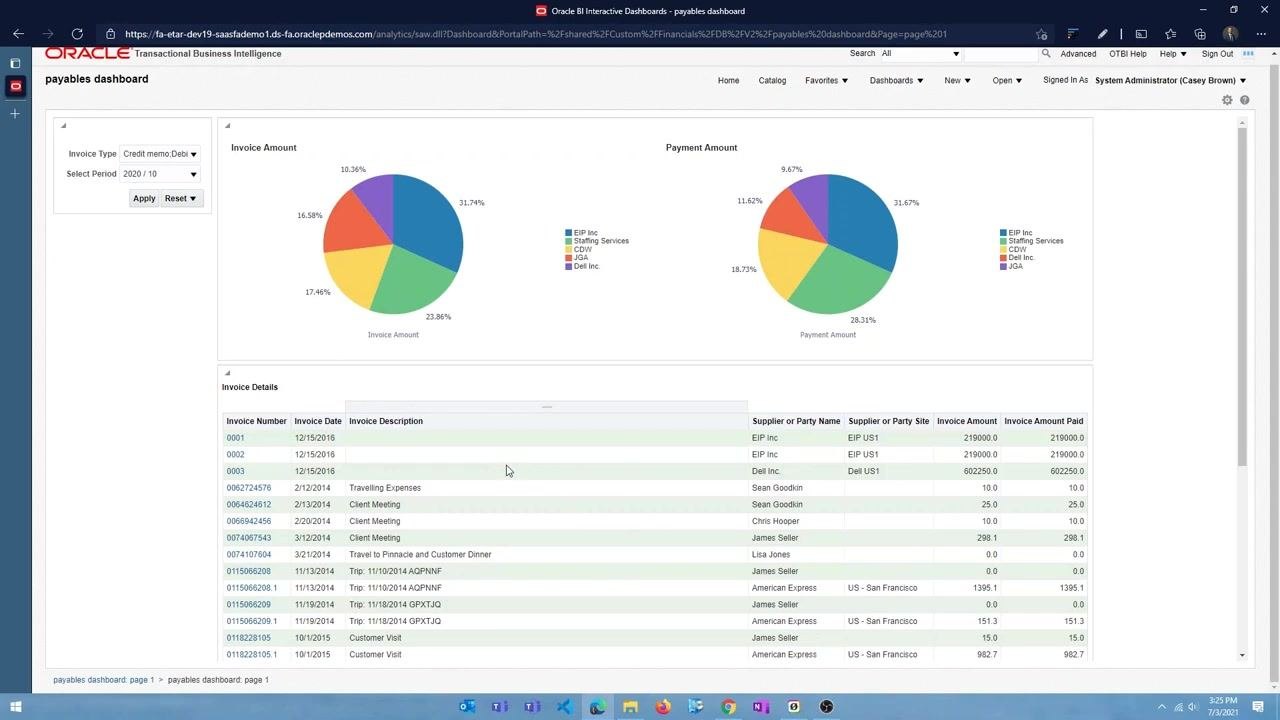
After selecting the desired values for both prompts, click Apply. The dashboard refreshes to display data filtered according to your selections, and all analysis views — charts and tables — update to reflect the applied filters.
As the dashboard refreshes, a loading indicator may appear briefly. Once the refresh completes, verify that the data in the charts and tables matches your selected filters.
Change prompt selections
To modify the filters, click the Invoice Type or Select Period dropdown again. Select a different value — for example, change "Invoice Type" to "Standard" and "Select Period" to "2020/11" — then click Apply to update the dashboard with the new selections.
After applying the new filters, review the updated charts and invoice details. The pie charts and invoice table now reflect the new filter criteria.
What's next
Now that you know how to create a dashboard in Oracle Fusion with reusable dashboard prompts, you can apply the same approach to other subject areas and analyses. Consider adding additional column prompts, organizing sections for different report types, or sharing your dashboard prompt across other dashboards that use the same underlying data.
Generation details: cost, quality tiers
Docsie billed 7,000 credits ($4.90) to analyze this 14-minute video at standard quality. The rewrite, template fill and Word/PDF exports were included. The same video at each quality tier:
| Quality | Frames sampled | Credits | Approx. cost |
|---|---|---|---|
| Draft | every 16-30 s | 3,500 | $2.45 |
| Standard (this guide) | every 8-15 s | 7,000 | $4.90 |
| Detailed | every 4-7 s | 14,000 | $9.80 |
| Ultra | every 1-3 s | 28,000 | $19.60 |
Credits priced at $0.70 per 1,000; plans include a monthly allowance. Enterprise customers on on-premise or bring-your-own-model deployments run this on their own inference and pay no per-video credits.
Generated by Docsie Video-to-Docs on 2026-10-14 from a 13-minute video. Screenshots are frames from the source video and belong to their creator, Arun Raj, whose original is embedded above. If you own this video and want the guide removed or credited differently, contact us and we will act within one business day.