
How to Do an Fmea
This procedure explains how to do an FMEA (Failure Mode and Effects Analysis) for a process or design, using a Bank ATM machine as the working example. It walks through preparation, team formation, scope definition, failure identification, risk scoring, and corrective action tracking so that you can complete an FMEA that is accurate, traceable, and audit-ready.
Video: FMEA with Example: Detailed illustration with a practical example by LEARN & APPLY : Lean and Six Sigma (2018). All credit for the demonstration goes to the creator; watch the original on YouTube. The written guide below was generated from this video by Docsie. Creator? Request a change or removal.
This procedure explains how to do an FMEA (Failure Mode and Effects Analysis) for a process or design, using a Bank ATM machine as the working example. It walks through preparation, team formation, scope definition, failure identification, risk scoring, and corrective action tracking so that you can complete an FMEA that is accurate, traceable, and audit-ready.
Scope
Before starting the FMEA, define what the analysis will cover.
- Determine whether the exercise is a Design FMEA or a Process FMEA.
- Decide if the analysis covers a concept, system, design, process, or service.
- Establish the boundaries of the analysis and the level of detail required.
- Use a flowchart to visually communicate the scope so every team member understands it in the same way.
For the worked example used throughout this guide, the FMEA scope is defined as follows:
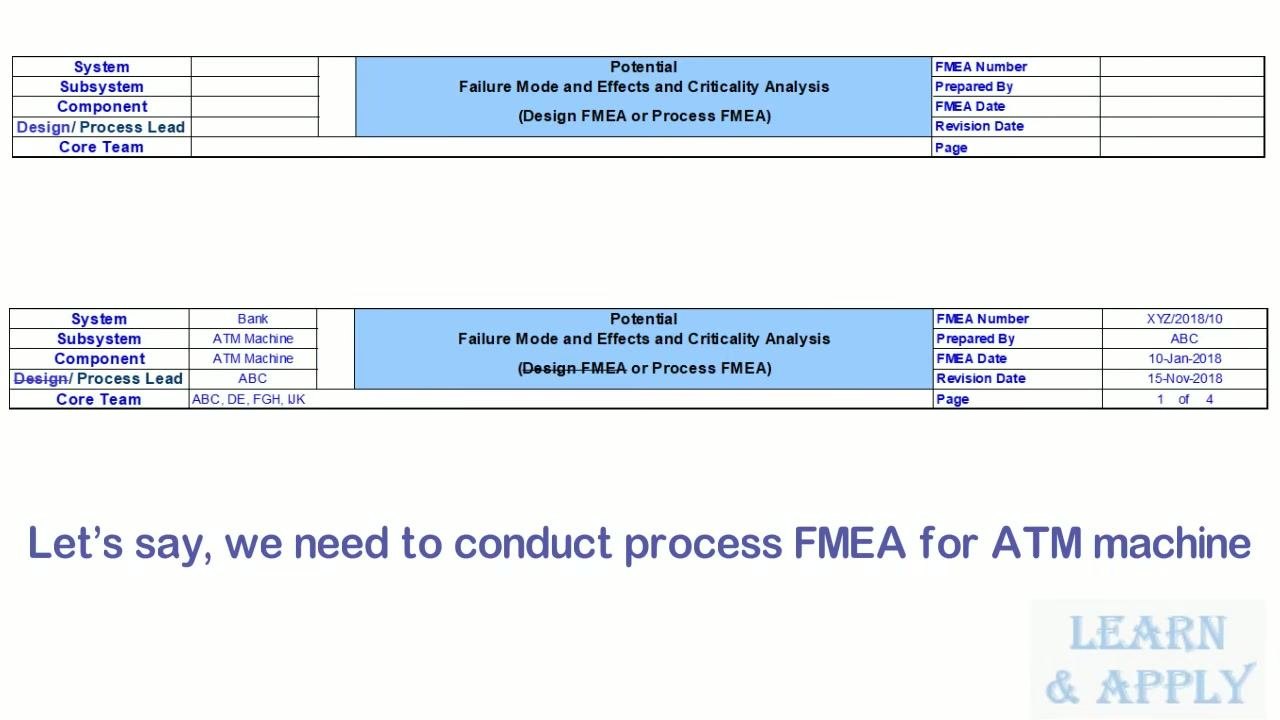
- System: Bank
- Subsystem: ATM Machine
- Component: ATM Machine
- Analysis type: Process FMEA
Team & References
Assemble the cross-functional team and gather reference documents before you begin scoring failures.
Preparatory documents to collect or create: - Root cause analysis of past failures (investigate previous issues before starting). - Boundary/block diagram and parameter diagram, for Design FMEA. - Process flow diagram and characteristics matrix, for Process FMEA. - Ensure these documents are available from the beginning of the development phase.
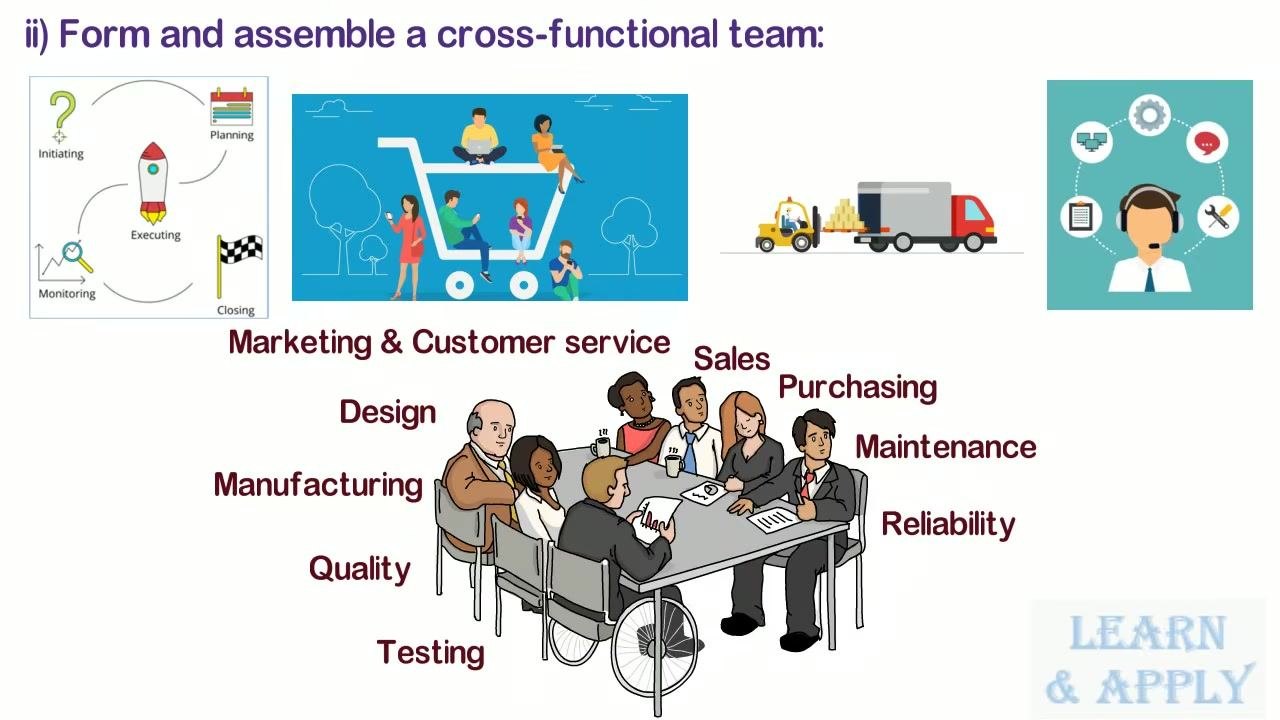
Cross-functional team composition: - Design - Manufacturing - Quality - Testing - Reliability - Maintenance - Purchasing - Sales - Marketing - Customer Service
Document identifiers for the worked example: - Design/Process Lead: ABC - Core Team: ABC, DE, FGH, JK - FMEA Number: XYZ/2018/10 - Prepared By: ABC - FMEA Date: 10-Jan-2018 - Revision Date: 15-Nov-2018 - Page: 1 of 4
Additional reference material: - ASQ (American Society for Quality) Certified Six Sigma Black Belt resources. - Quality-One International guidance material on FMEA methodology.
Process Steps
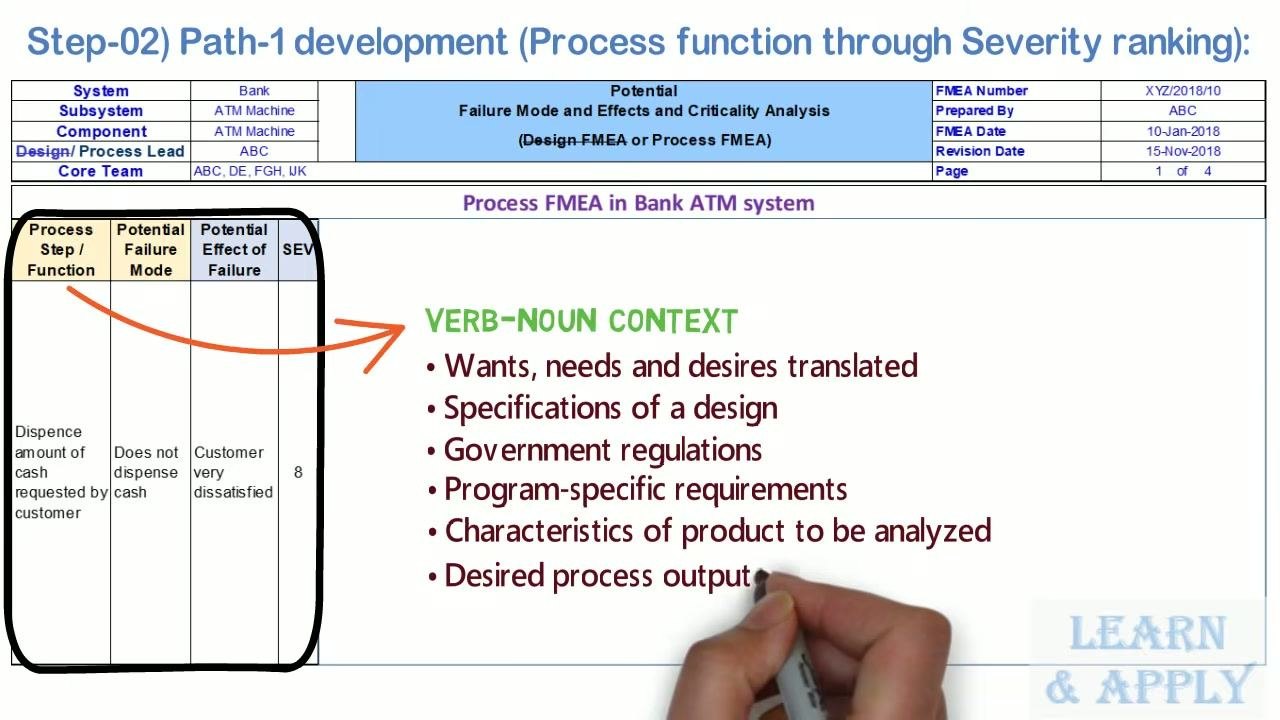
Once the form header is complete, populate the first columns using the pre-work documents (block diagrams, process flow diagrams, characteristics matrix).
- Write each process step or function in a verb-noun format (e.g., "Dispense cash") with a measurable outcome. Functions may originate from customer wants/needs/desires translated into requirements, design specifications, government regulations, program-specific requirements, product characteristics, or desired process outputs.
- Define potential failure modes as "anti-requirements." A failure mode can take one of five forms:
- Full function failure
- Partial or degraded function failure
- Intermittent function failure
- Over function failure
- Unintended function failure
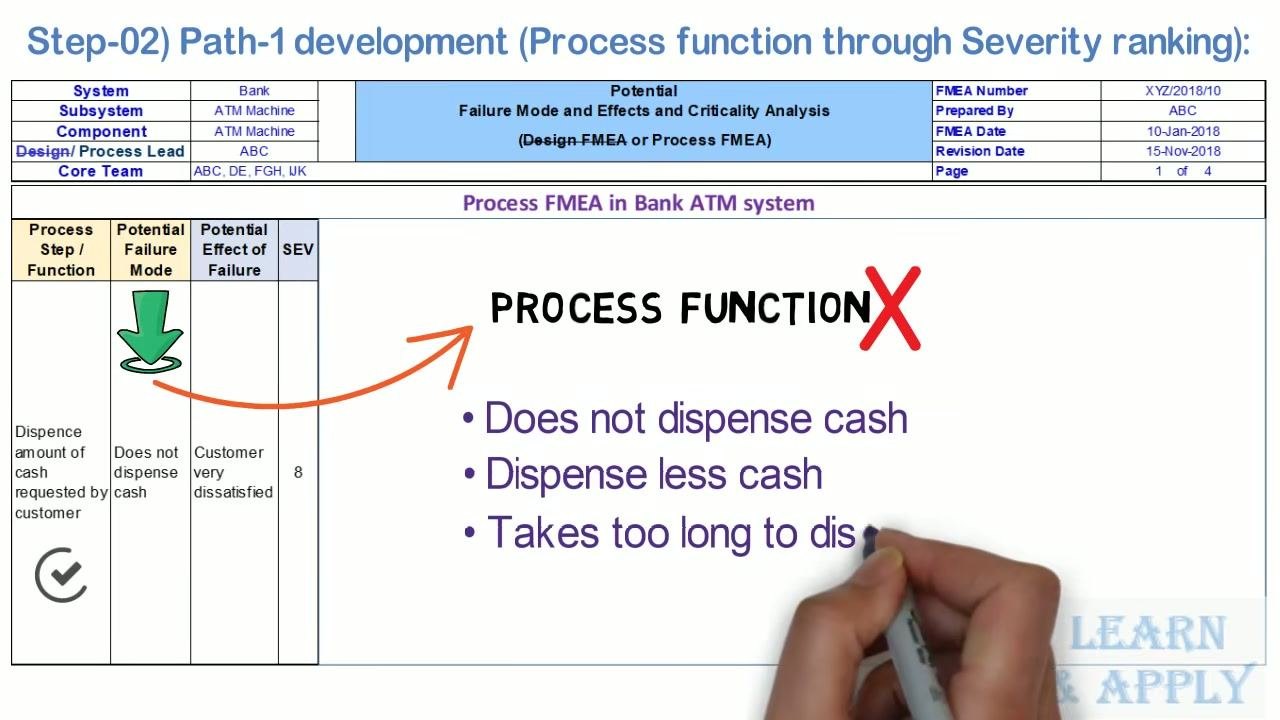
- For the example process step "Dispense amount of cash requested by customer," list the possible failure modes:
- Does not dispense cash
- Dispenses less cash
- Takes too long to dispense cash
Carry one failure mode at a time (e.g., "Does not dispense cash") through the remaining columns for clarity.
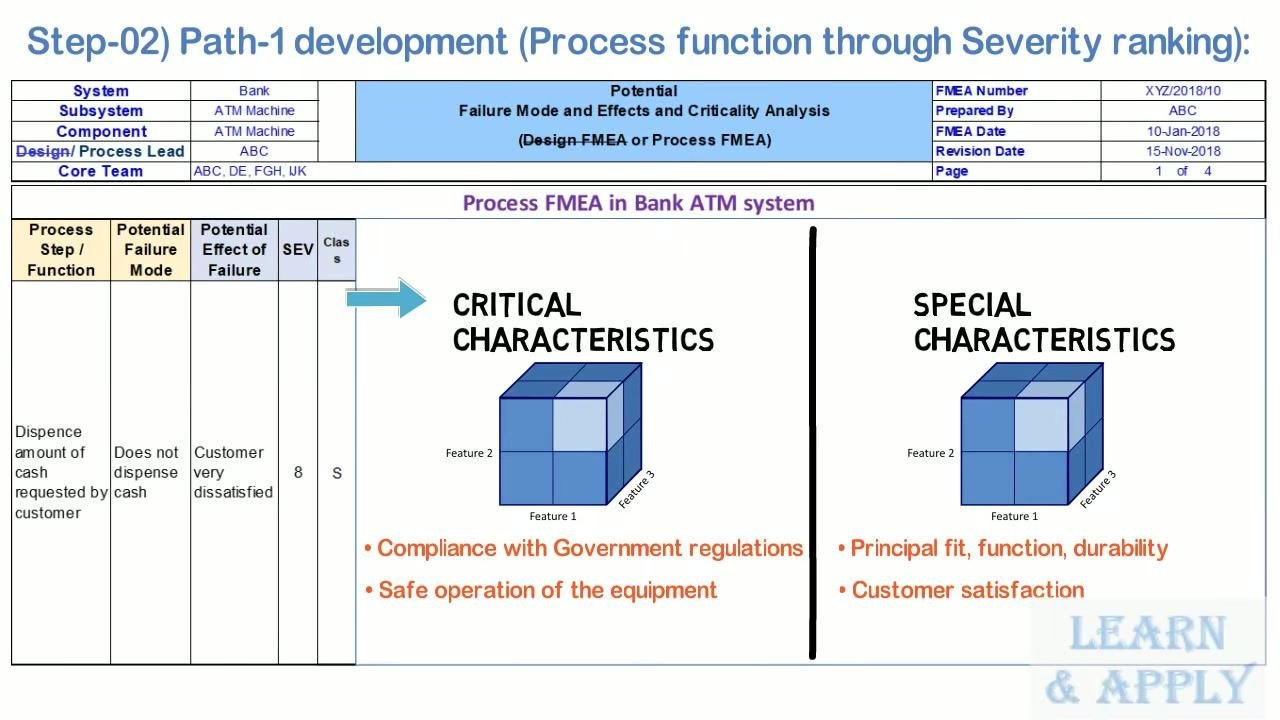
- Classify whether the process step or failure mode involves a critical or special characteristic. A critical characteristic is a feature or dimension where reasonably anticipated variation could directly affect compliance with government regulations or the safe operation of the equipment. A special characteristic is a feature or dimension where reasonably anticipated variation could affect principal fit, function, durability, customer satisfaction, or manufacturing process capability.
Failure Analysis
Document the effect, severity, cause, occurrence, current controls, and detection rating for each failure mode.
Step: Define the potential effect of failure
Describe the result if the failure mode occurs. For "Does not dispense cash," the effect is "Customer very dissatisfied."
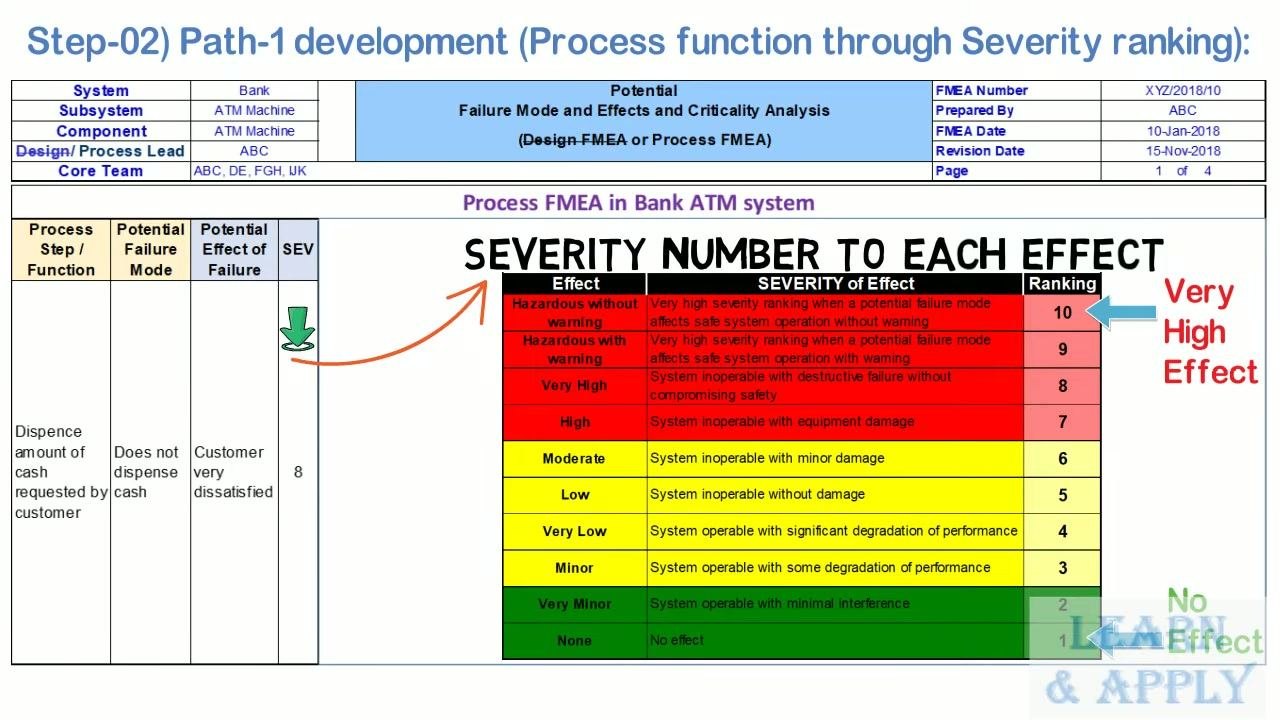
Step: Assign a severity number (1–10 scale)
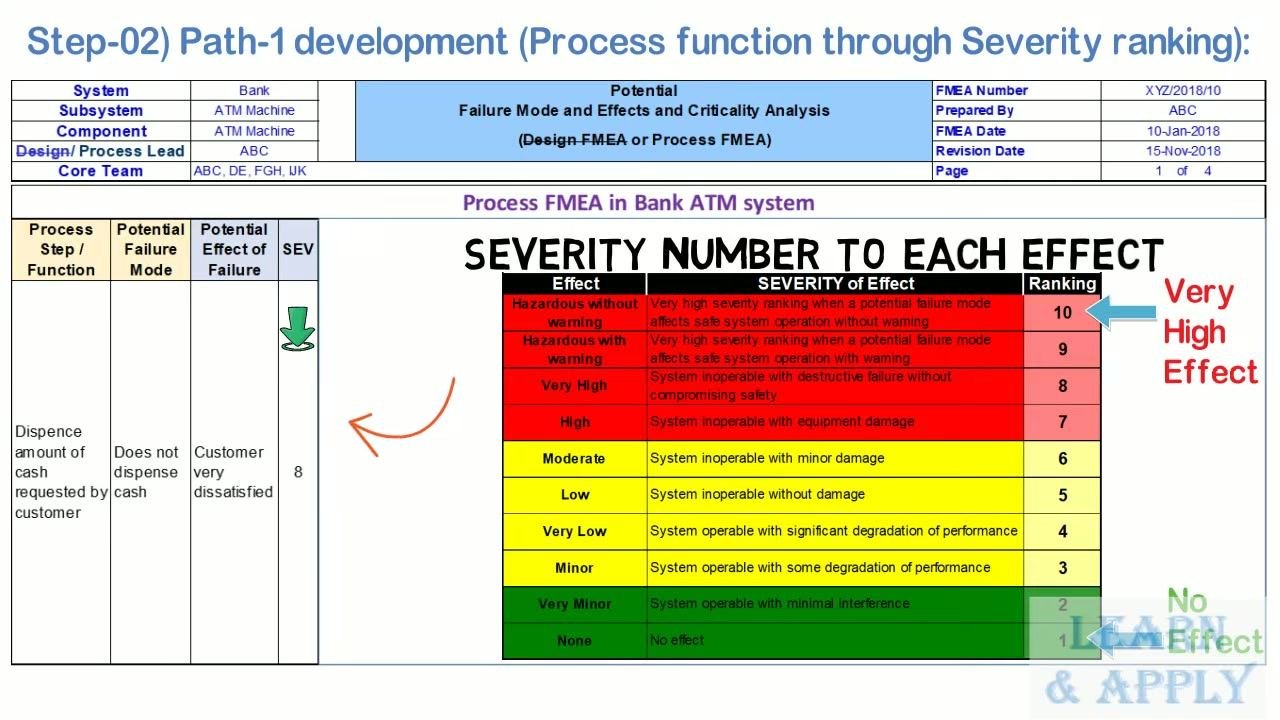
- 10 – Hazardous without warning (affects safety, no warning)
- 9 – Hazardous with warning (affects safety, with warning)
- 8 – Very high (system inoperable, destructive failure, no safety compromise)
- 7 – High (system inoperable, equipment damage)
- 6 – Moderate (system inoperable, minor damage)
- 5 – Low (system inoperable, no damage)
- 4 – Very low (system operable, significant performance degradation)
- 3 – Minor (system operable, some performance degradation)
- 2 – Very minor (system operable, minimal interference)
- 1 – None (no effect)
"Customer very dissatisfied" is scored SEV = 8.
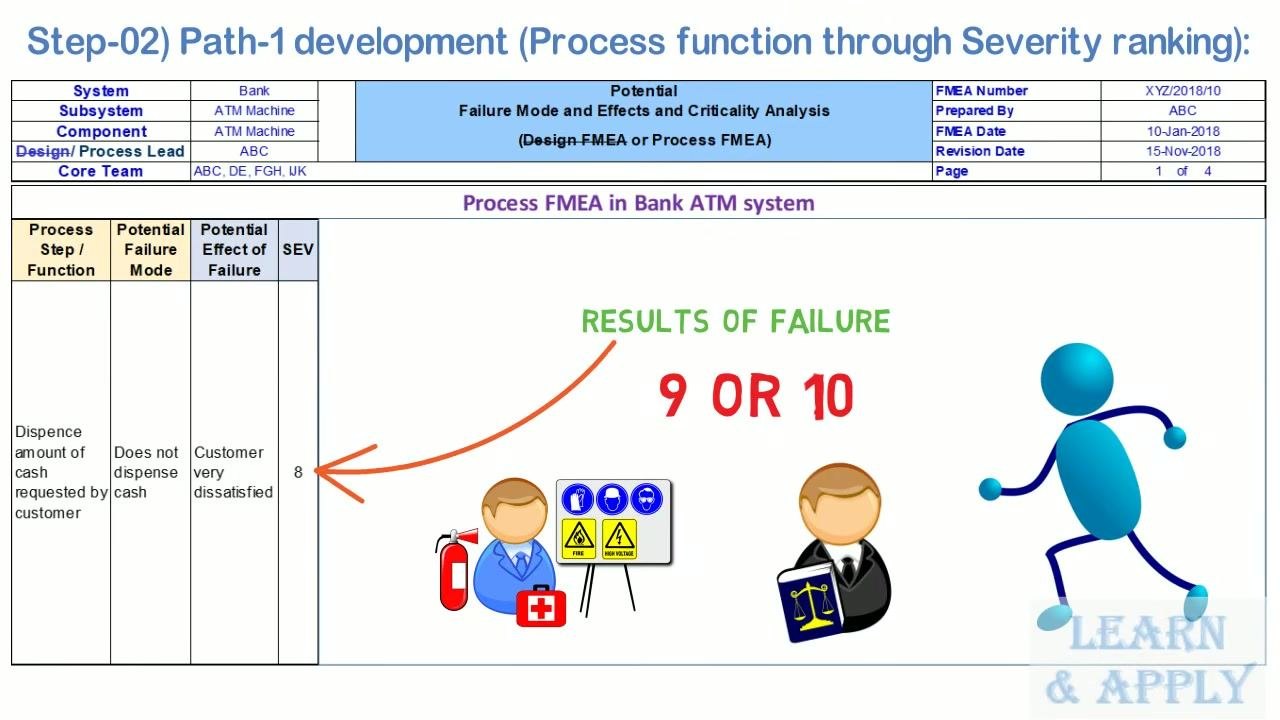
If any severity score reaches 9 or 10, flag it for immediate recommended action, particularly where the effect touches product/process design, safety, or regulatory compliance.
Step: Complete the row and classify the characteristic
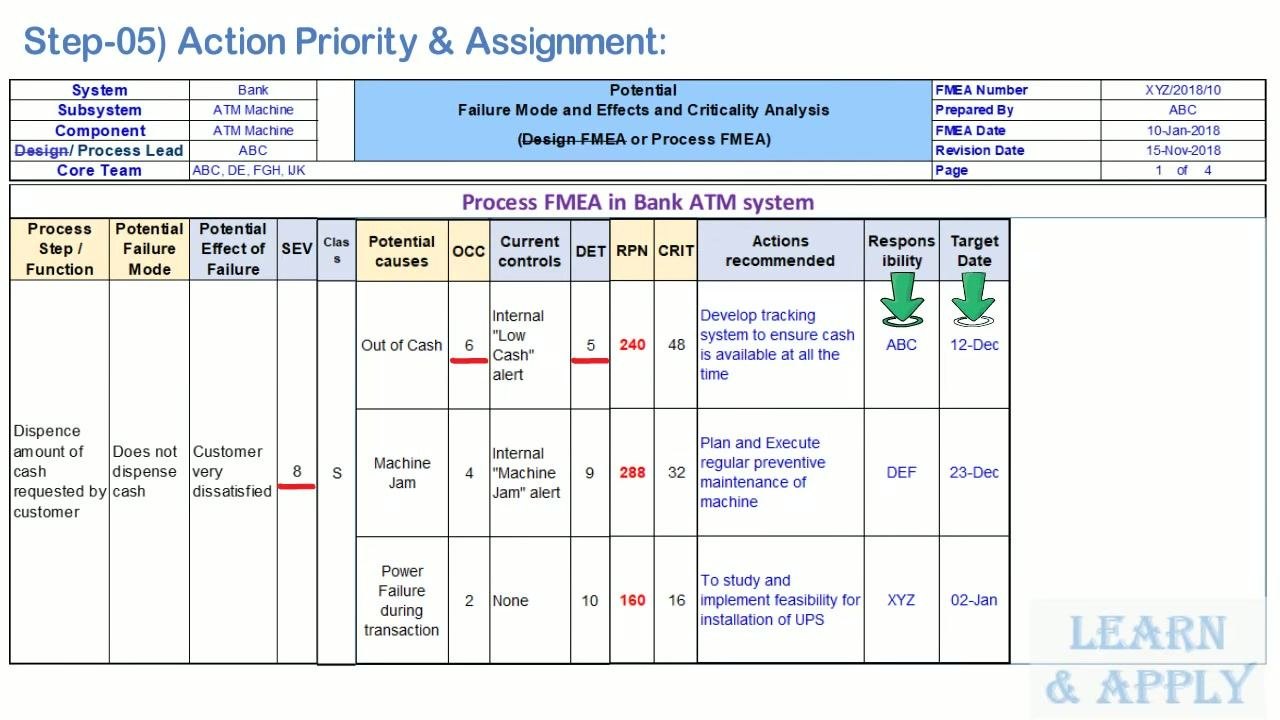
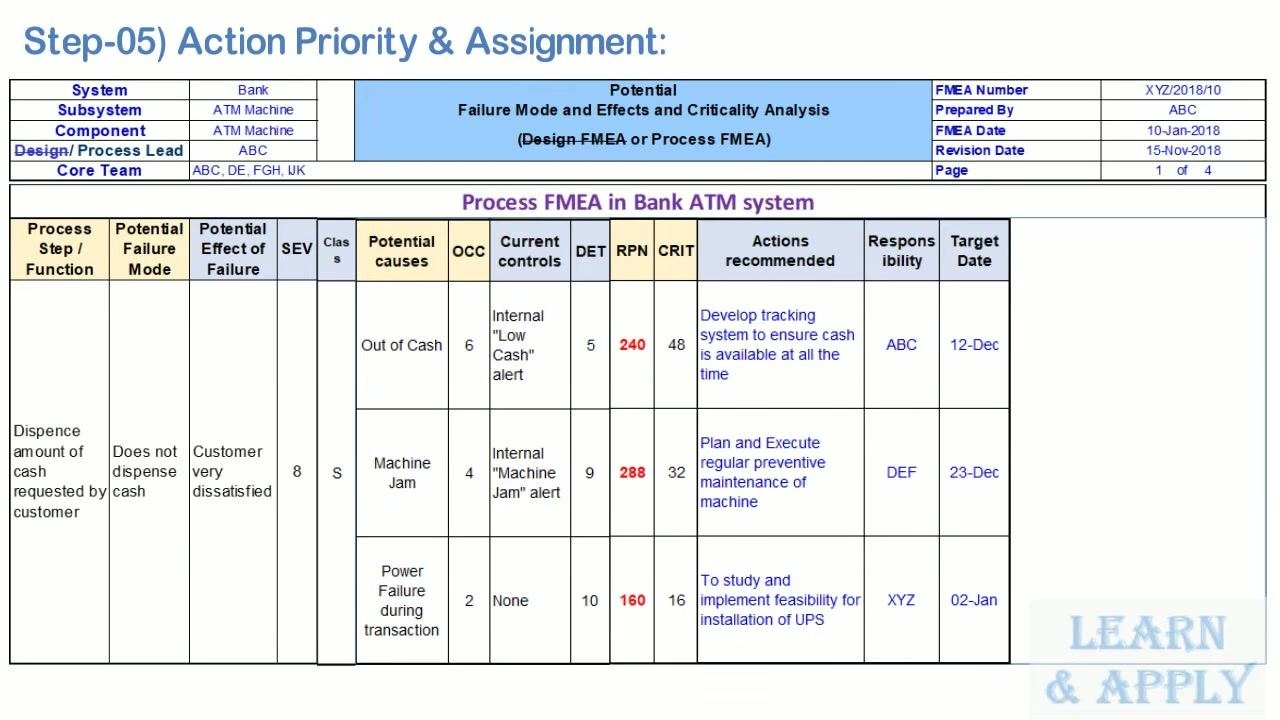
| Process Step/Function | Potential Failure Mode | Potential Effect of Failure | SEV | Classification |
|---|---|---|---|---|
| Dispense amount of cash requested by customer | Does not dispense cash | Customer very dissatisfied | 8 | S / R / K / blank, per your organization's guideline |
Mark the classification column using your organization's notation (for example, S for Safety, R for Regulatory, K for Key characteristic, or leave it blank if not applicable).
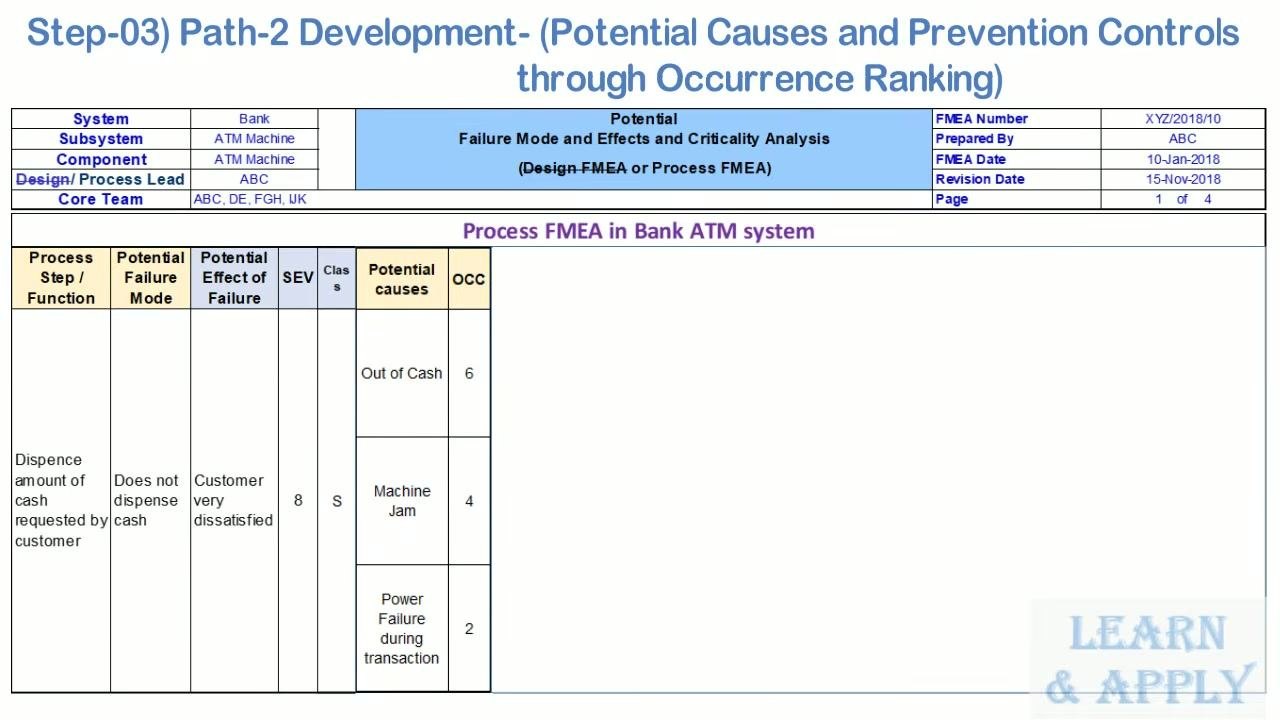
Step: List potential causes and occurrence ranking
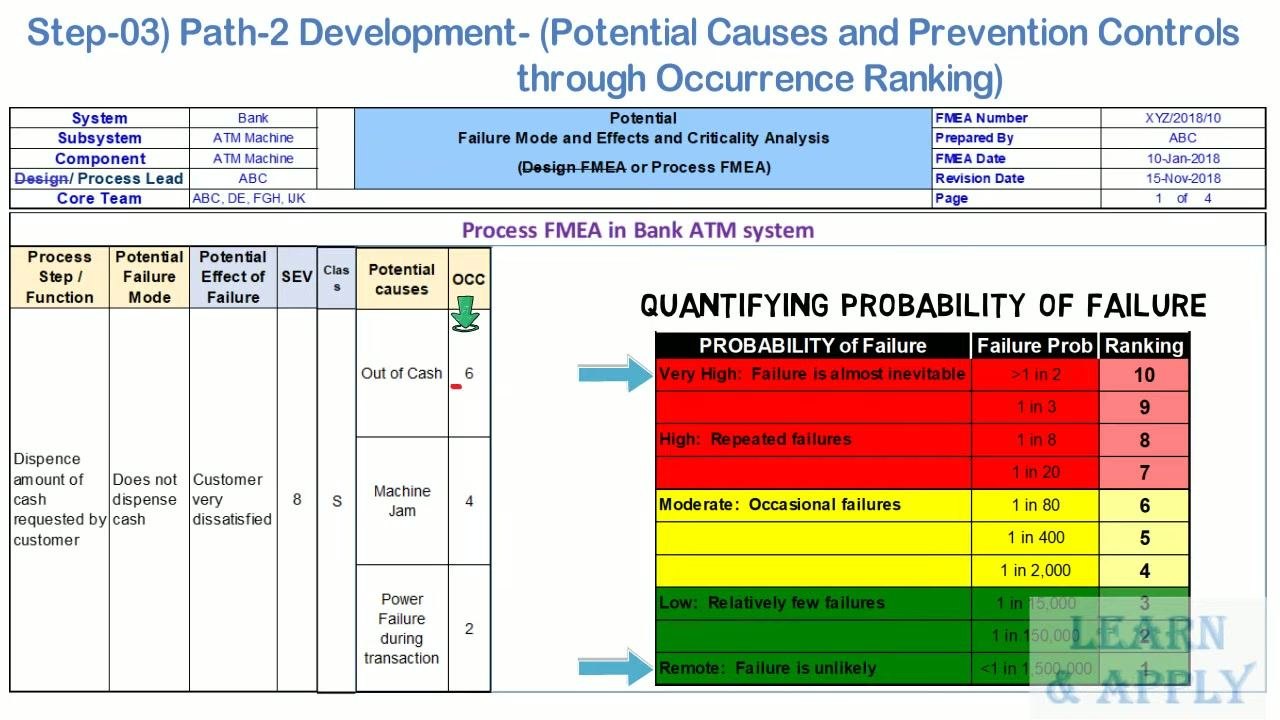
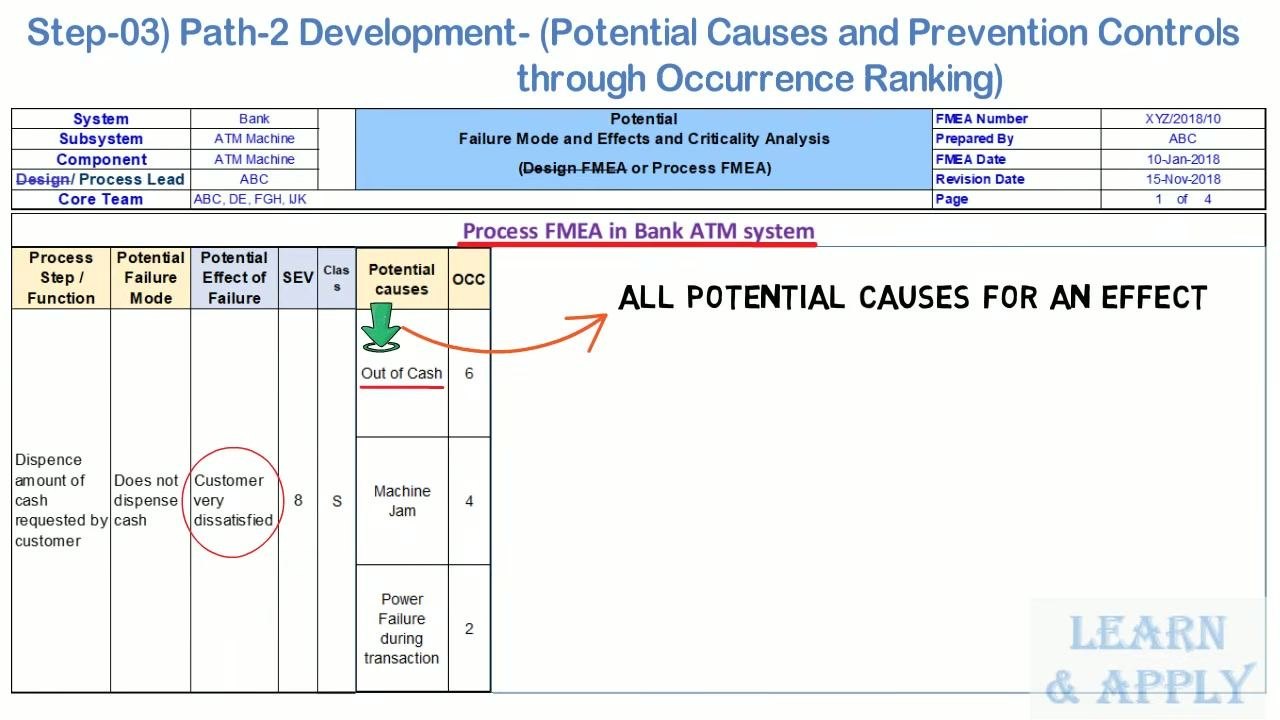
For the failure mode "Does not dispense cash," list every potential cause linked to the effect "Customer very dissatisfied":
| Potential Cause | Occurrence (OCC) | Interpretation |
|---|---|---|
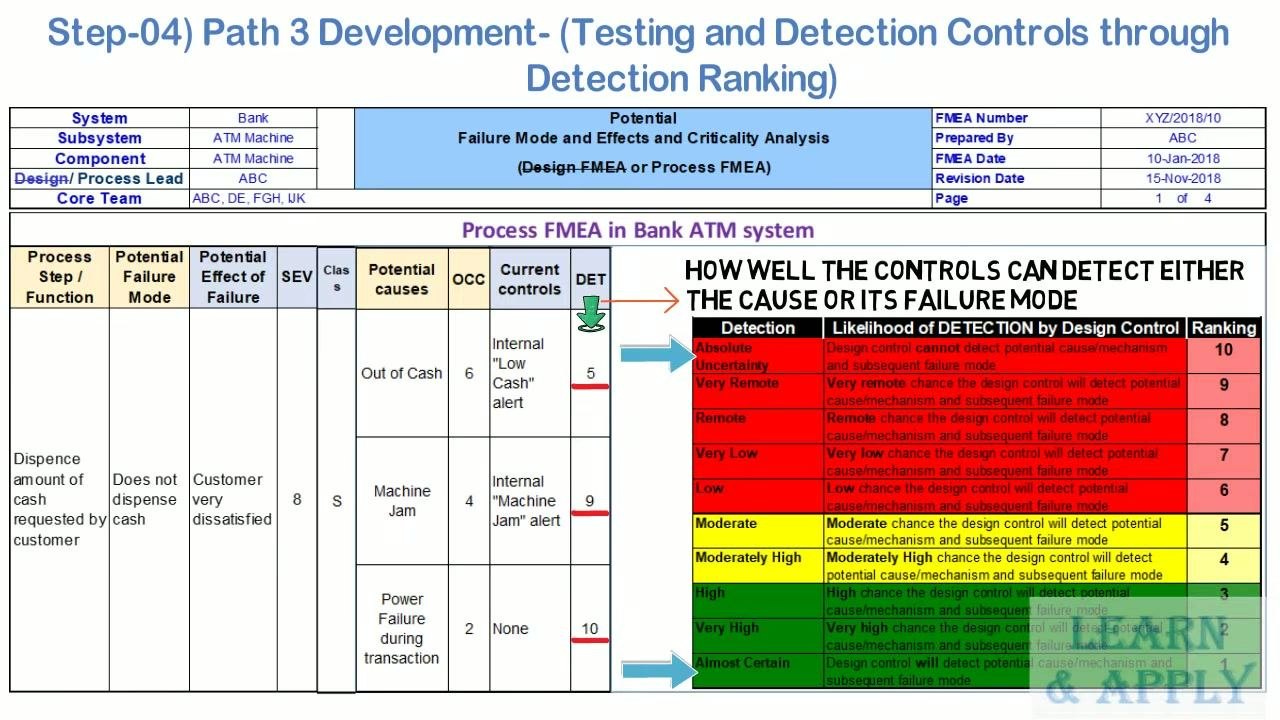
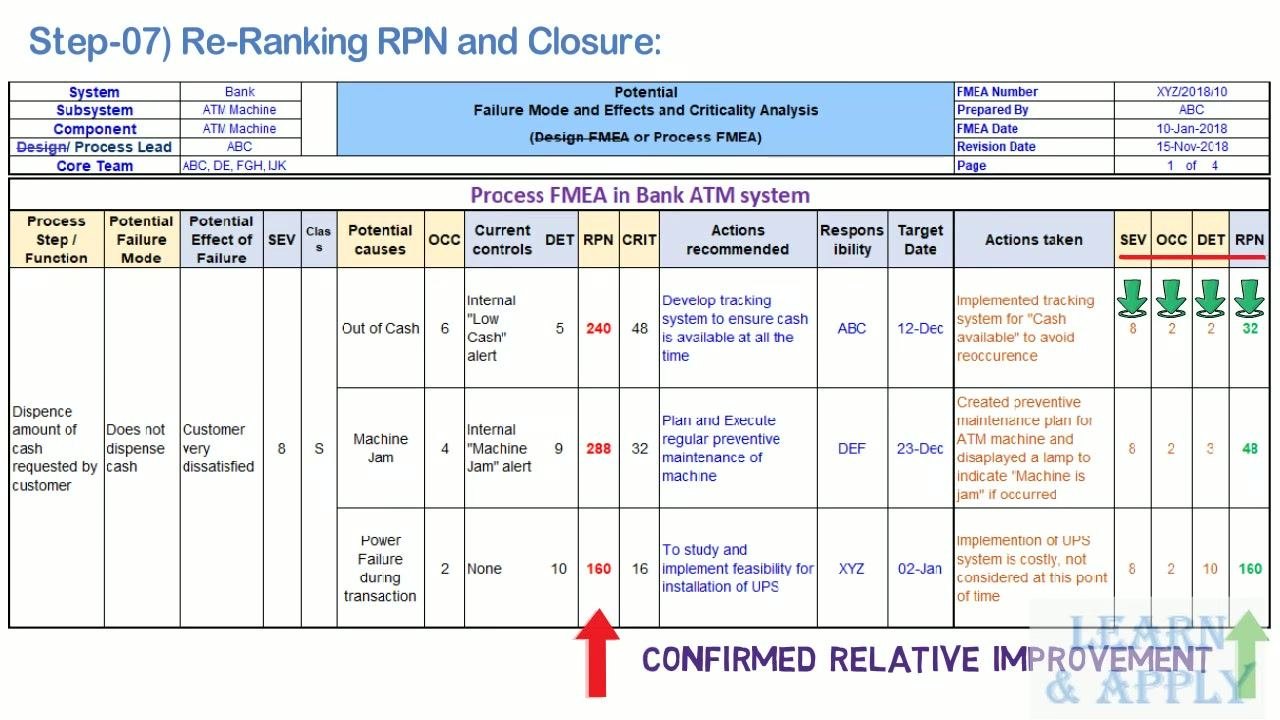
| Out of Cash | 6 | Moderate, occasional failures (approx. 1 in 80) |
| Machine Jam | 4 | Low, relatively few failures (approx. 1 in 2,000) |
| Power Failure during transaction | 2 | Remote, failure is unlikely (approx. 1 in 150,000) |
Step: Document current controls and detection rating
Current controls are the mechanisms, tests, or procedures in place to detect the cause before it reaches the customer. Detection (DET) is scored on a 1–10 scale, where 1 means the control is almost certain to detect the failure and 10 means the control is unable to detect it at all.
| Potential Cause | Current Controls | DET |
|---|---|---|
| Out of Cash | Internal "Low Cash" alert | 5 (moderate chance of detection) |
| Machine Jam | Internal "Machine Jam" alert | 9 (very remote chance of detection) |
| Power Failure during transaction | None | 10 (no control exists) |
Interpret the detection scale as follows: rankings 1–3 indicate high to almost certain detection (green), 4–6 indicate moderate detection (yellow), and 7–10 indicate low to no detection (red).
Risk Priority
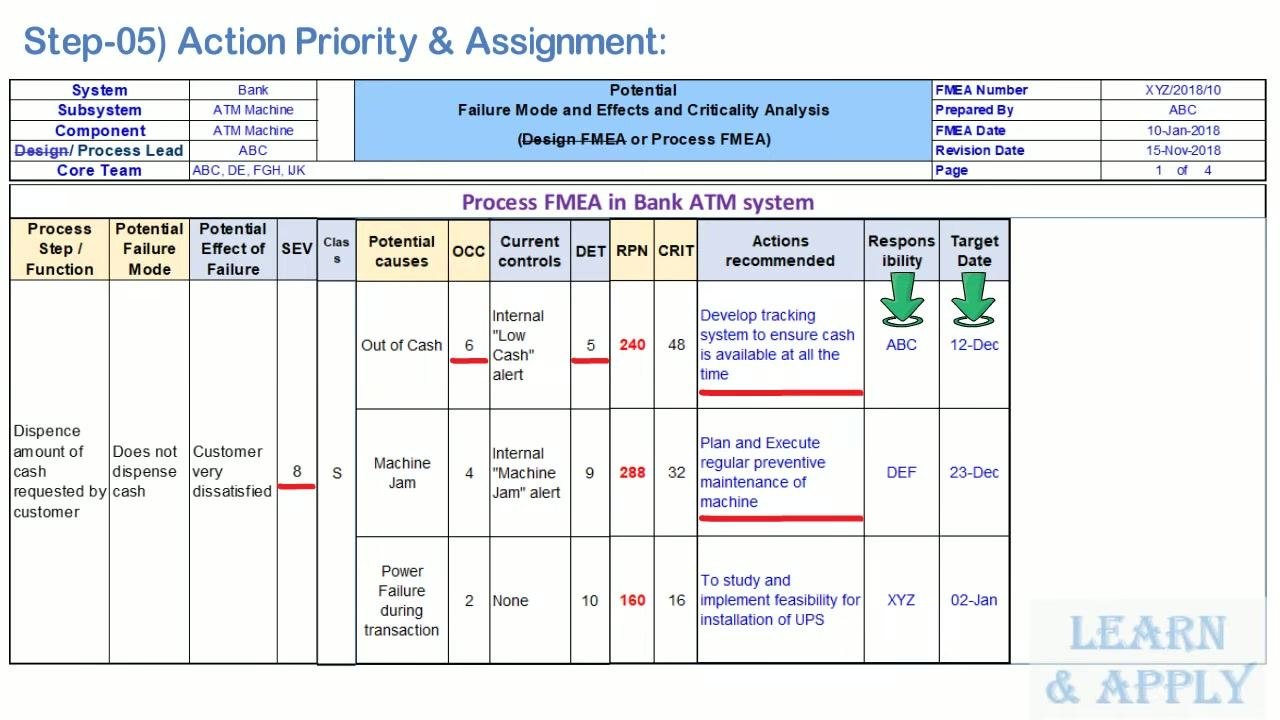
Calculate the Risk Priority Number (RPN) and Criticality for each cause using:
- RPN = Severity (S) × Occurrence (O) × Detection (D)
- Criticality = Severity (S) × Occurrence (O)
| Potential Cause | S | O | D | RPN | Criticality |
|---|---|---|---|---|---|
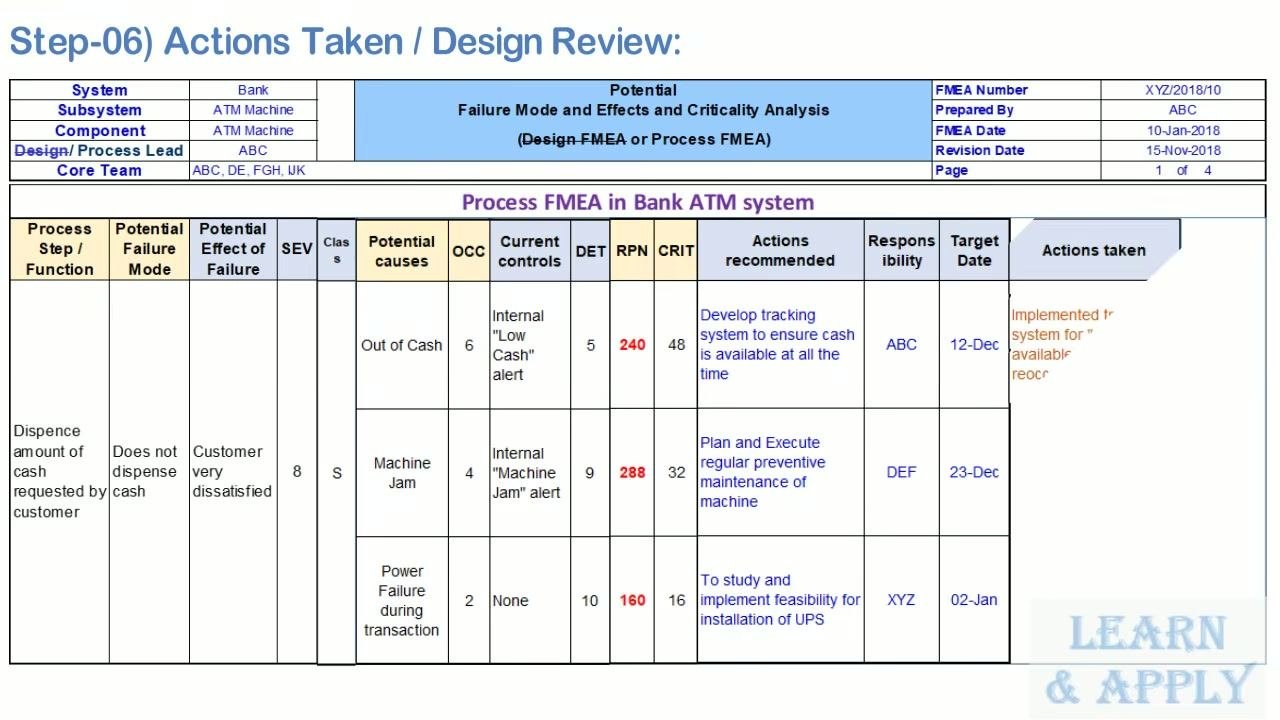
| Out of Cash | 8 | 6 | 5 | 240 | 48 |
| Machine Jam | 8 | 4 | 9 | 288 | 32 |
| Power Failure during transaction | 8 | 2 | 10 | 160 | 16 |
Use RPN and Criticality to rank potential failures: higher values indicate higher risk and higher priority for corrective action.
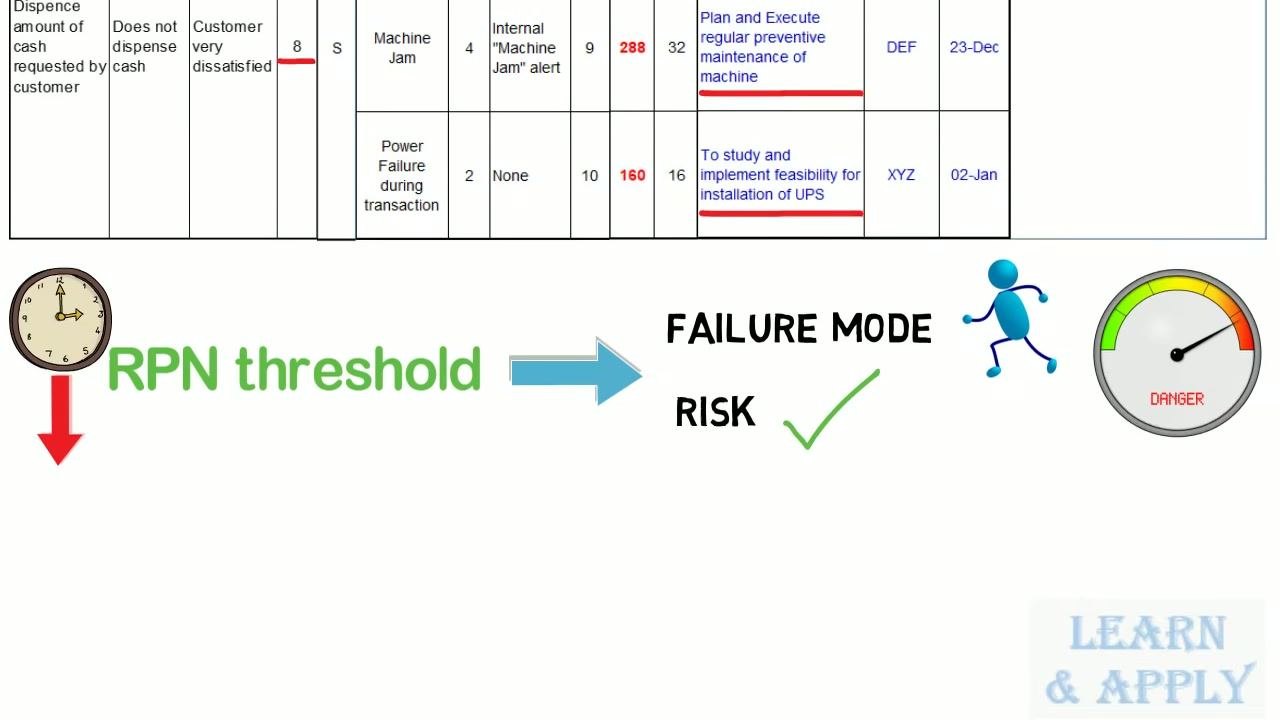
Many organizations use an RPN threshold to determine which failure modes require corrective action. Compare each calculated RPN against the threshold to flag high-risk items, and be aware that focusing only on lowering RPN scores can lead to adjusting rankings rather than addressing the underlying risk.
Reference the RPN matrix to classify risk zones by severity and occurrence:
- Red Zone: "Must eliminate the risk" (high severity and/or occurrence).
- Yellow Zone: "Consideration" (medium risk, needs attention).
- Green Zone: "Acceptable risk" (low severity and occurrence).
Use the FMEA process for continuous improvement by focusing corrective action on the Top 5 RPN values first.
Recommended Actions
For each cause above the risk threshold, document the recommended action, the responsible owner, and the target completion date.
| Potential Cause | Action Recommended | Responsible | Target Date |
|---|---|---|---|
| Out of Cash | Develop a tracking system to ensure cash is available at all times | ABC | 12-Dec |
| Machine Jam | Plan and execute regular preventive maintenance of the machine | DEF | 23-Dec |
| Power Failure during transaction | Study and implement the feasibility of installing a UPS | XYZ | 02-Jan |
Record what was actually implemented, and close the action only once the countermeasure is proven effective. An FMEA that does not identify or mitigate risk is considered non-value-added.
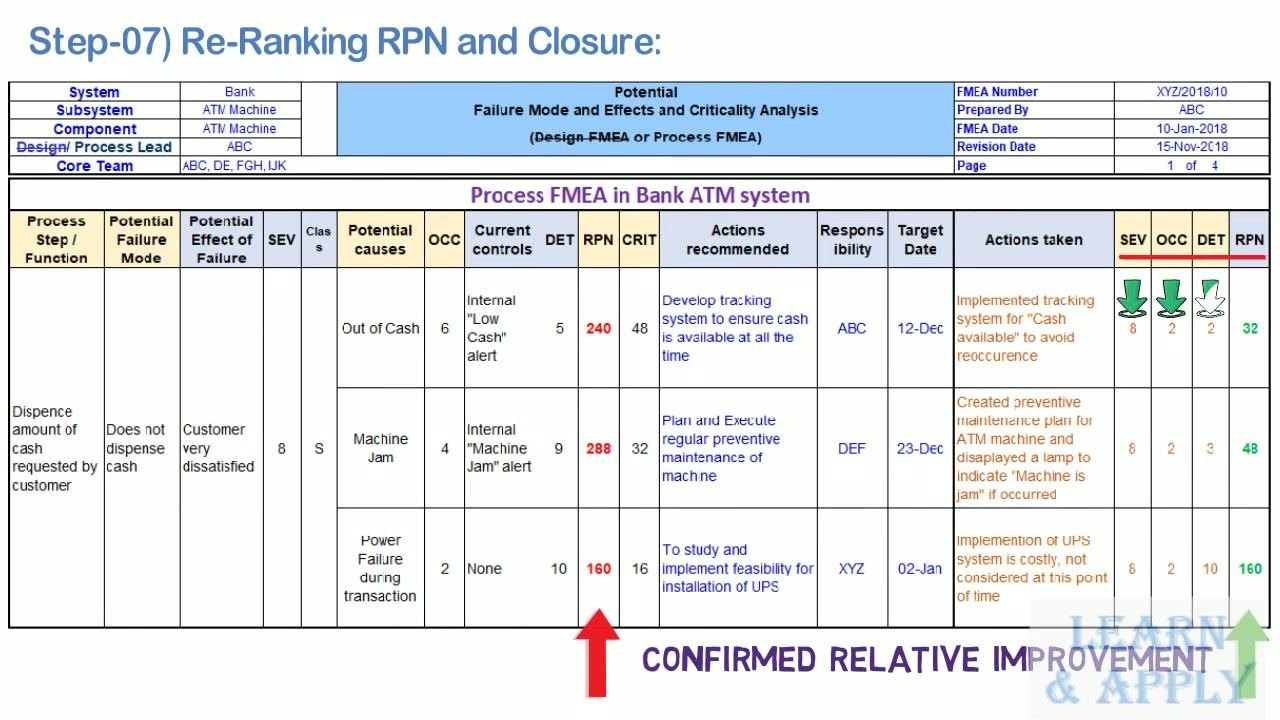
| Potential Cause | Action Taken |
|---|---|
| Out of Cash | Implemented tracking system for cash |
| Machine Jam | Created preventive maintenance plan and added an indicator lamp for jams |
| Power Failure during transaction | UPS not implemented, due to cost |
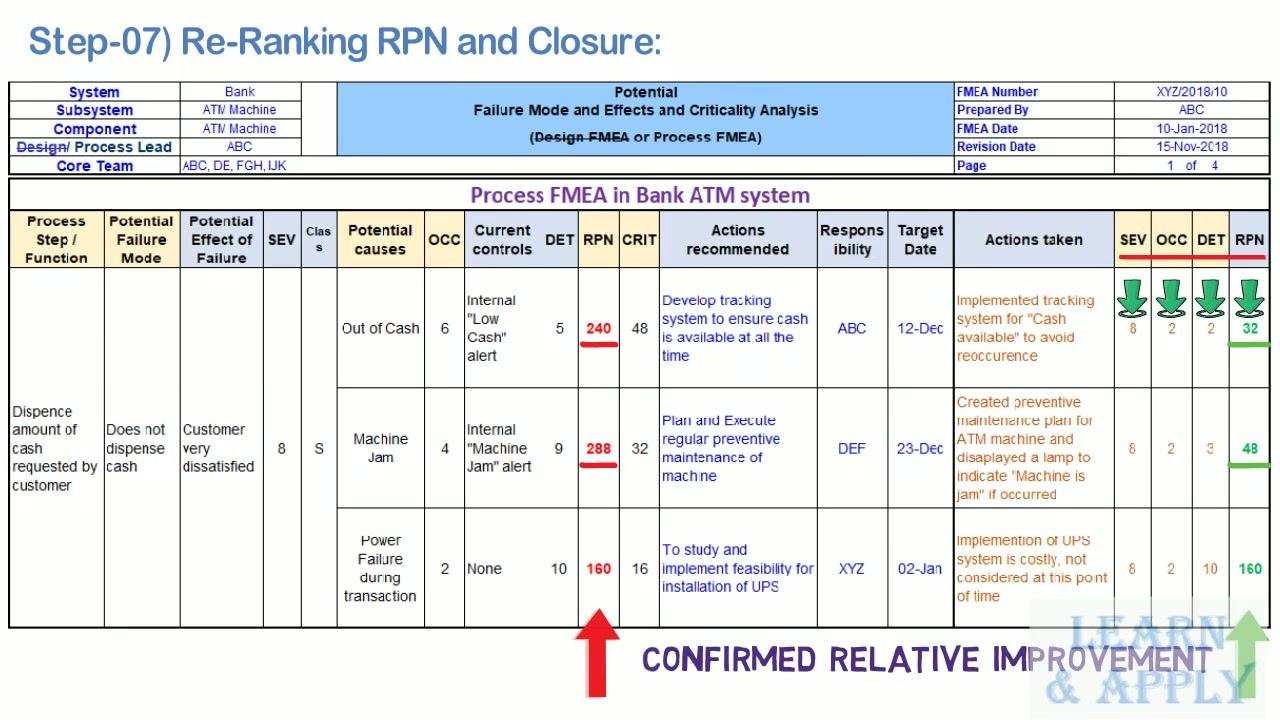
After the actions are in place, re-score Severity, Occurrence, and Detection, then recalculate RPN to confirm relative improvement:
| Potential Cause | SEV | OCC | DET | New RPN | Initial RPN |
|---|---|---|---|---|---|
| Out of Cash | 8 | 2 | 2 | 32 | 240 |
| Machine Jam | 8 | 2 | 3 | 48 | 288 |
| Power Failure during transaction | 8 | 2 | 10 | 160 (no action taken due to cost) | 160 |
Repeat the action-and-re-rank cycle until all risks are reduced to an acceptable level, comparing initial and revised RPN values each time to confirm continuous improvement.
Control Updates
After actions are confirmed effective, update the corresponding control plan, work instruction, or inspection item to reflect the new controls (for example, the "Low Cash" and "Machine Jam" alerts and the preventive maintenance plan) so that the improved detection and occurrence levels are sustained in production.
Remember: the purpose of an FMEA is to discover and mitigate risk. Use it as a proactive tool to improve safety, reliability, and continuous improvement across your process or design.
Generation details: cost, quality tiers, downloads
Docsie billed 6,500 credits ($4.55) to analyze this 13-minute video at standard quality. The rewrite, template fill and Word/PDF exports were included. The same video at each quality tier:
| Quality | Frames sampled | Credits | Approx. cost |
|---|---|---|---|
| Draft | every 16-30 s | 3,250 | $2.27 |
| Standard (this guide) | every 8-15 s | 6,500 | $4.55 |
| Detailed | every 4-7 s | 13,000 | $9.10 |
| Ultra | every 1-3 s | 26,000 | $18.20 |
Credits priced at $0.70 per 1,000; plans include a monthly allowance. Enterprise customers on on-premise or bring-your-own-model deployments run this on their own inference and pay no per-video credits.
Generated by Docsie Video-to-Docs on 2026-09-10 from a 12-minute video. It was generated straight into Docsie's Failure Mode and Effects Analysis (FMEA) template, so every section of that template is filled from the video. Screenshots are frames from the source video and belong to their creator, LEARN & APPLY : Lean and Six Sigma, whose original is embedded above. If you own this video and want the guide removed or credited differently, contact us and we will act within one business day.