
How to Create a Dashboard in Jira
Jira dashboards are configurable pages where you can set up gauges or gadgets to display high-level, important information about your team's performance. Much like a car's dashboard, a Jira dashboard gives you an at-a-glance overview of key metrics and statuses. This guide walks you through creating a dashboard for a Scrum team, adding sprint-specific gadgets, building filters, and arranging everything into a comprehensive sprint overview.
Video: How to Create a Jira Dashboard in Under 10 Minutes by Modus Create (2020). All credit for the demonstration goes to the creator; watch the original on YouTube. The written guide below was generated from this video by Docsie. Creator? Request a change or removal.
Jira dashboards are configurable pages where you can set up gauges or gadgets to display high-level, important information about your team's performance. Much like a car's dashboard, a Jira dashboard gives you an at-a-glance overview of key metrics and statuses. This guide walks you through creating a dashboard for a Scrum team, adding sprint-specific gadgets, building filters, and arranging everything into a comprehensive sprint overview.
Prerequisites
- Access to Jira Software Cloud (dashboards are also available in all other Jira products and deployment types).
- A Scrum project with an active sprint and backlog you can view.
- Permission to create dashboards and filters in your Jira instance.
This guide uses a "Teams in Space" Scrum board as an example, but the same steps apply to any team or use case.
Access your Scrum board
Before building a dashboard, confirm you can see your team's backlog and active sprint.
- Navigate to your project in Jira Software.
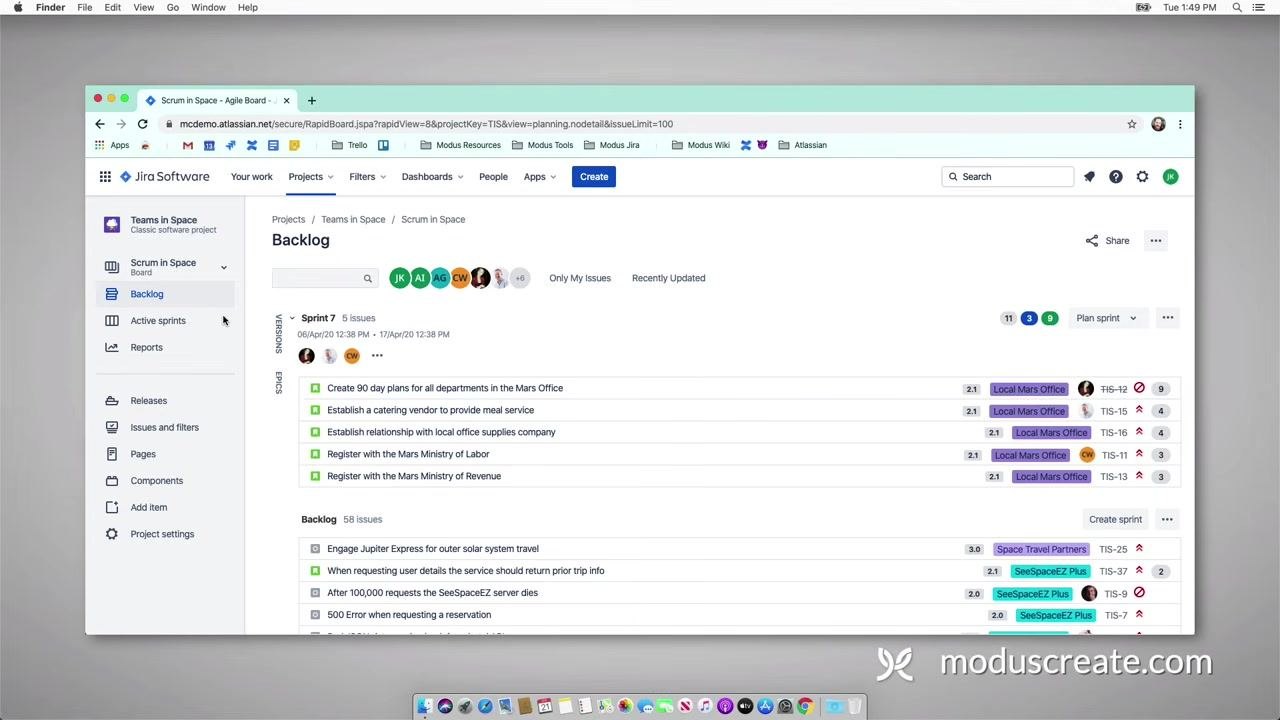
- Confirm that you can see the backlog and the active sprint for your team. In the example, the "Teams in Space" Scrum board shows the backlog and sprint issues.
- Note the navigation options available:
- The left sidebar includes Backlog, Active sprints, Reports, Releases, Issues and filters, Pages, Components, Add item, and Project settings.
- The main panel displays the current sprint (for example, "Sprint 7") along with its issues, as well as the backlog.
- The top navigation bar includes Projects, Your work, Filters, Dashboards, People, Apps, and a Create button.
- The user avatar and search bar appear in the top right, along with the current time.
Create a new dashboard
- Go to the Dashboards menu in the top navigation bar.
- Select Create Dashboard from the dropdown menu.
- In the Create dashboard dialog, enter a dashboard name (for example, "Sprint in Space").
- Optionally, add a description for your dashboard.
- In the Access section, choose who can view the dashboard. The available options are:
- Project: Restrict access to a specific project.
- Group: Restrict access to a specific group.
- Open: Allow any logged-in user to access the dashboard.
- Private: Keep the dashboard visible only to yourself.
-
For this example, select Open so that any logged-in user can access the dashboard.
-
Click Add to confirm the access setting.
- Click Save to create the dashboard.
You now have a new, accessible dashboard in Jira Software Cloud, ready to be customized for your Scrum team's needs.
Add sprint gadgets to your dashboard
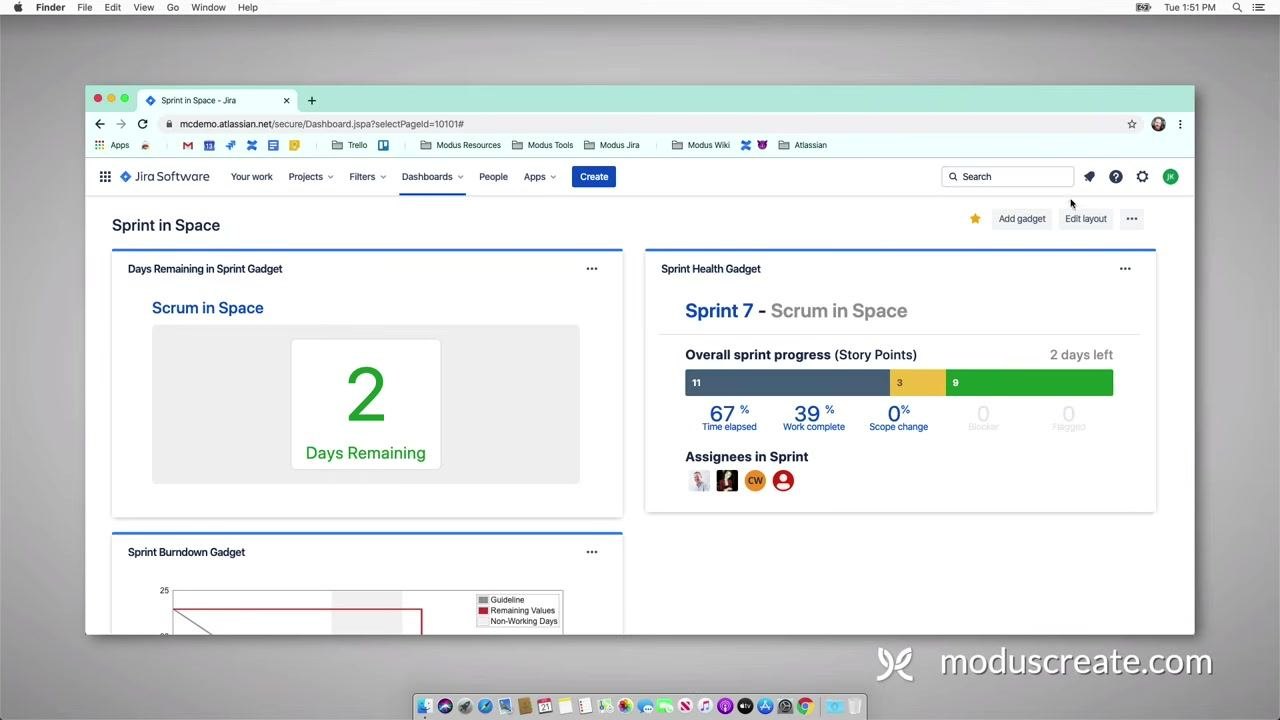
Your newly created "Sprint in Space" dashboard starts out empty, prompting you to add gadgets.
- Navigate to the top right of the dashboard and click Add gadget.
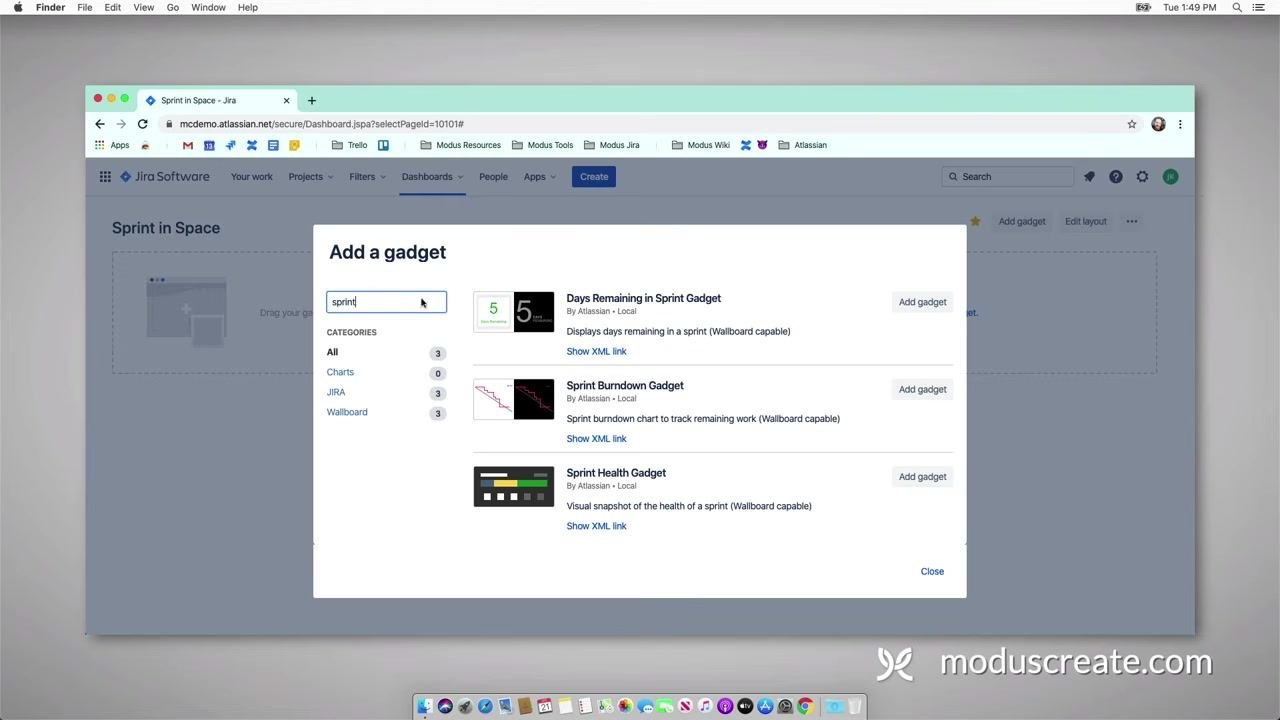
- In the Add a gadget dialog, use the search bar to type sprint.
- Review the available gadgets, which are provided to all Jira Software users by default:
- Days Remaining in Sprint Gadget
- Sprint Burndown Gadget
- Sprint Health Gadget
- Click Add gadget next to each of the three gadgets listed above.
- After adding the gadgets, click Close at the bottom of the dialog.
- Rearrange the gadgets on your dashboard:
- Move the Sprint Health Gadget to a lower position.
- Move the Days Remaining in Sprint Gadget to the top position.
Configure the Days Remaining in Sprint gadget
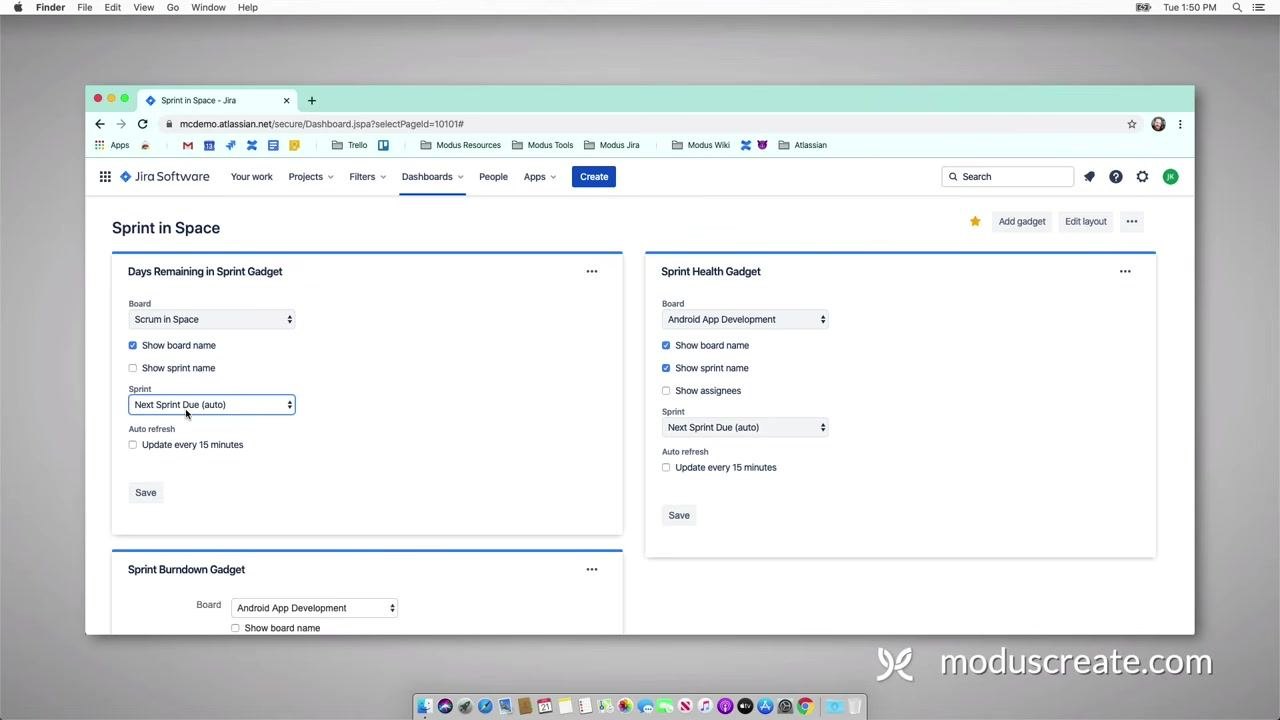
- In the gadget settings, select Board = Scrum in Space from the dropdown.
- Check Show board name.
- For Sprint, select Next Sprint Due (auto).
- Optionally, enable Update every 15 minutes for auto-refresh.
- Click Save to apply the settings.
Configure the Sprint Health gadget
- In the gadget settings, select Board = Scrum in Space from the dropdown.
- Check the following options:
- Show board name
- Show sprint name
- Show assignees
- For Sprint, select Next Sprint Due (auto).
- Enable Update every 15 minutes for auto-refresh.
- Click Save to apply the settings.
Configure the Sprint Burndown gadget
- In the gadget settings, select Board = Scrum in Space from the dropdown.
- For Sprint, select Next Sprint Due (auto).
- Optionally, enable Show board name and Show sprint name as needed.
- Set the Refresh Interval to your preference (for example, every 15 minutes).
- Click Save to apply the settings.
With these three gadgets in place, your dashboard will dynamically update with each new sprint and provide your team with real-time, actionable insights.
Customize the dashboard layout
- Click the Edit layout button at the top right of your Jira dashboard.
- Review the available layout options, such as resizing columns or switching to a three-column layout.
- Select your preferred layout (for example, a three-column layout) to better organize your gadgets.
- Assess your dashboard after changing the layout and decide whether additional gadgets are needed to enhance its usefulness.
Create a filter for your active sprint
- Navigate to the top menu and click Filters.
- In the dropdown, select Advanced issue search to open the issue navigator.
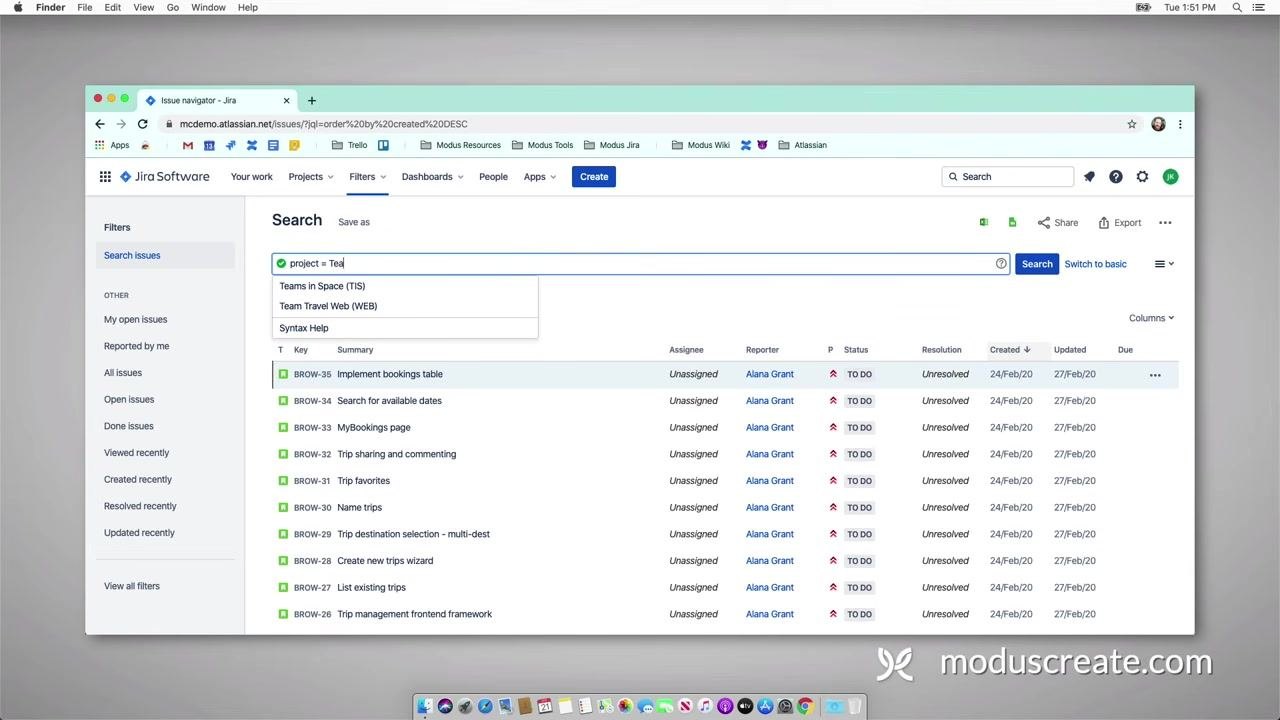
- In the search bar, enter the following JQL (Jira Query Language) to filter issues:
project = "Teams in Space"
-
Wait for Jira to auto-populate project options, then select Teams in Space.
-
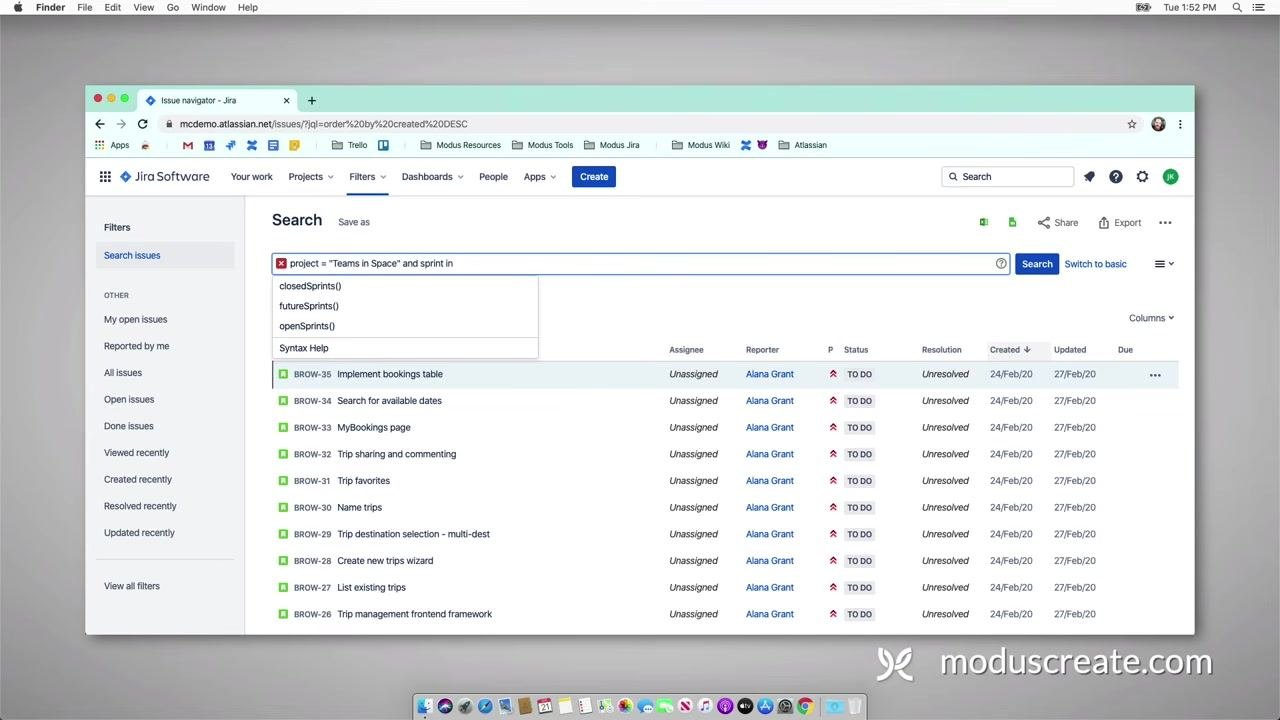
Continue your JQL query by adding a sprint condition:
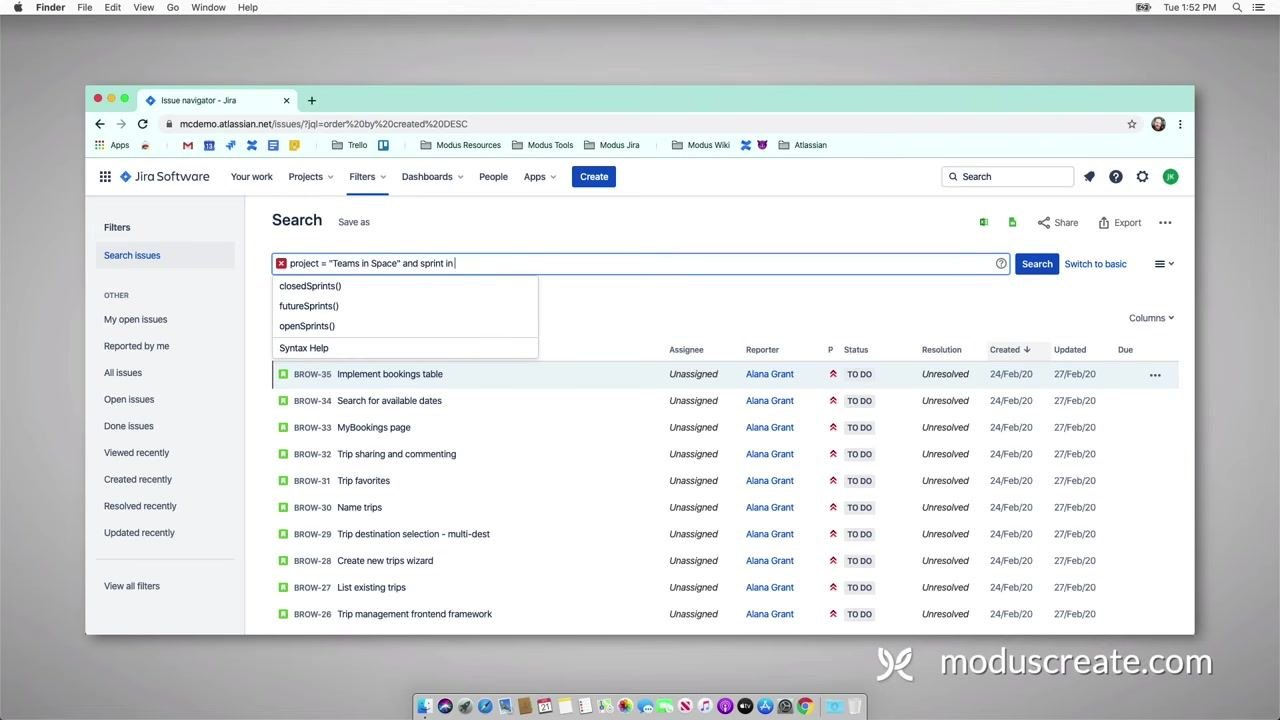
project = "Teams in Space" and sprint in
- Review Jira's auto-suggestions for dynamic sprint values:
closedSprints()for closed sprintsfutureSprints()for sprints not yet startedopenSprints()for the current active sprint
- Select openSprints() to focus on the current sprint.
- Click Search to run your query.
- Review the list of issues that match your filter criteria.
Save and share your filter
- Click the Save as button above the search bar.
- Enter a filter name, such as TIS - Active Sprint.
-
Confirm and save the filter.
-
After saving, click the Details link next to your filter name.
- Click Edit permissions.
- In the permissions dialog, select Open to allow anyone with access to the dashboard to view this filter.
- Click Add to apply the permission changes.
This filter can now be used to power gadgets and ensure all dashboard viewers have access to the relevant issues.
Confirm filter permissions
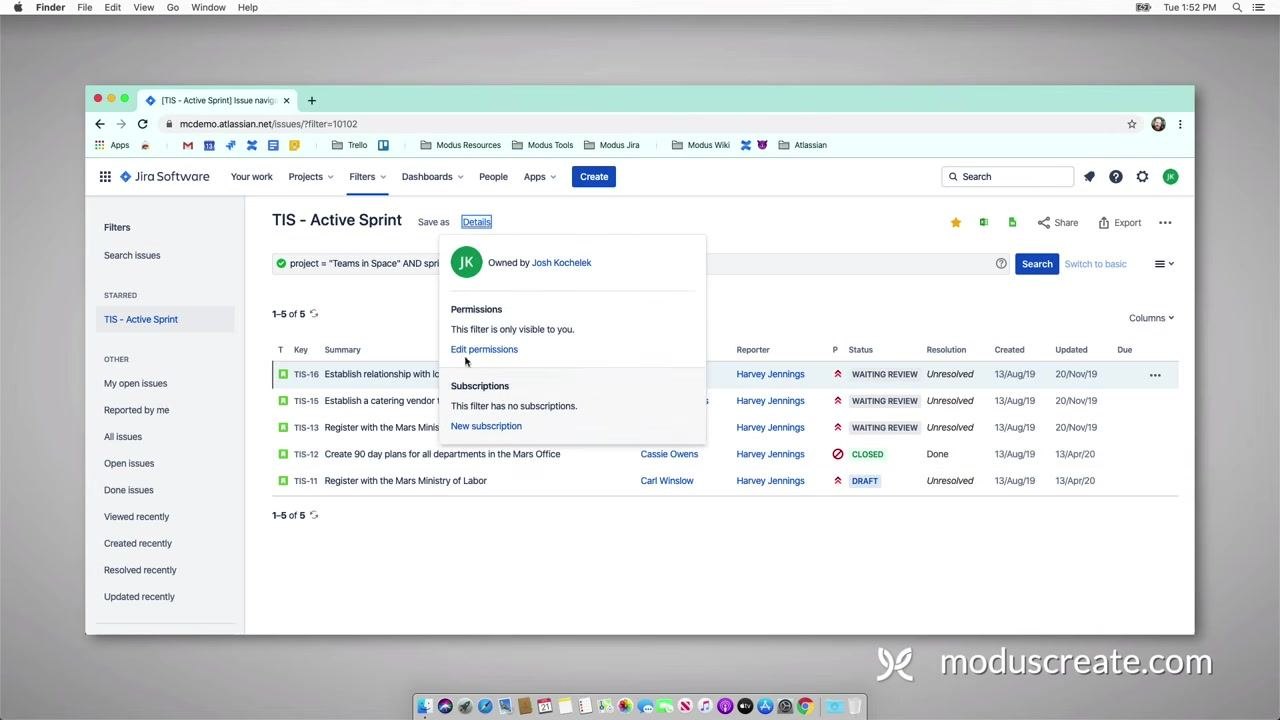
- In the TIS - Active Sprint filter view, click the Details link next to the filter name.
- In the pop-up window, locate the Permissions section.
- Click Edit permissions to modify who can view the filter.
- Review the available sharing options in the permissions dialog.
- Select Open to make the filter visible to anyone with access to the dashboard.
- Click Add to apply the new permission setting.
In this view, the filter TIS - Active Sprint is selected in the left sidebar under "Starred." The details pop-up shows the owner's initials and name, a permissions section indicating the filter is currently visible only to the owner, a highlighted Edit permissions link, and a subscriptions section with no subscriptions yet. The main issue list displays five issues with their keys, summaries, reporters, statuses, resolutions, and dates.
Completing this step ensures that your saved filter is accessible to all intended dashboard viewers, enabling effective sharing and collaboration within Jira.
Select your dashboard and review existing gadgets
- Open Jira Software and navigate to your project.
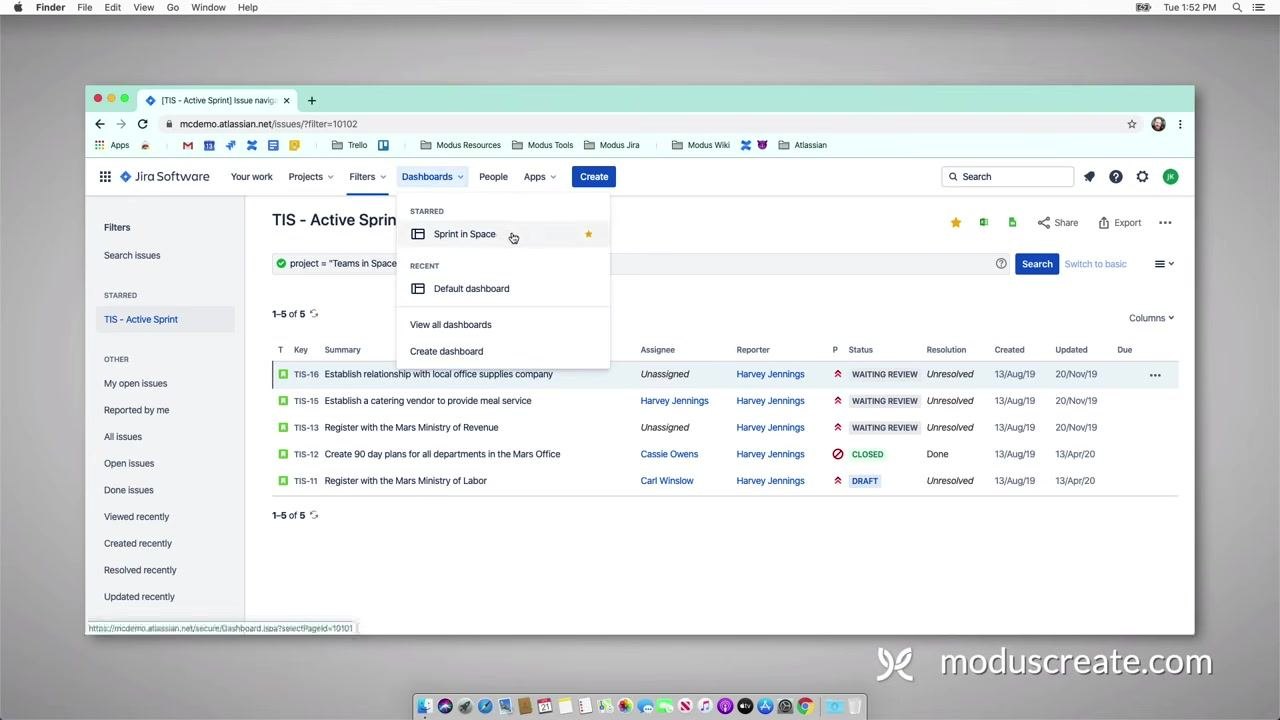
- Click on the Dashboards menu at the top.
- In the dropdown, select your starred dashboard, for example, Sprint in Space. If it hasn't been created yet, choose Create dashboard to make a new one.
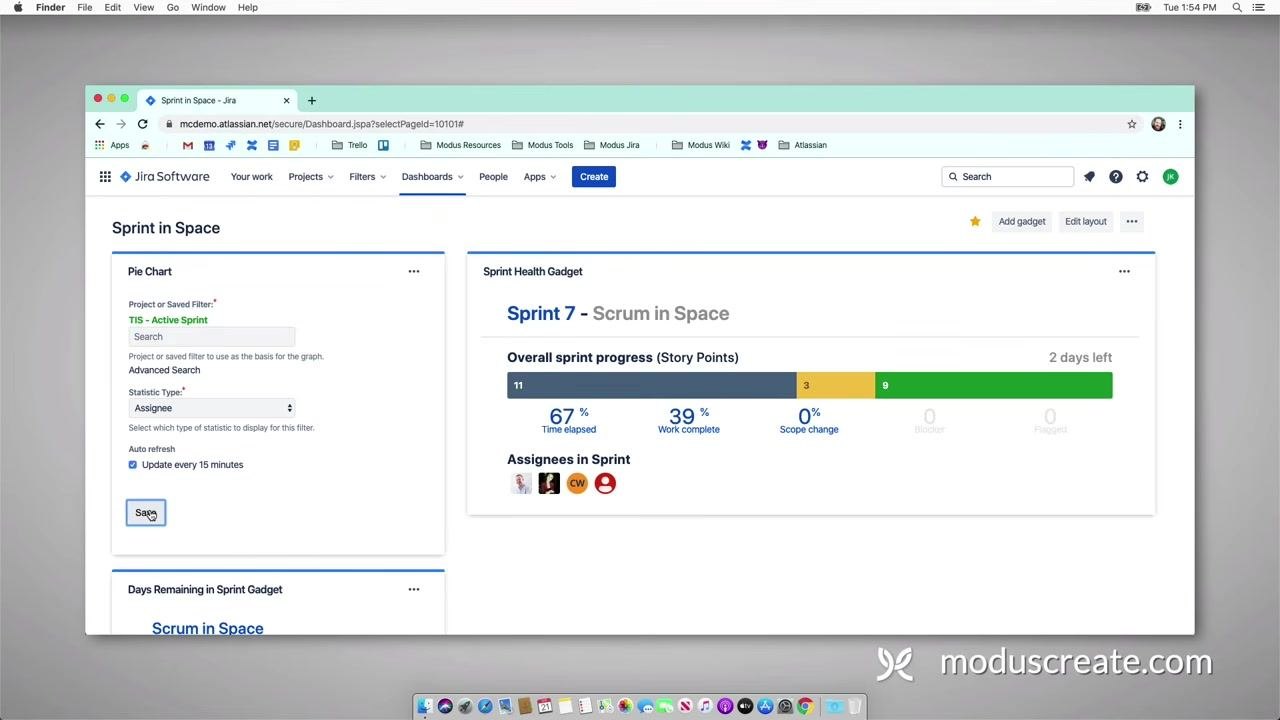
- On the dashboard, observe the existing gadgets:
- Pie Chart (not yet configured)
- Sprint Health Gadget (showing Sprint 7 - Scrum in Space)
- Days Remaining in Sprint Gadget
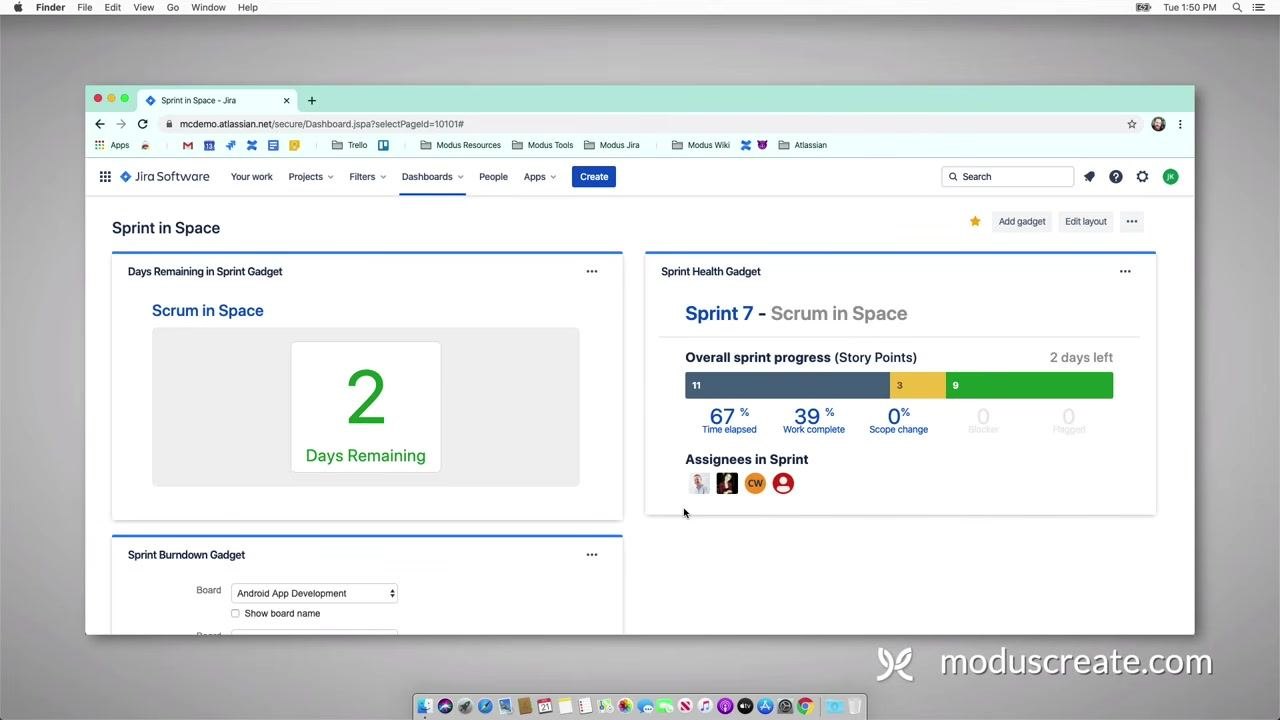
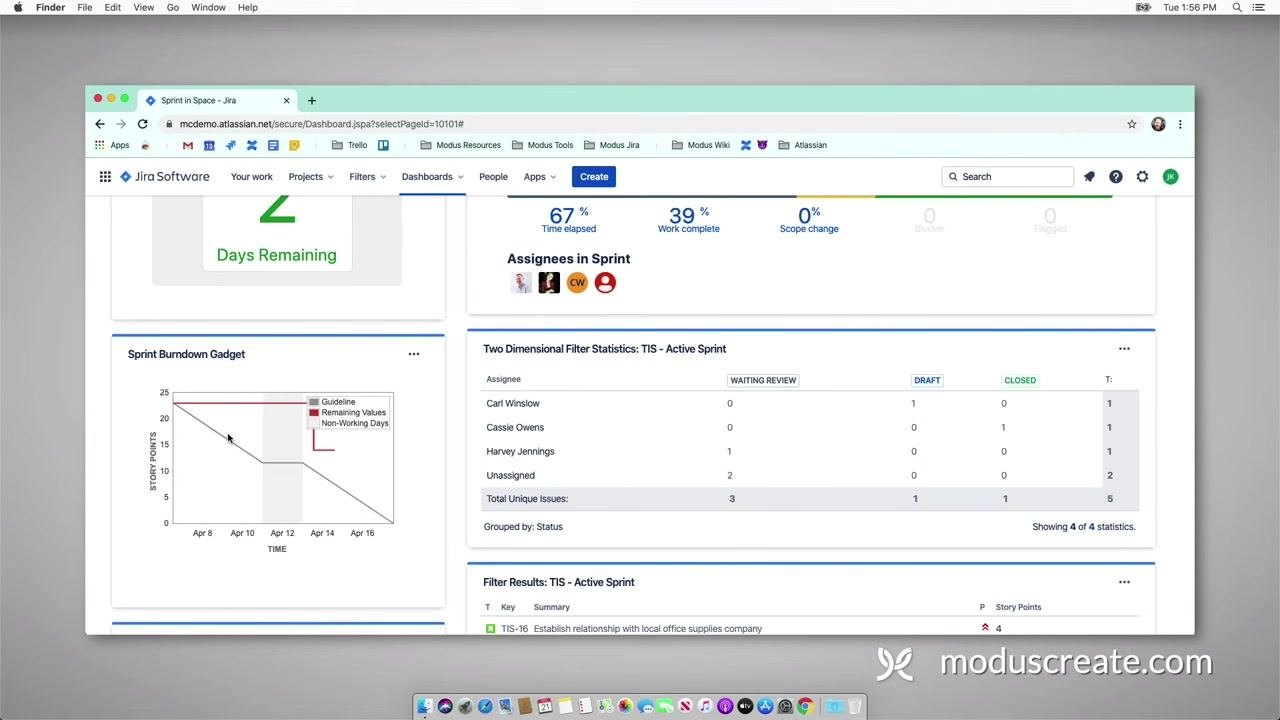
- Note that the Sprint Health gadget displays overall sprint progress in story points (11 points, 67% time elapsed, 39% work complete, 0% scope change), assignees in the sprint with their avatars, and the number of days left in the sprint (2 days).
Configure the Pie Chart gadget
- In the Pie Chart gadget, click the Search field under "Project or Saved Filter."
- Enter or select the filter for your current sprint, for example, TIS - Active Sprint.
- Ensure Statistic Type is set to Assignee.
- Optionally, check Update every 15 minutes for auto-refresh.
- Click Save to apply the configuration.
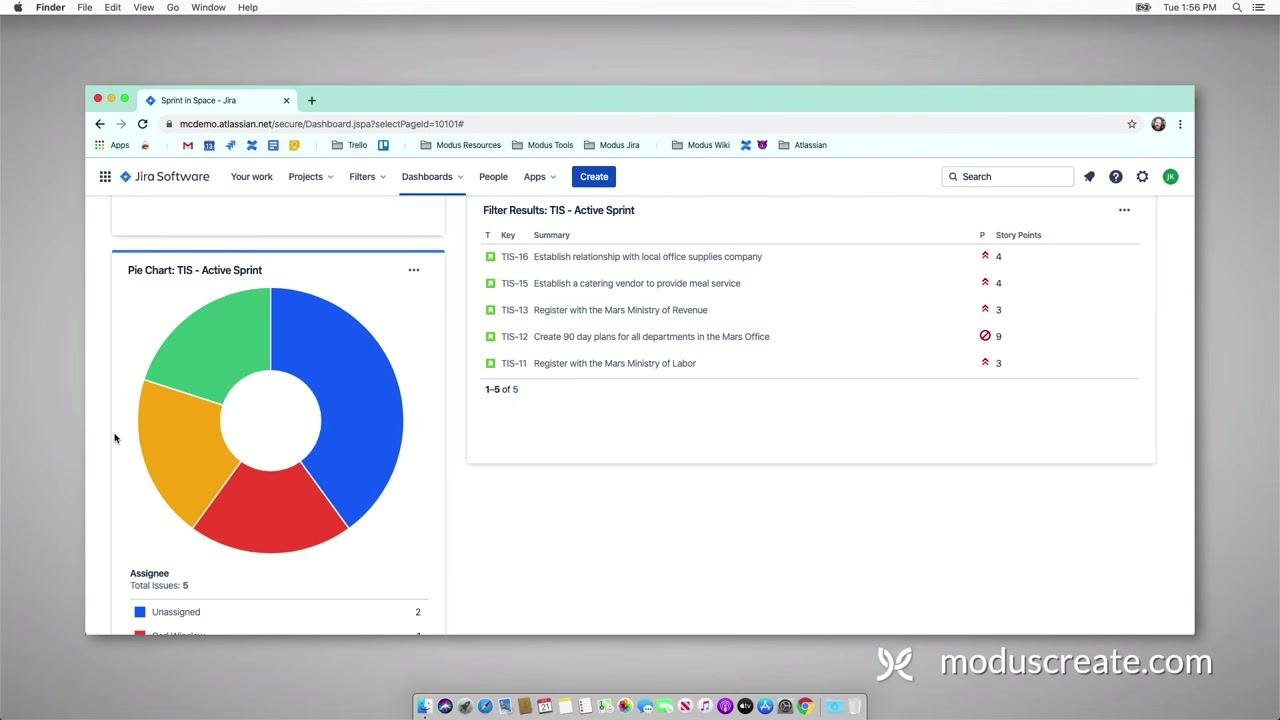
- Confirm that the Pie Chart gadget now uses the "TIS - Active Sprint" filter. The gadget will display a pie chart breaking down issues by assignee for the current sprint.
Review the Days Remaining and Sprint Health gadgets
- Check the Days Remaining in Sprint Gadget, which shows the number of days left (for example, "2 Days Remaining").
- Confirm that the Sprint Health Gadget continues to display sprint progress and assignees.
Configure the Two Dimensional Filter Statistics gadget
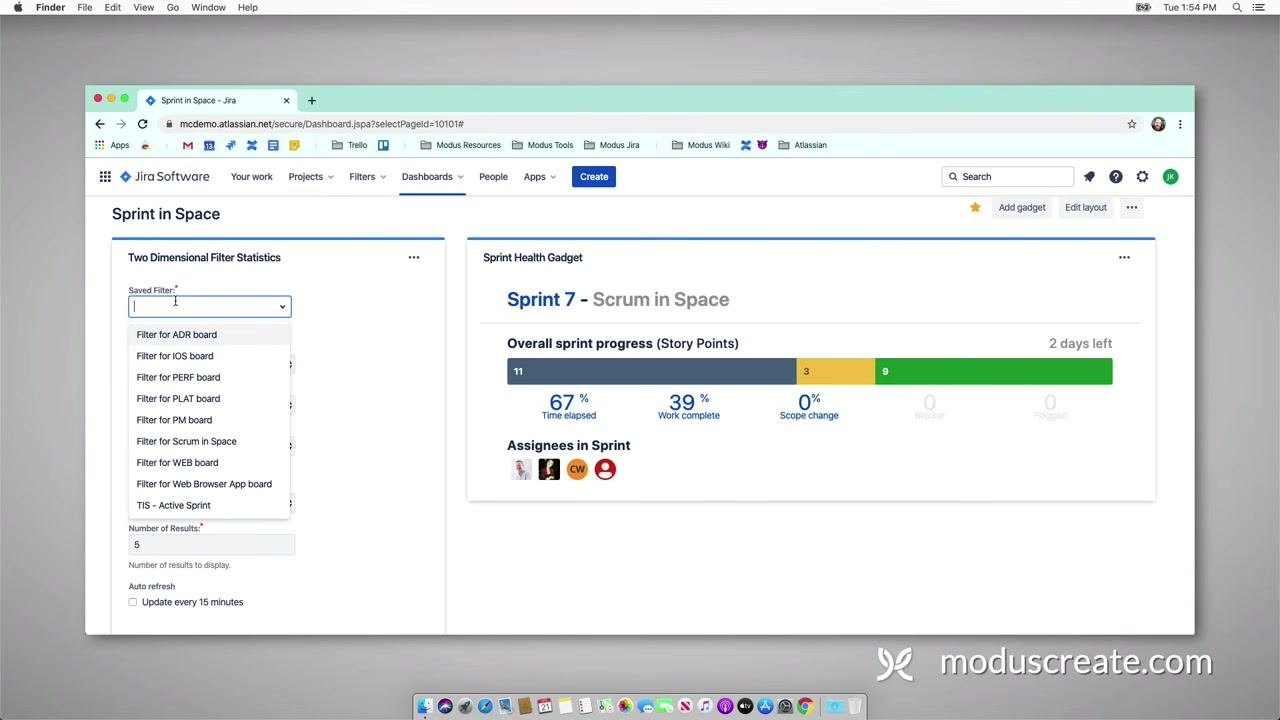
- Locate the Two Dimensional Filter Statistics gadget on your dashboard.
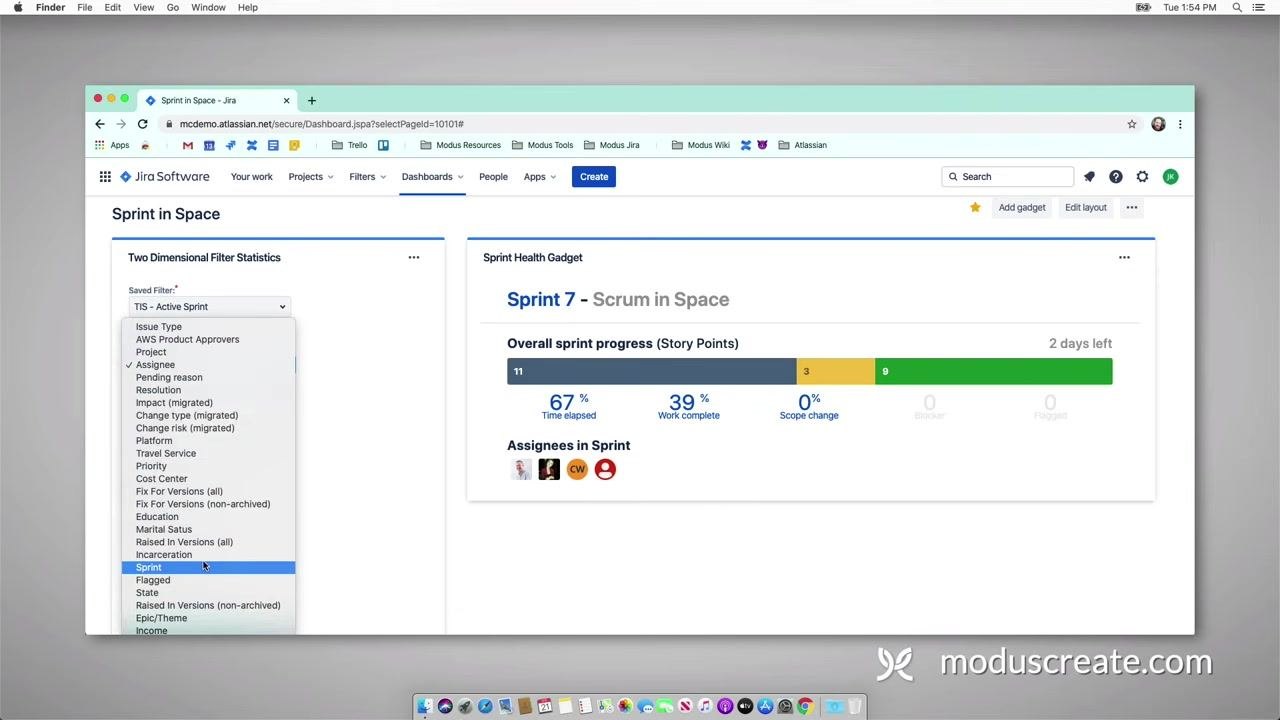
- In the Saved Filter dropdown, select TIS - Active Sprint.
- In the next dropdown, choose the first dimension (for example, Assignee).
- In the second dropdown, select the second dimension (for example, Sprint or another relevant field).
- Set the Number of Results (for example, 5).
- Optionally, enable Update every 15 minutes.
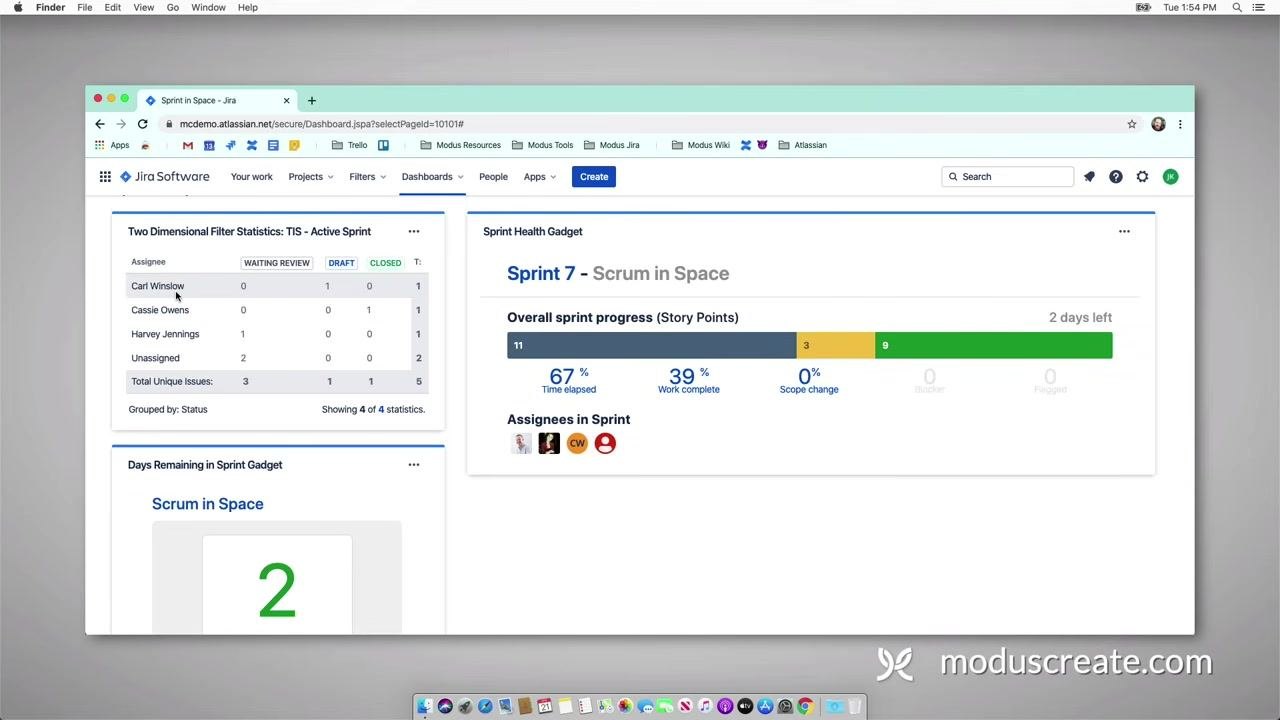
- After configuration, review the gadget's output table, which breaks down issues by Assignee and Status (for example, WAITING REVIEW, DRAFT, CLOSED). In the example:
- Carl Winslow: 1 Draft, 1 Closed
- Cassie Owens: 1 Closed
- Harvey Jennings: 1 Closed
- Unassigned: 2 Waiting Review, 1 Draft, 2 Total
- Note that the table is grouped by status and shows the total number of unique issues.
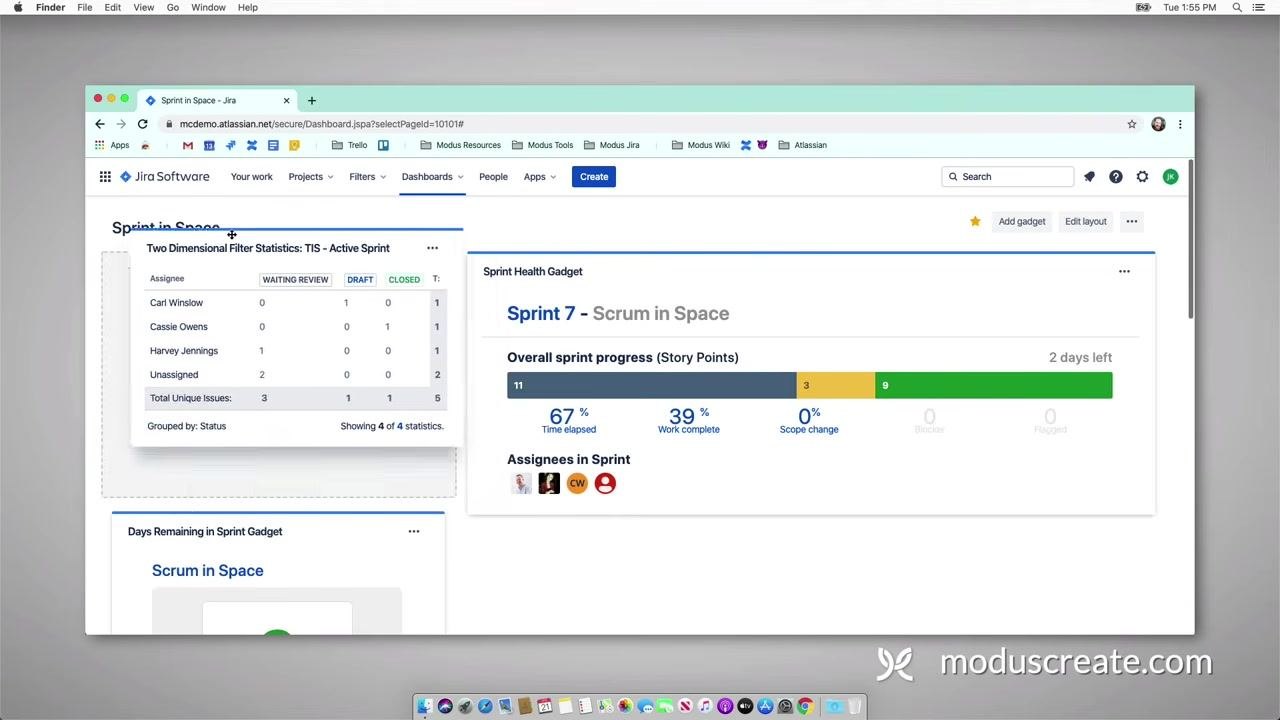
- Drag and arrange gadgets as needed for optimal visibility, and review the dashboard to confirm all gadgets display the correct data for the current sprint.
At this point, your dashboard provides a comprehensive overview of sprint progress, issue breakdown by assignee and status, and days remaining.
Add the Filter Results gadget
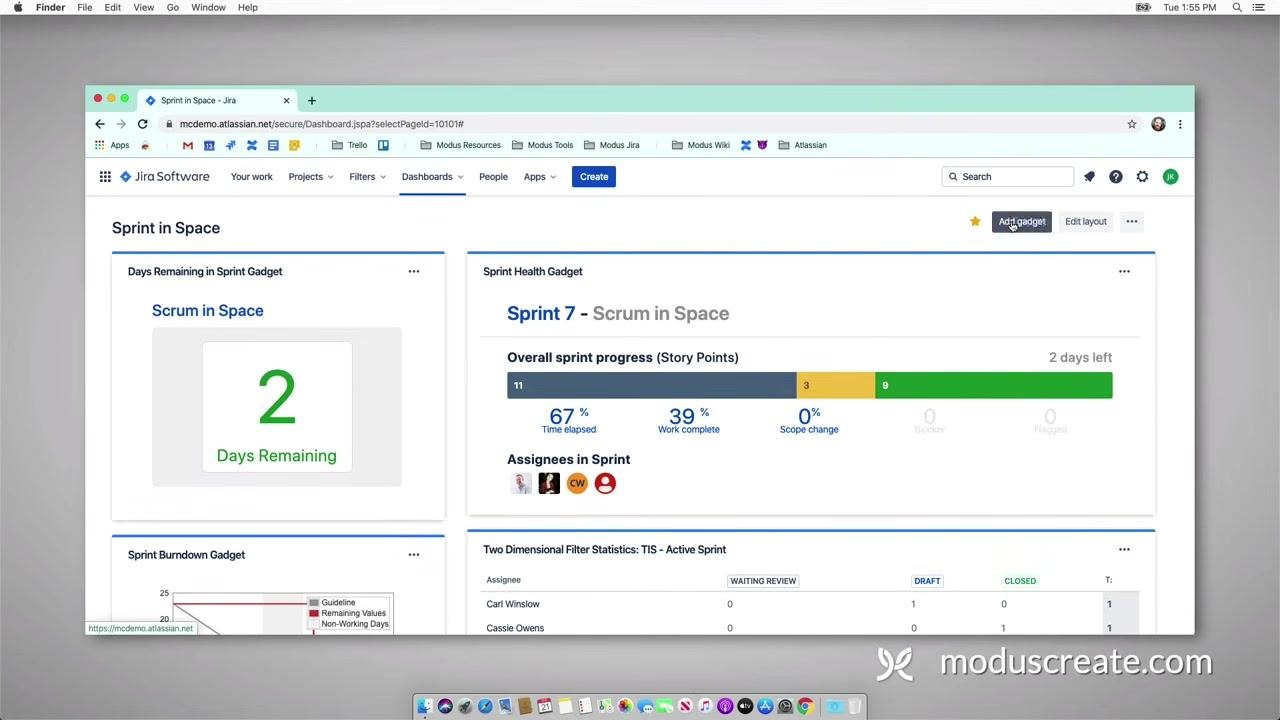
- On your Jira dashboard, click the Add gadget button at the top right of the dashboard screen.
- In the gadget selection menu, locate and add the Filter Results gadget to your dashboard.
Configure the Filter Results gadget
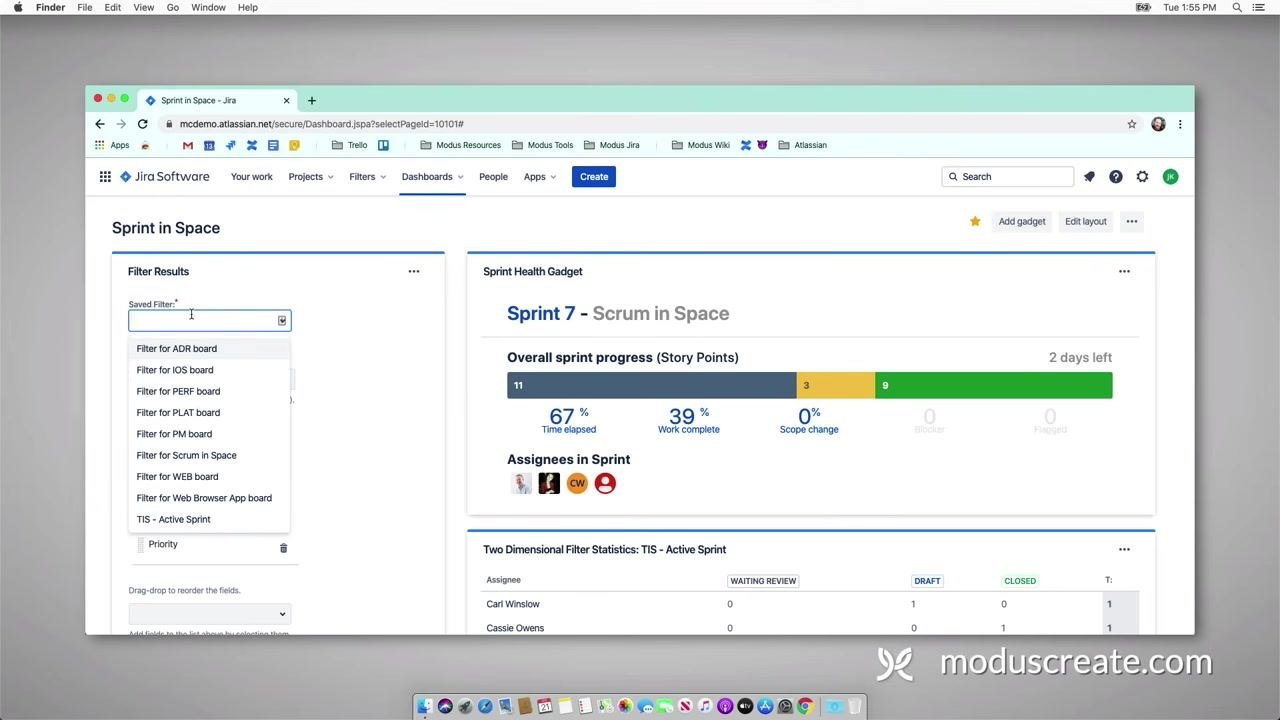
- In the Filter Results gadget, click the Saved Filter dropdown.
- Select the filter for your current sprint, for example, TIS - Active Sprint. The dropdown lists available filters such as "Filter for ADR board," "Filter for iOS board," "Filter for Scrum in Space," and "TIS - Active Sprint."
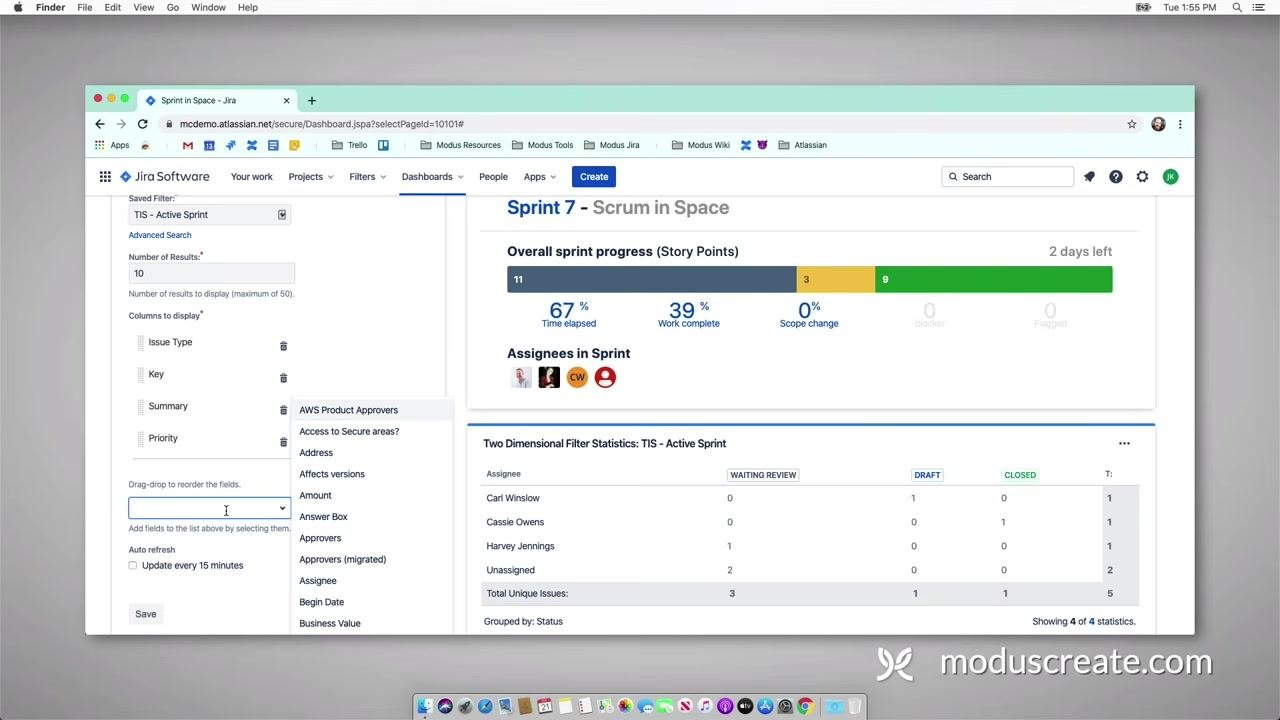
- Enter the Number of Results to display (for example, 10).
- In the Columns to display section, select the fields you want to show, such as:
- Issue Type
- Key
- Summary
- Priority
- Optionally, add more fields such as Story Points by selecting them from the dropdown.
- Drag and drop fields to reorder them as needed.
- Optionally, check Update every 15 minutes to enable auto-refresh.
- Click Save to apply your configuration.
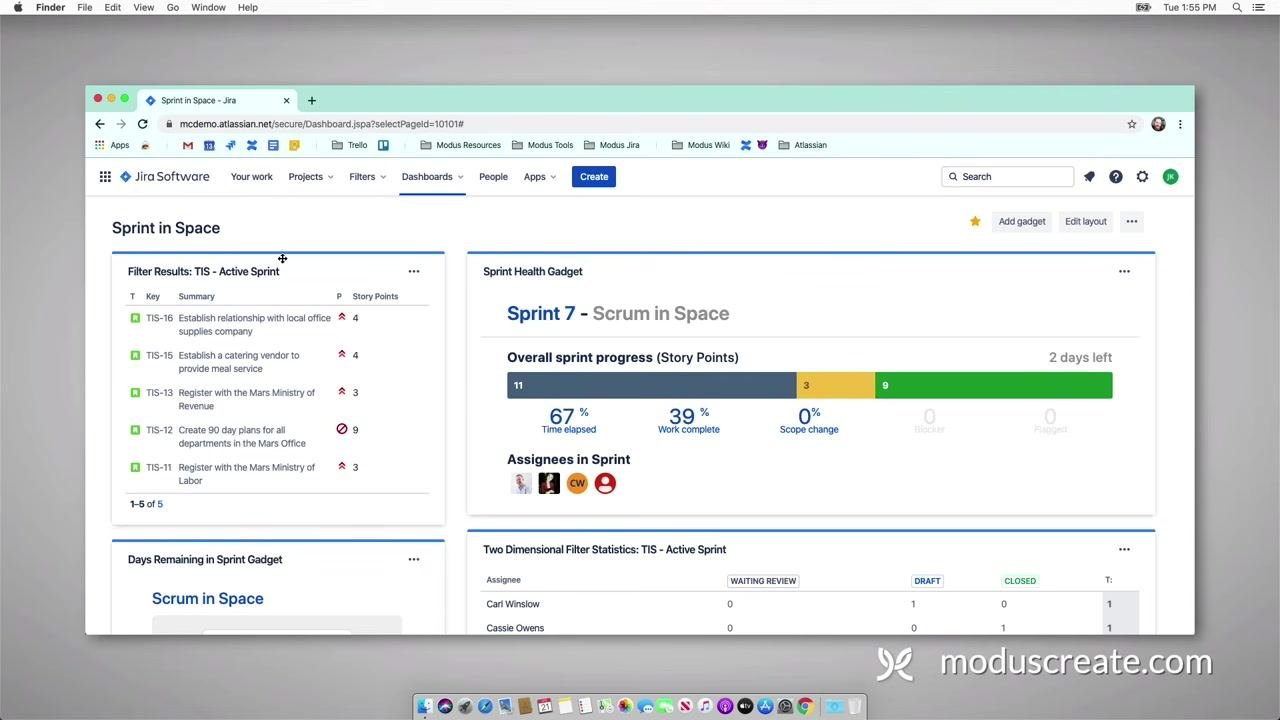
- Review the gadget's output, which now displays a list of issues for the active sprint with the selected columns. In the example, the Key column shows TIS-16, TIS-15, TIS-13, TIS-12, and TIS-11, with corresponding summaries and story points of 4, 4, 3, 9, and 3. This list provides a clear, sortable view of sprint issues and their details.
Review your completed dashboard
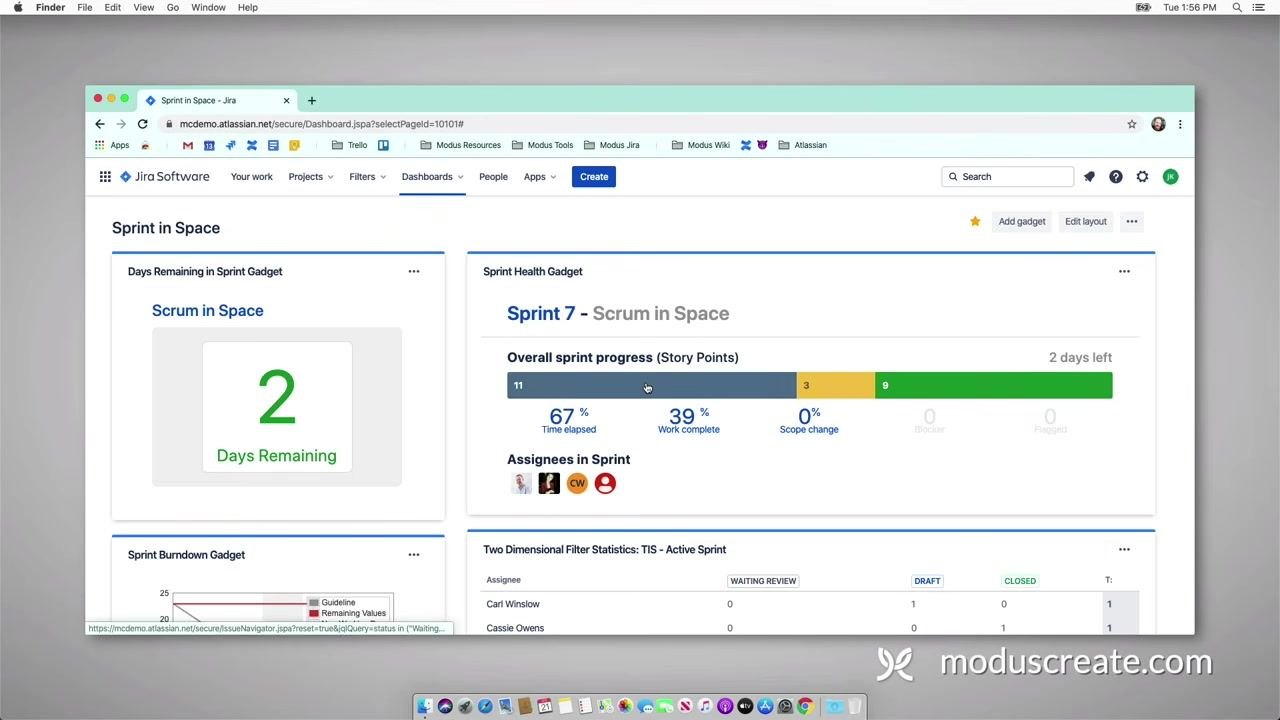
Observe the dashboard with all configured gadgets in place:
- Days Remaining in Sprint Gadget (shows days left)
- Sprint Health Gadget (shows sprint progress and assignees)
- Sprint Burndown Gadget (shows progress against sprint timeline)
- Two Dimensional Filter Statistics Gadget (breakdown by assignee and status)
- Pie Chart Gadget (issue distribution by assignee)
- Filter Results Gadget (detailed issue list)
The dashboard now provides a comprehensive overview of sprint status, workload, and progress.
Getting help
If your team is new to Jira, has been using Jira for a while, or wants to maximize the value from the application, consider reaching out for expert guidance and support.
What's next
By following these steps, you now have a Jira dashboard that visualizes sprint progress, workload distribution, and days remaining, while also providing detailed, actionable lists of sprint issues. For further assistance or to optimize your Jira setup, consider reaching out to a Jira expert or your Jira administrator.

Generation details: cost, quality tiers
Docsie billed 4,500 credits ($3.15) to analyze this 9-minute video at standard quality. The rewrite, template fill and Word/PDF exports were included. The same video at each quality tier:
| Quality | Frames sampled | Credits | Approx. cost |
|---|---|---|---|
| Draft | every 16-30 s | 2,250 | $1.57 |
| Standard (this guide) | every 8-15 s | 4,500 | $3.15 |
| Detailed | every 4-7 s | 9,000 | $6.30 |
| Ultra | every 1-3 s | 18,000 | $12.60 |
Credits priced at $0.70 per 1,000; plans include a monthly allowance. Enterprise customers on on-premise or bring-your-own-model deployments run this on their own inference and pay no per-video credits.
Generated by Docsie Video-to-Docs on 2026-09-08 from a 8-minute video. Screenshots are frames from the source video and belong to their creator, Modus Create, whose original is embedded above. If you own this video and want the guide removed or credited differently, contact us and we will act within one business day.