
How to Read an EKG Strip
Learning how to read an EKG strip becomes much easier once you understand the heart's electrical pathway, recognize each waveform, and apply a consistent measurement method. This guide walks you through the heart's conduction system, EKG waveform basics, segment and interval measurements, and a repeatable six-step interpretation method. Follow the steps in order to build a reliable process you can use on any EKG strip you encounter in clinical practice or on the NCLEX.
Video: ECG Interpretation Made Easy: 6 Simple Steps for Nursing Students | Mini Lesson Series by SimpleNursing (2025). All credit for the demonstration goes to the creator; watch the original on YouTube. The written guide below was generated from this video by Docsie. Creator? Request a change or removal.
Learning how to read an EKG strip becomes much easier once you understand the heart's electrical pathway, recognize each waveform, and apply a consistent measurement method. This guide walks you through the heart's conduction system, EKG waveform basics, segment and interval measurements, and a repeatable six-step interpretation method. Follow the steps in order to build a reliable process you can use on any EKG strip you encounter in clinical practice or on the NCLEX.
Purpose
This procedure explains how to interpret an EKG (electrocardiogram) strip from start to finish. It covers the heart's conduction system, the waveforms that appear on a strip, the segments and intervals you must measure, and a six-step method for reaching a final interpretation. The terms EKG and ECG refer to the same test and are used interchangeably throughout this guide.
Scope
This procedure applies to anyone learning EKG/ECG interpretation, including nursing students and new graduates preparing for clinical practice or the NCLEX exam. It covers normal sinus rhythm along with the nine core rhythms commonly tested on the NCLEX:
- Normal sinus rhythm
- Bradycardia
- Ventricular fibrillation (V-Fib)
- Ventricular tachycardia (V-Tach)
- Atrial fibrillation (A-Fib)
- Atrial flutter (A-Flutter)
- SVT (Supraventricular Tachycardia)
- Torsades de Pointes
- Asystole (Flatline)

Required materials
- An EKG strip or EKG paper to analyze
- A copy of the free EKG Rhythms Cheat Sheet for quick reference to common rhythms
- Familiarity with the fact that EKG and ECG are the same test
Procedure
Part 1: Review reference charts before you begin
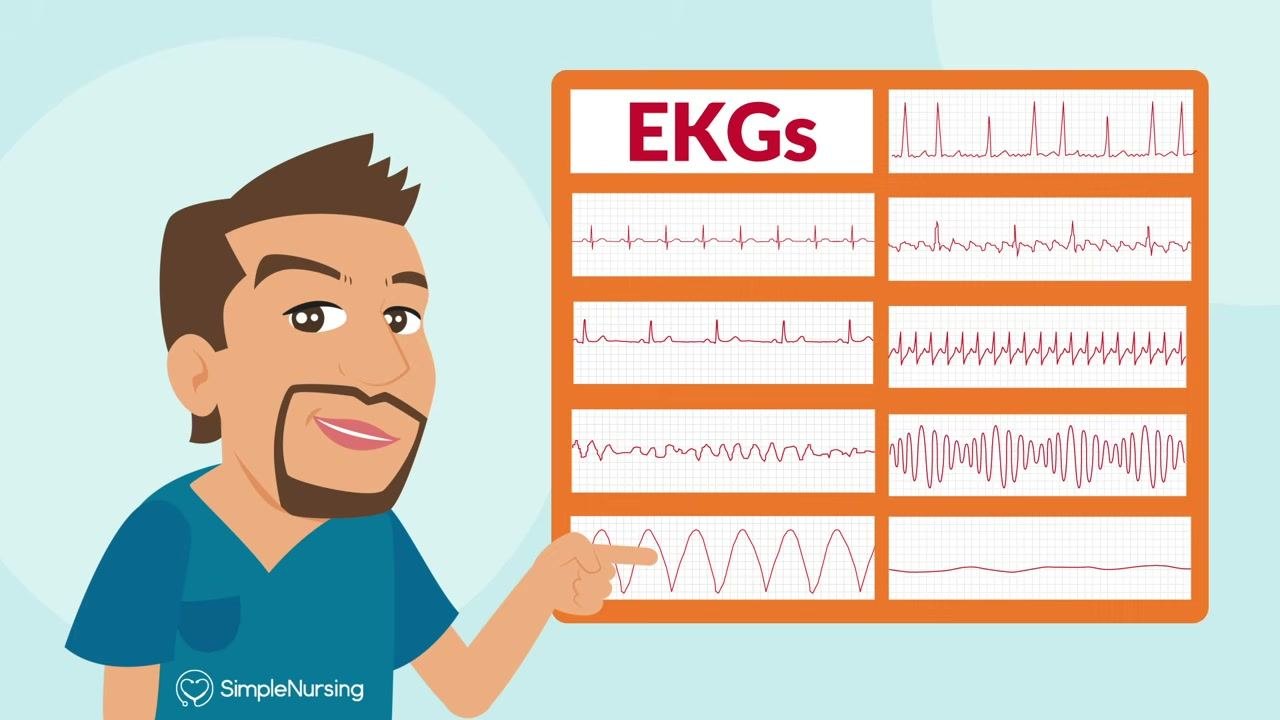
Step 1 — Compare common EKG patterns. Before interpreting a specific strip, review a reference chart that shows several EKG rhythms side by side. Each strip on the chart displays a distinct pattern, which lets you compare shapes before analyzing real data.
Step 2 — Set the right mindset. Approach EKG interpretation as a skill you can master with practice rather than an obstacle. A reference monitor displaying a regular rhythm shows what a normal, healthy pattern looks like on screen.

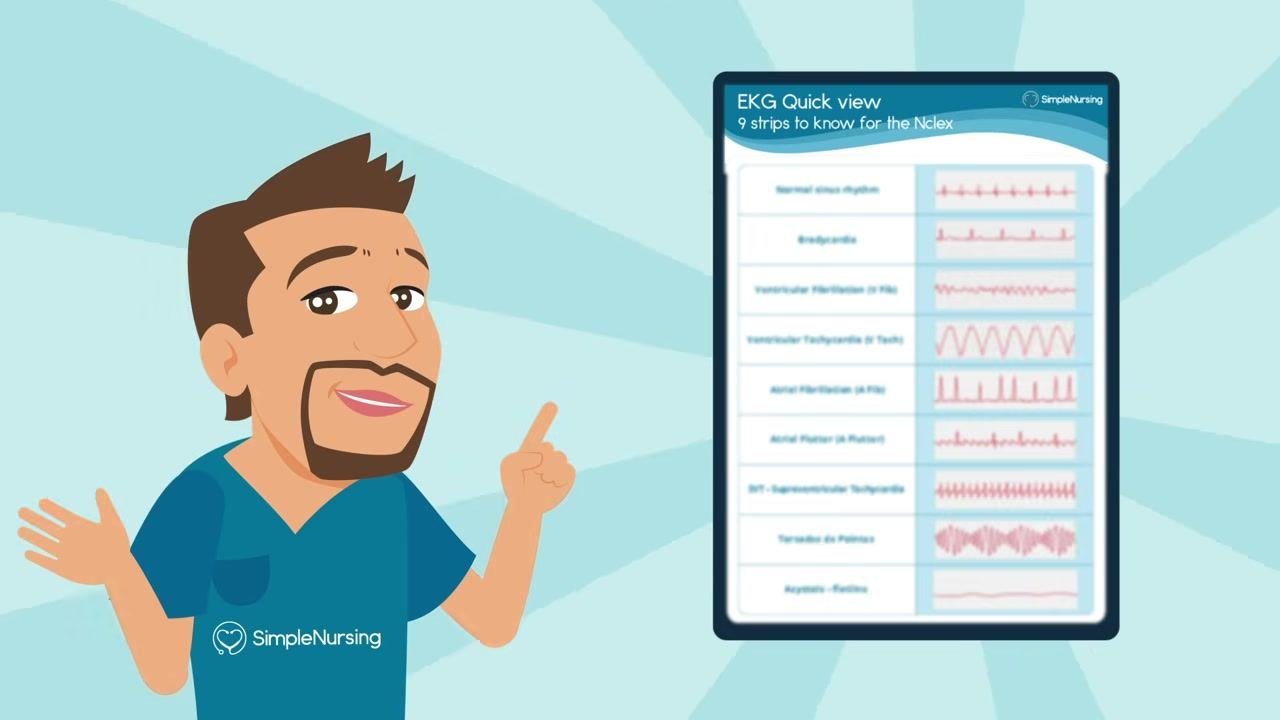
Step 3 — Review the nine NCLEX strips. Use the EKG Quick View: 9 strips to know for the NCLEX chart to match each rhythm name with its waveform: normal sinus rhythm, bradycardia, V-Fib, V-Tach, A-Fib, A-Flutter, SVT, Torsades de Pointes, and asystole.
Part 2: Understand the heart's conduction system
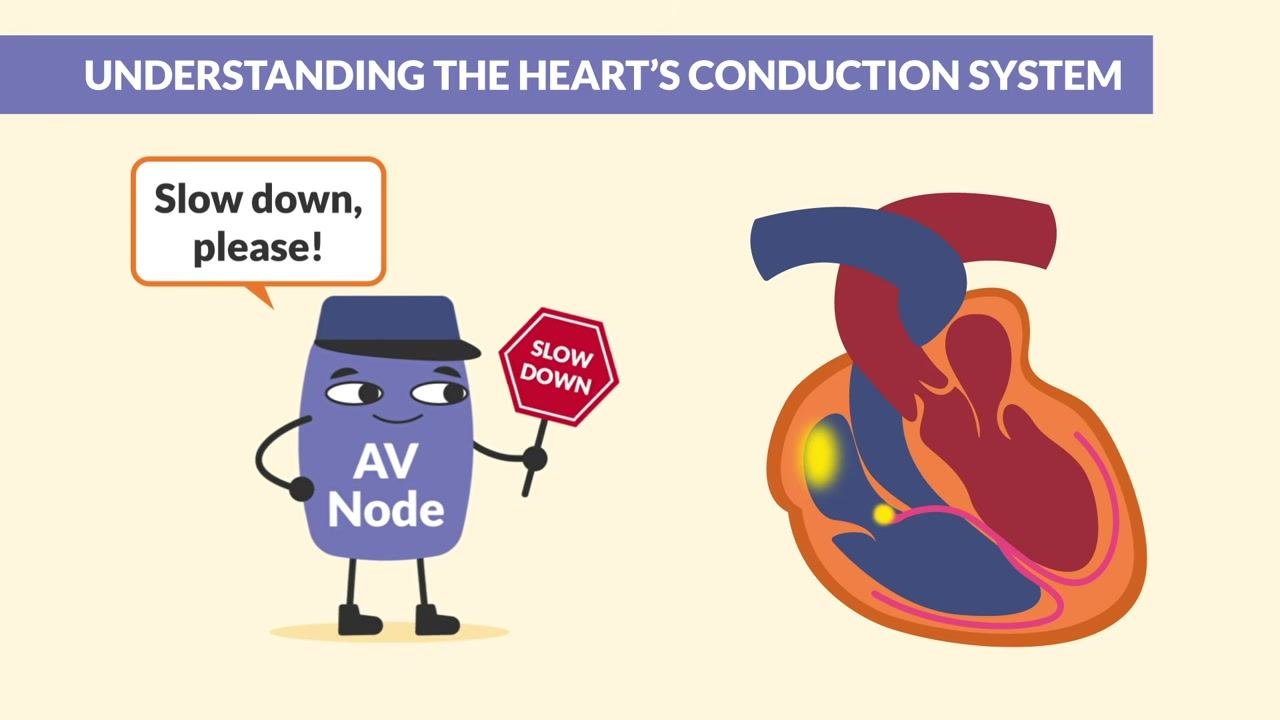
Step 4 — Start with the basics. Before reading a strip, understand how the heart's electrical pathway works. The conduction system is the electrical circuit that controls each heartbeat, and it is the foundation for everything you see on an EKG strip.

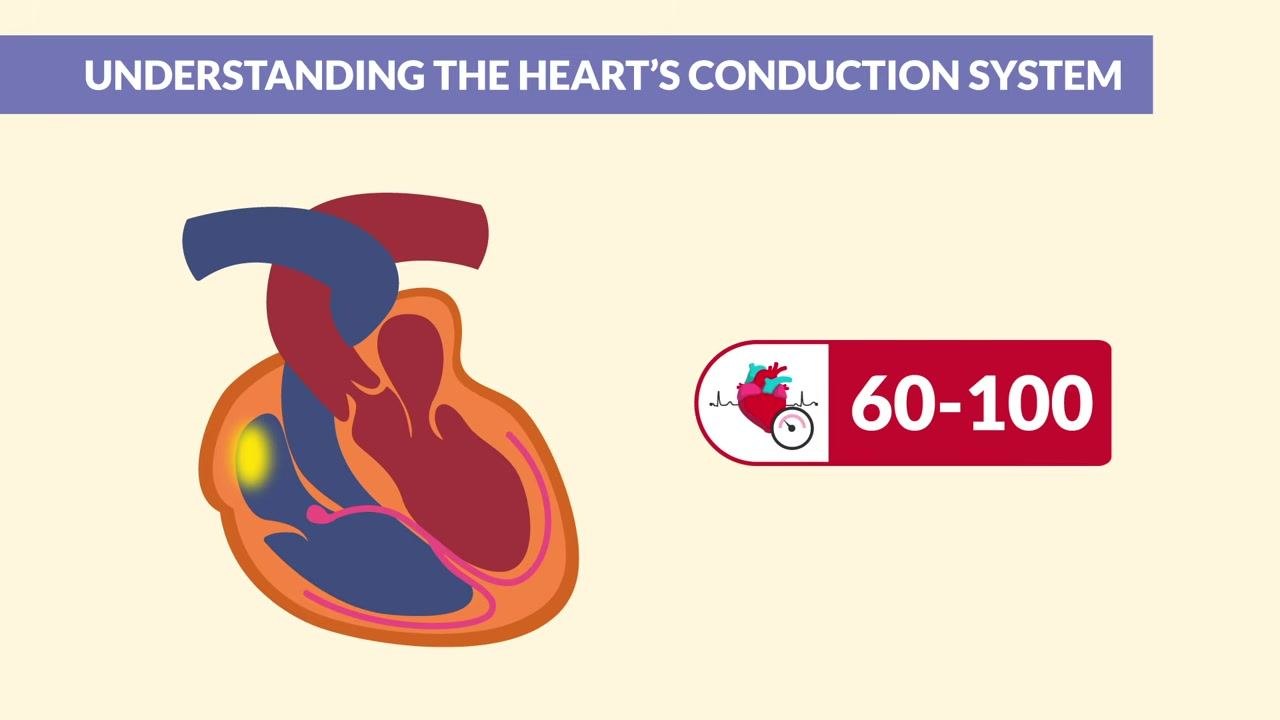
Step 5 — Follow the signal from the SA node. Think of the heart's electrical flow as a route on a map. The journey begins at the SA node (sinoatrial node), the heart's natural pacemaker, located in the right atrium.
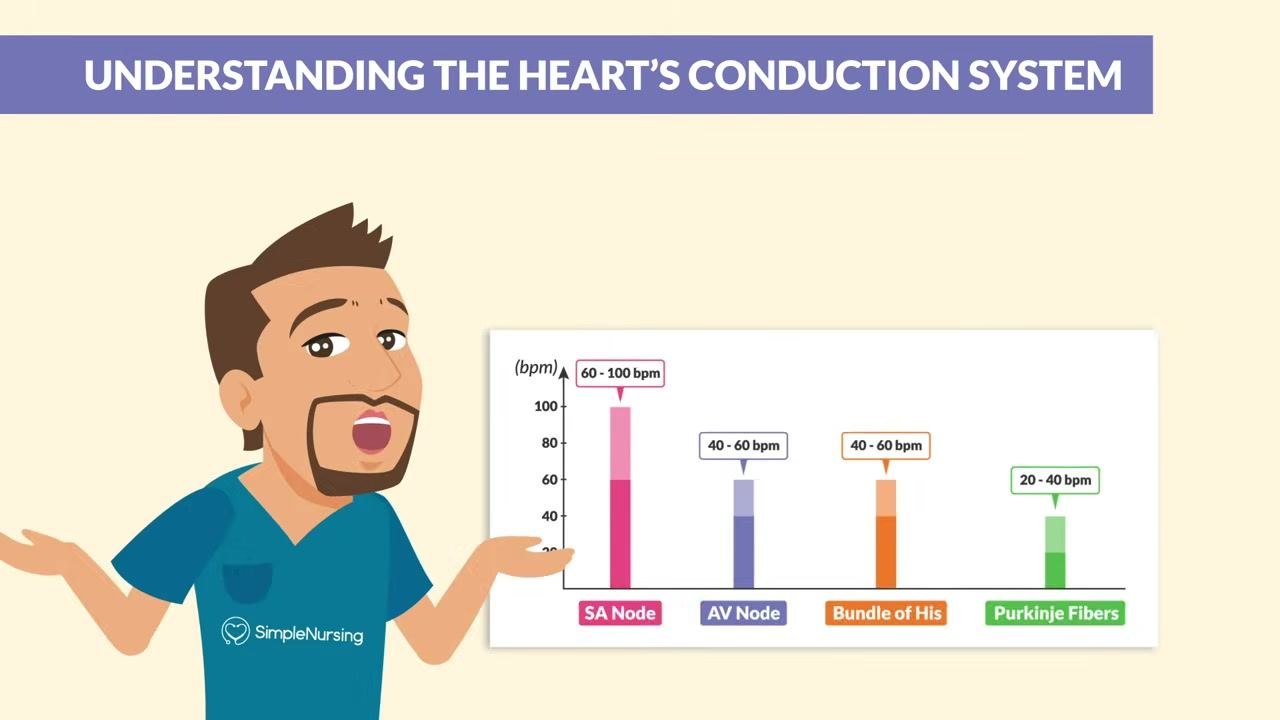
Step 6 — Note the SA node's normal rate. The SA node initiates the heartbeat signal and normally fires at 60–100 beats per minute, setting the pace for the rest of the heart.
Step 7 — Identify the AV node's role. After the SA node, the signal travels to the AV node (atrioventricular node), which acts as a gatekeeper. It slows the signal so the atria can fully contract before the ventricles are activated.
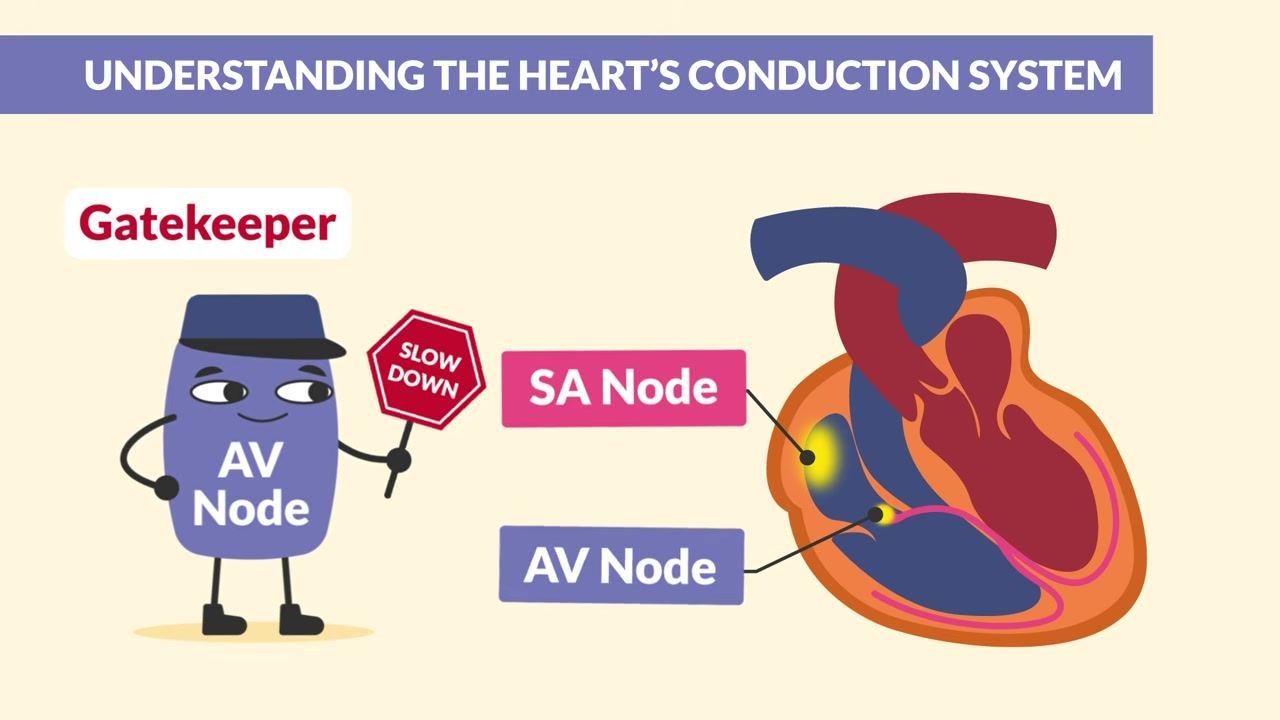
Step 8 — Pass the signal to the ventricles. Once the AV node slows the signal, it passes it along to the ventricles for coordinated contraction.
Step 9 — Recognize the Bundle of His. The signal then speeds through the Bundle of His, the only electrical connection between the atria and ventricles. This structure is a commonly tested topic on the NCLEX exam.
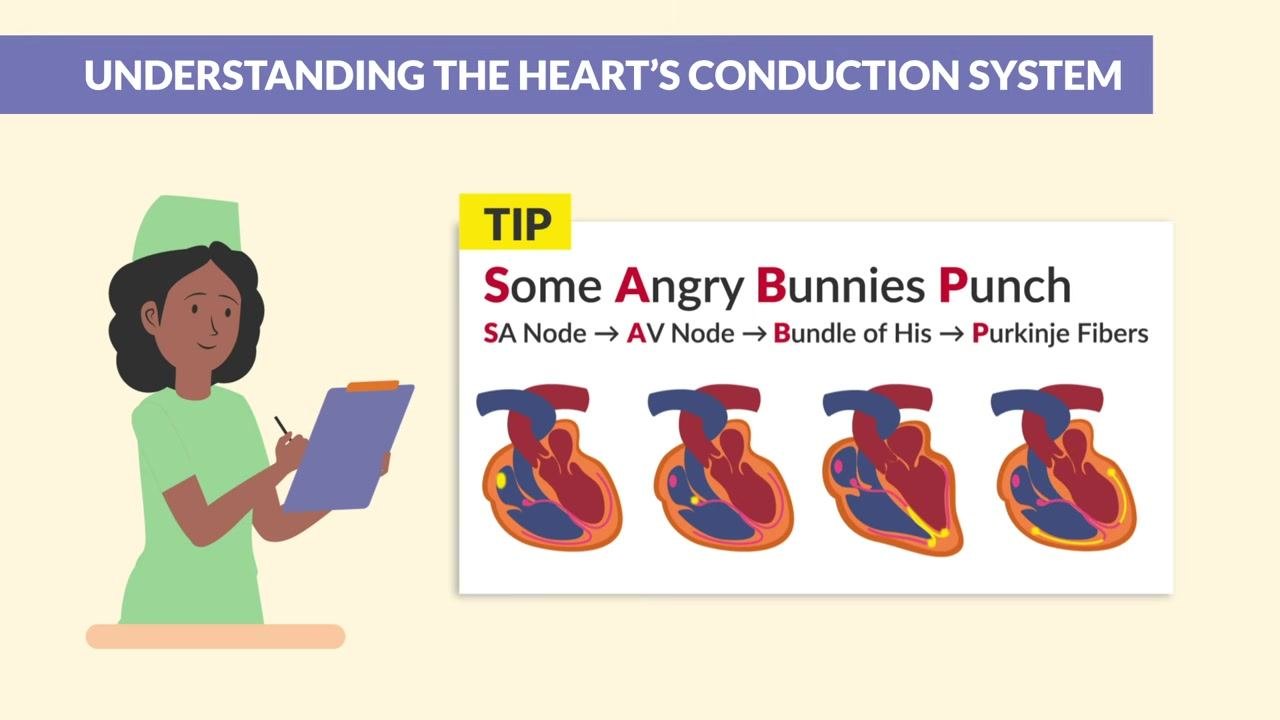
Step 10 — Trace the signal to the Purkinje fibers. The signal travels down the right and left bundle branches and reaches the Purkinje fibers, preparing the heart to pump efficiently.
Step 11 — Memorize the conduction order. Use the mnemonic "Some Angry Bunnies Punch" to remember the sequence: S = SA node, A = AV node, B = Bundle of His, P = Purkinje fibers. Repeat it aloud to reinforce the order.
Step 12 — Memorize the intrinsic firing rates. Each part of the conduction system fires at a different rate: SA node 60–100 bpm, AV node 40–60 bpm, Bundle of His 40–60 bpm, and Purkinje fibers 20–40 bpm. These rates are essential for interpretation and frequently tested.
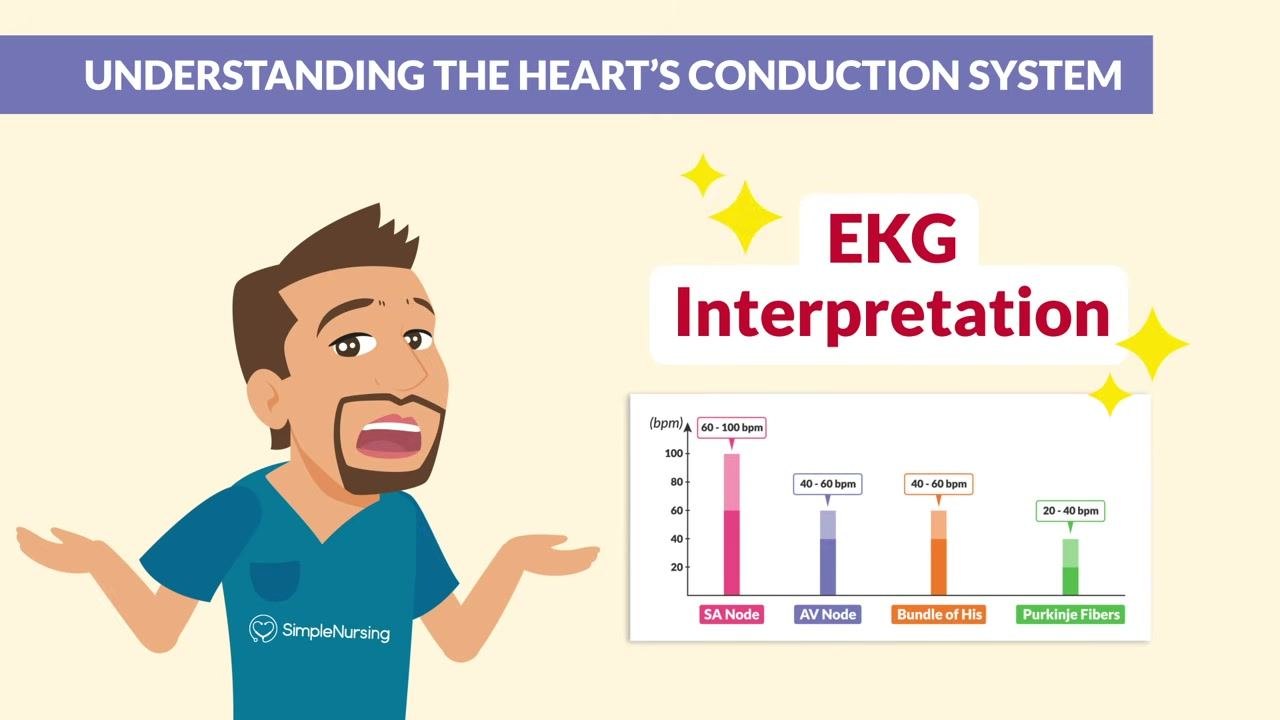
Step 13 — Keep these rates handy. Store this information for quick recall during exams and clinical practice, since knowing these rates is essential for mastering EKG interpretation.
Part 3: Learn EKG waveform basics
Step 14 — Identify the P wave. The P wave is the first waveform you see on a strip. "P" stands for atrium, and this wave represents atrial depolarization — the electrical signal that triggers atrial contraction.
Step 15 — Confirm the P wave's meaning. Review a labeled EKG diagram showing the P wave highlighted, with the atria marked as the source of the signal for "Atrial Depolarization."
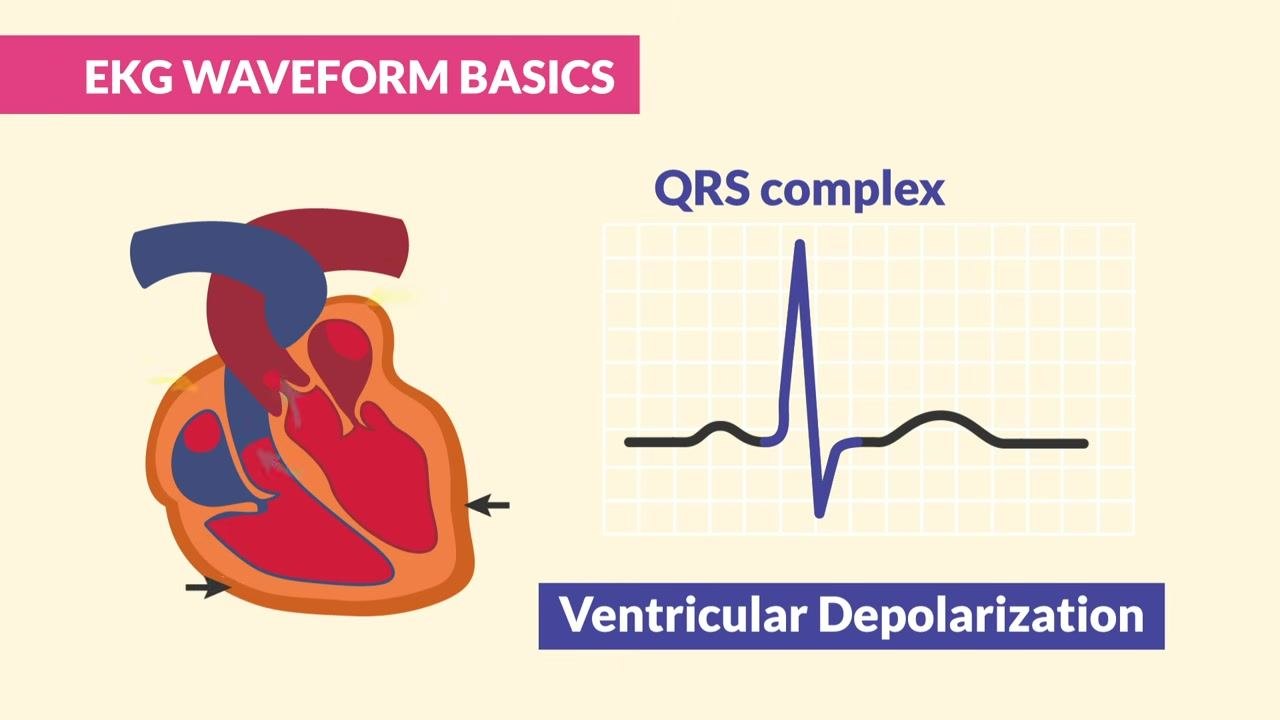
Step 16 — Identify the QRS complex. After the P wave, the QRS complex appears, representing ventricular depolarization — the contraction or squeezing of the ventricles. The QRS complex often forms a shape resembling a "V," a helpful cue since "V" stands for ventricles.
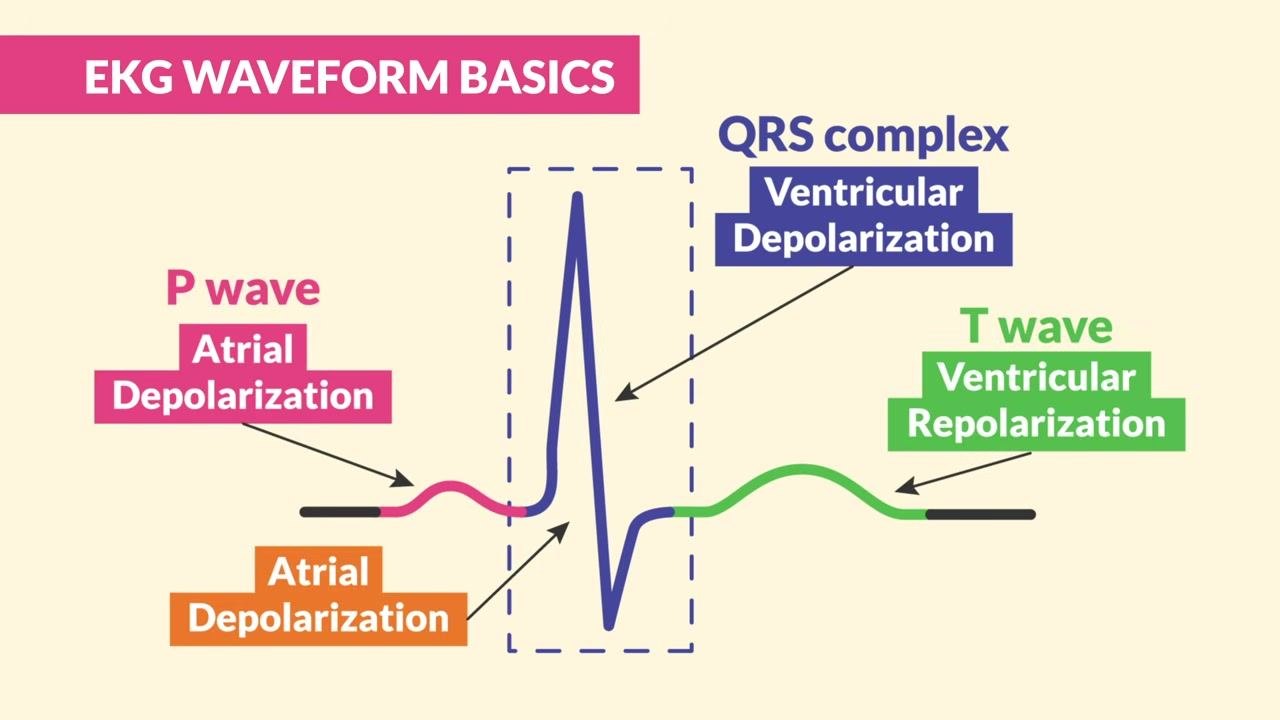
Step 17 — Reinforce the QRS shape. Use the visual cue that the QRS complex forms a "V" shape to remember that it represents ventricular activity.
Step 18 — Identify the T wave. The T wave follows the QRS complex and represents ventricular repolarization — the point where the ventricles relax and refill with blood before firing again.
Step 19 — Review the complete waveform. Note that atrial repolarization is not visible on the strip because the much larger electrical activity of the ventricles occurs at the same time and masks it. Review the full labeled diagram: P wave = Atrial Depolarization, QRS complex = Ventricular Depolarization, T wave = Ventricular Repolarization, with atrial repolarization not shown.
Part 4: Measure segments and intervals
Step 20 — Distinguish segments from intervals. Segments and intervals provide diagnostic clues about the heart's electrical activity. Segments are flat portions of the strip, while intervals measure the time between waves.
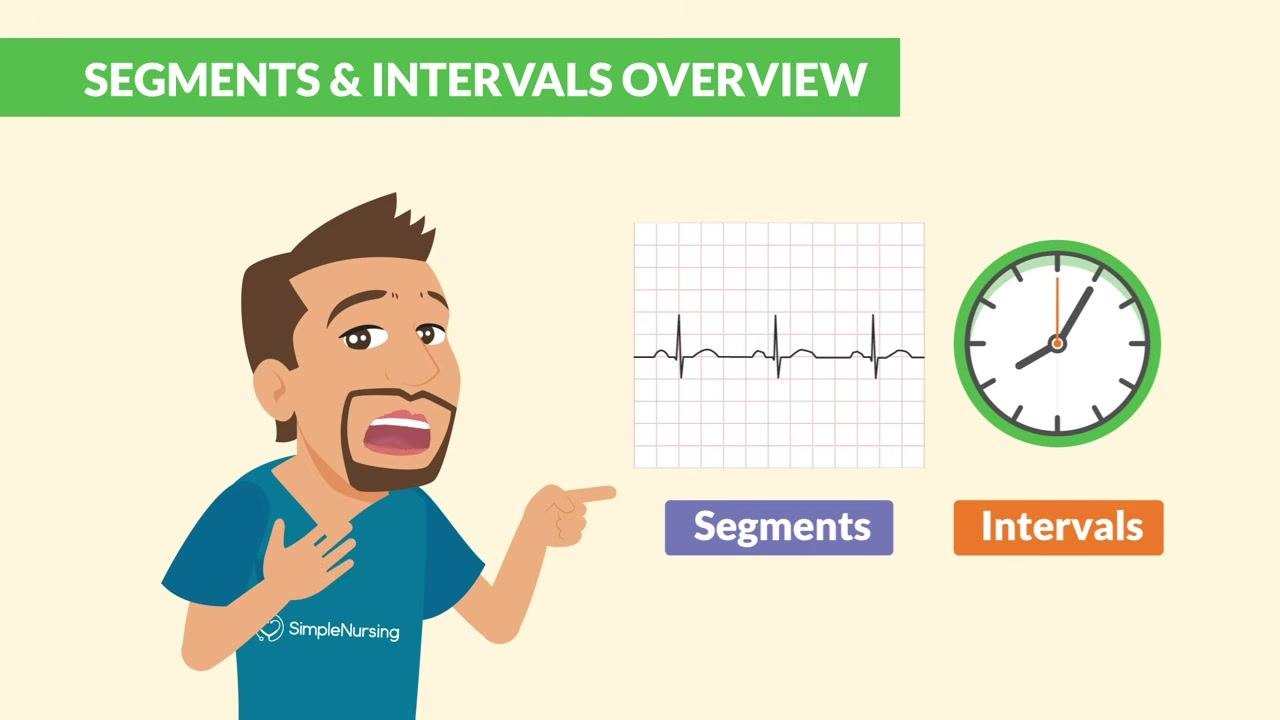
Step 21 — Locate the PR interval. Measure the PR interval from the start of the P wave to the start of the QRS complex. This is a key measurement every nurse should know.
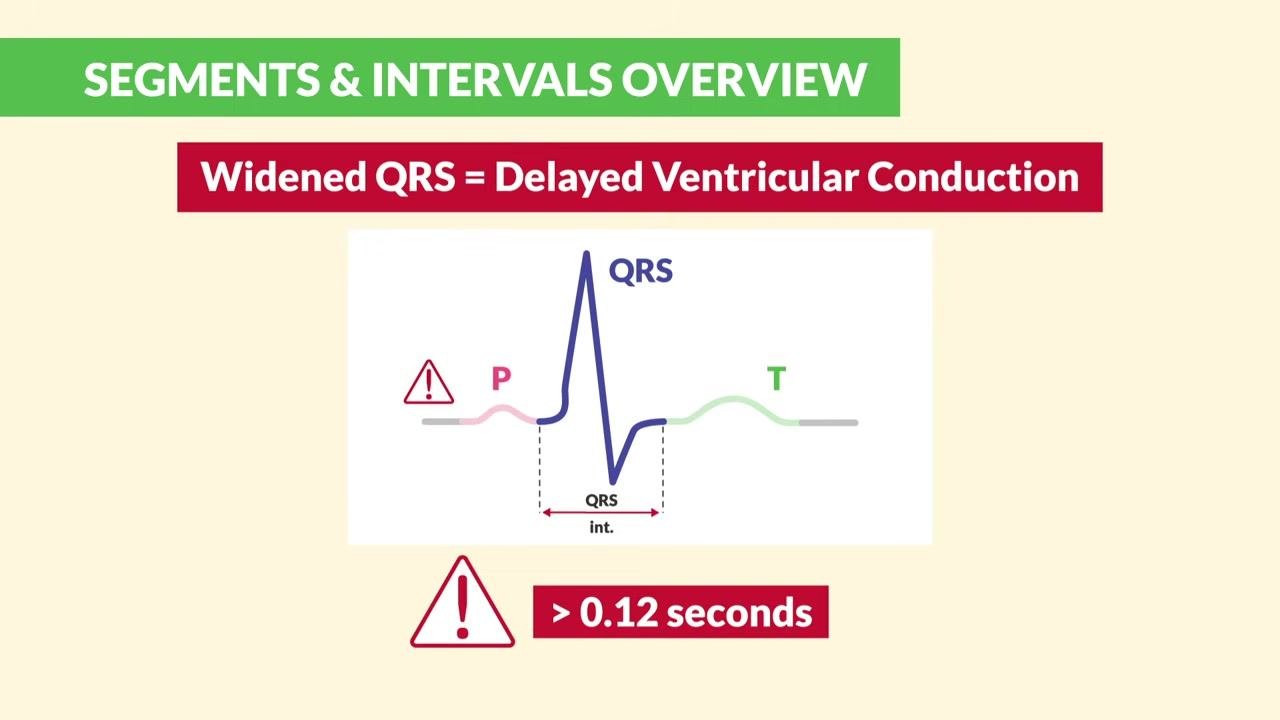
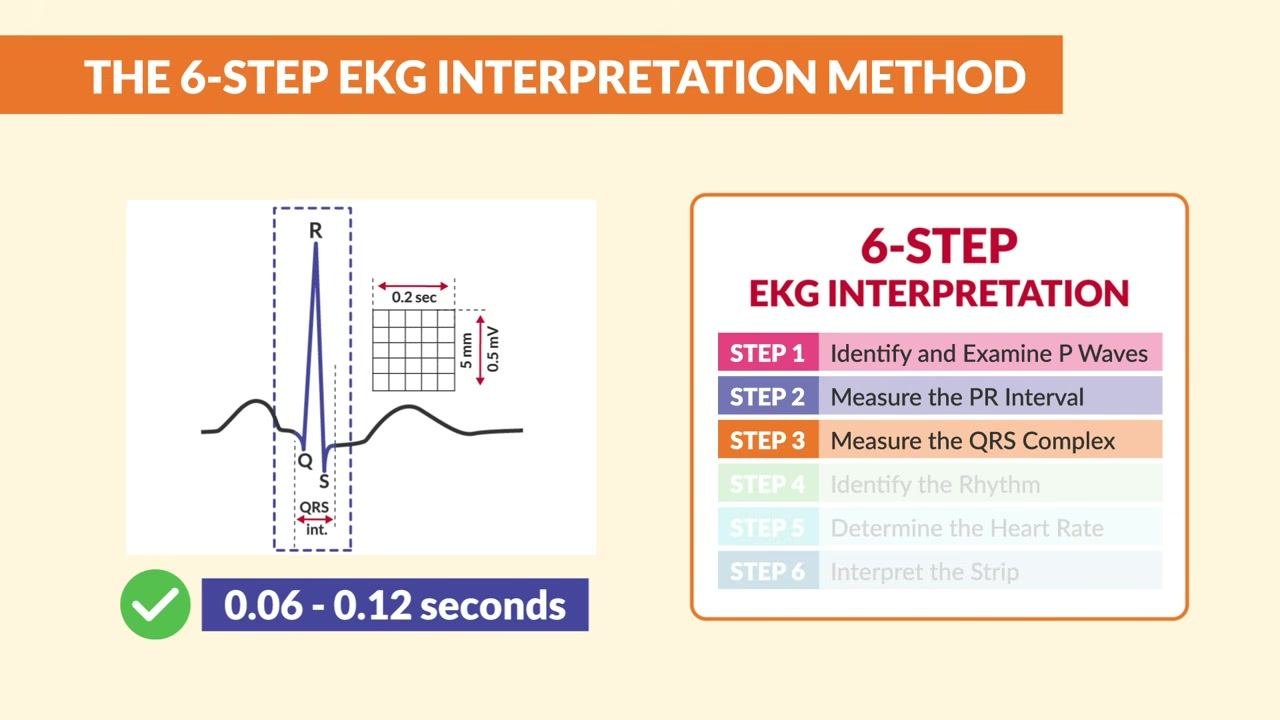
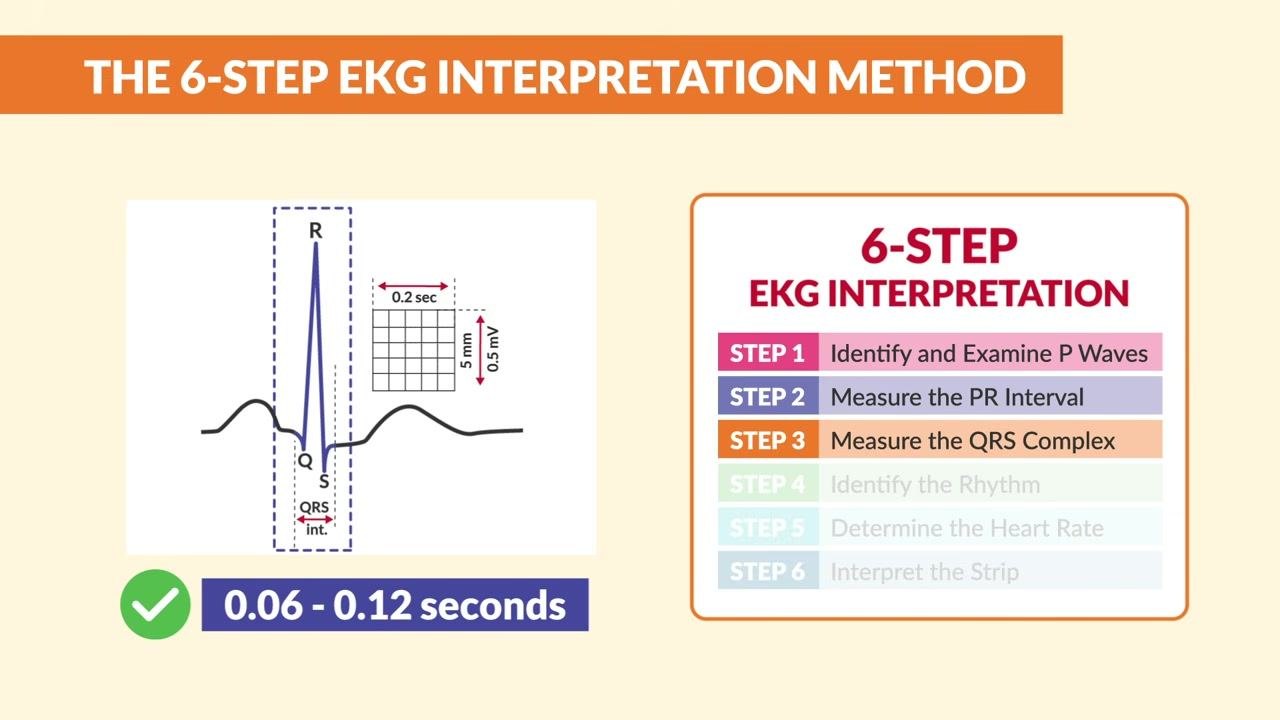
Step 22 — Memorize normal ranges. The normal PR interval is 0.12 to 0.20 seconds, and the normal QRS complex duration is 0.06 to 0.12 seconds. Any QRS complex greater than 0.12 seconds is considered wide and may indicate a problem.
Part 5: Identify widened QRS complexes
Step 23 — Recognize a widened QRS complex. A QRS complex wider than 0.12 seconds signals a significant delay in ventricular conduction.
Step 24 — Treat a widened QRS as a warning sign. A widened QRS complex indicates delayed ventricular conduction and can result from conditions such as bundle branch block or a premature ventricular contraction (PVC).
Step 25 — Apply the memory cue for a wide QRS. Remember a QRS complex that is "too wide" the same way you'd notice an oversized pair of cargo shorts — it stands out as abnormal. Compare this against EKG strips showing abnormal, wide QRS complexes.
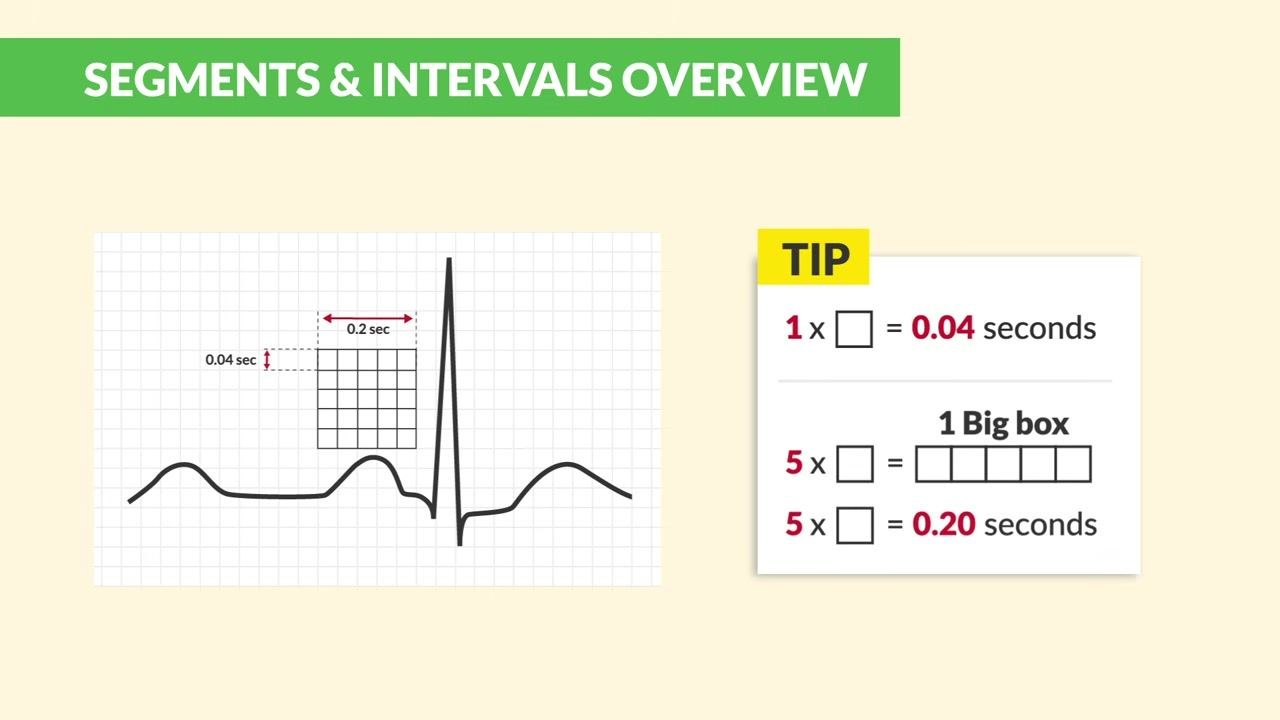
Step 26 — Measure intervals using the EKG paper grid. Each small box on EKG paper equals 0.04 seconds, and five small boxes make one big box, equal to 0.20 seconds. Use this grid to calculate the duration of any interval, including the QRS complex.
Part 6: Apply the six-step EKG interpretation method
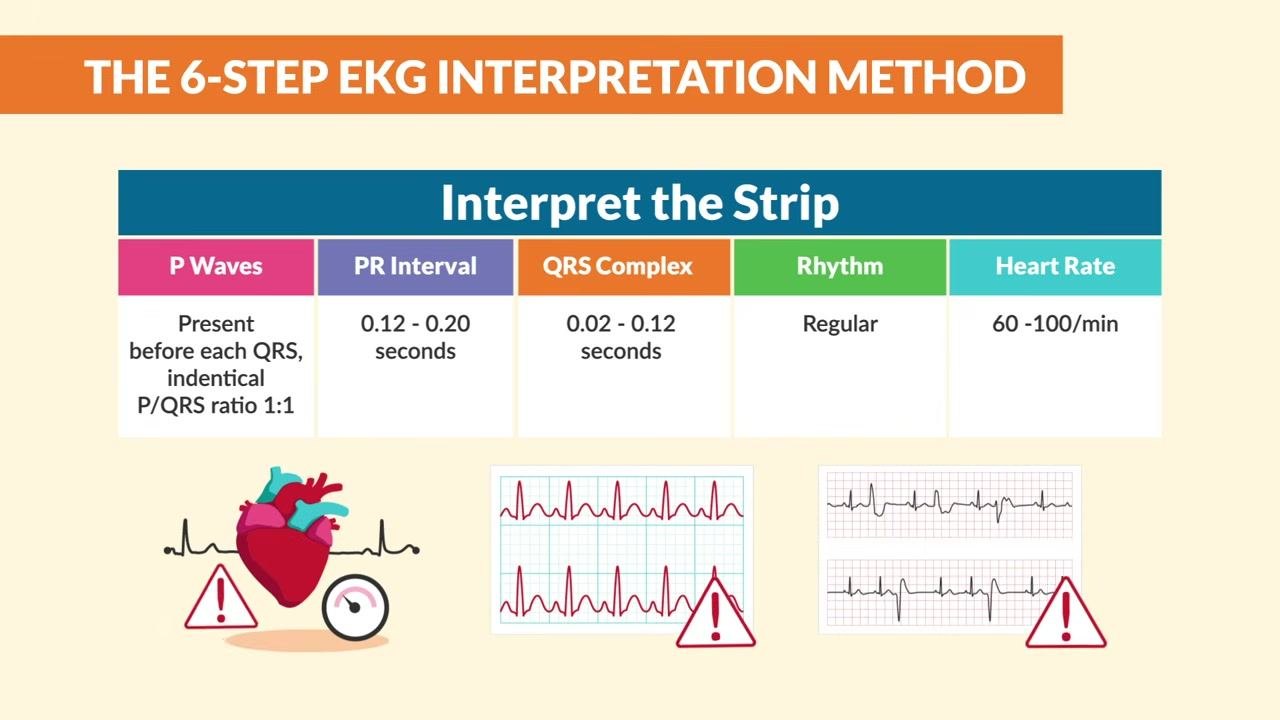
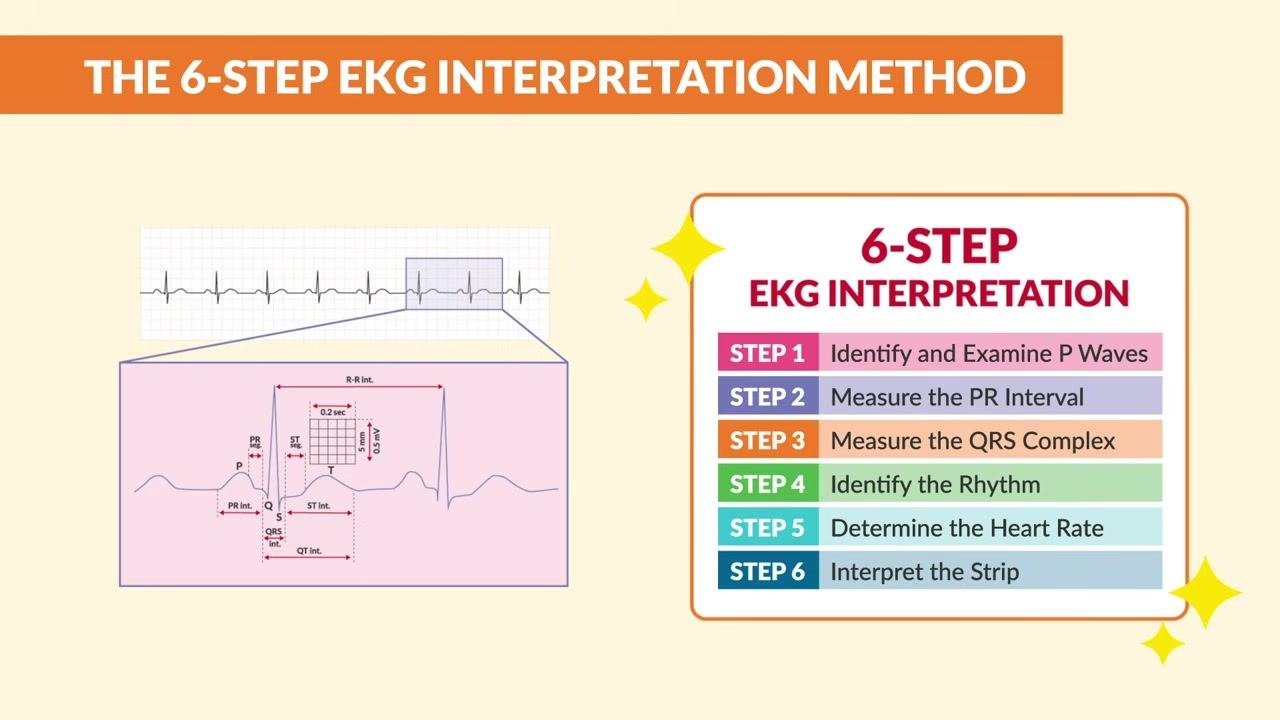
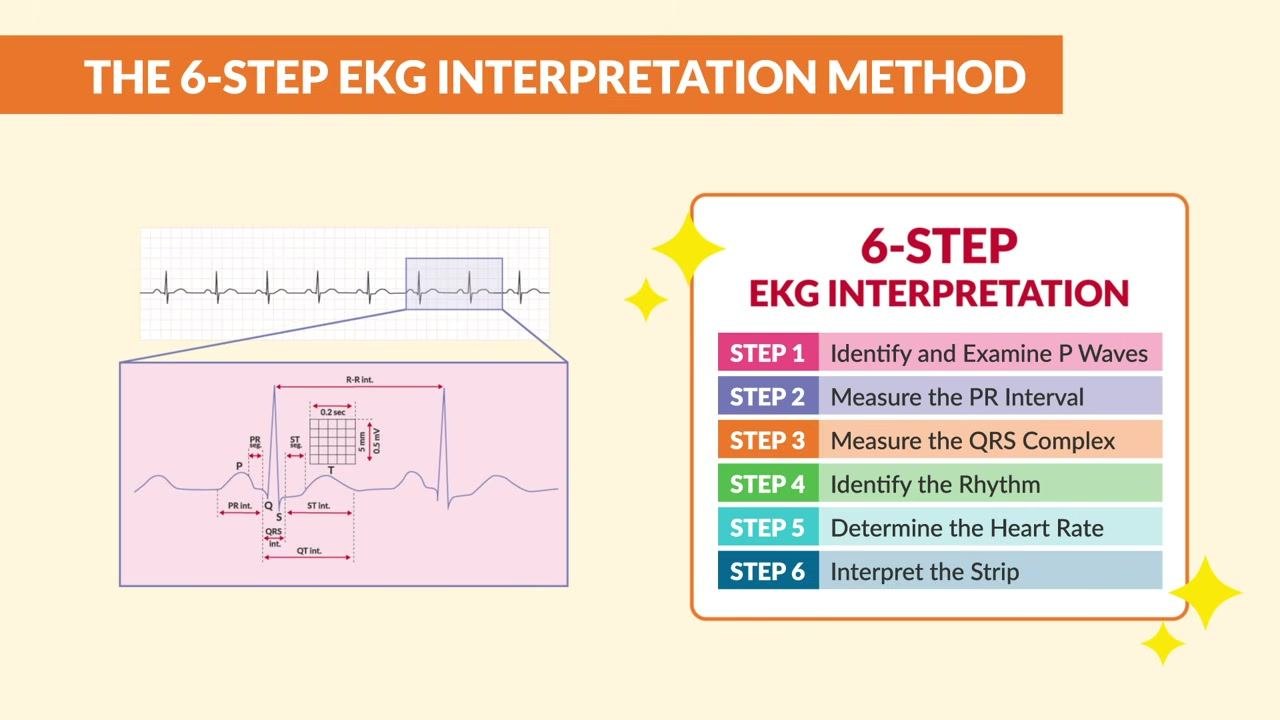
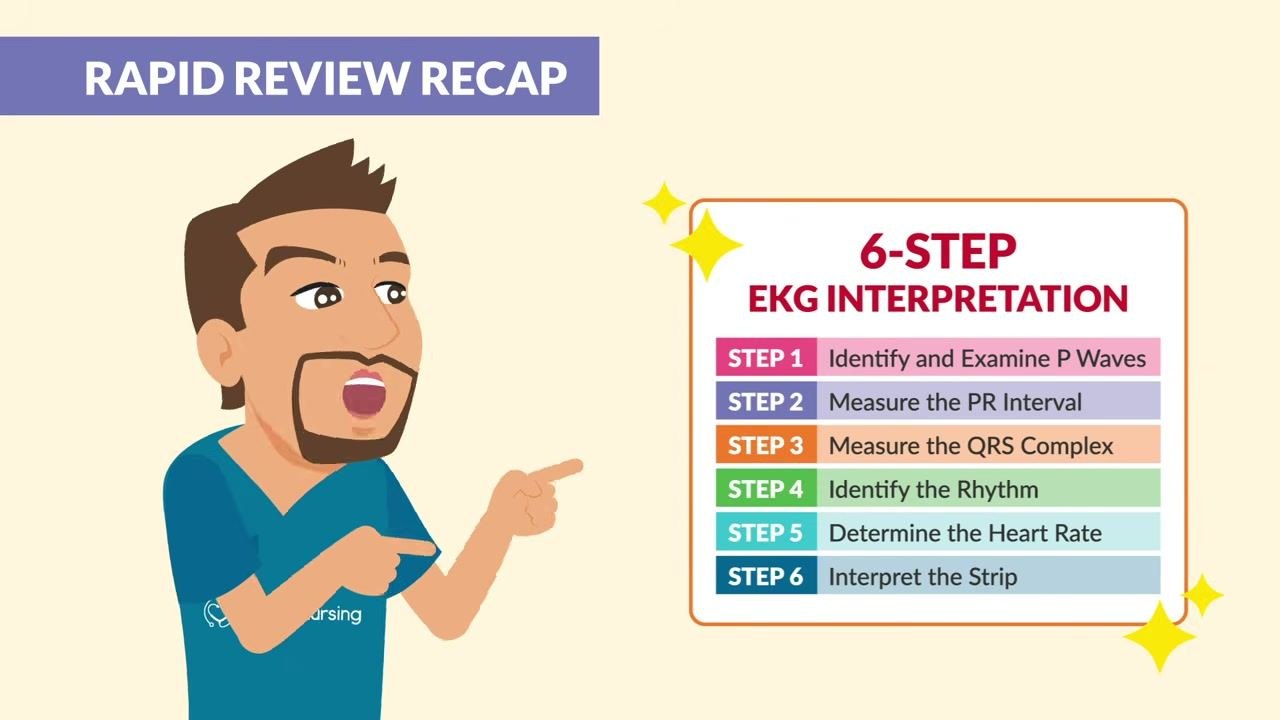
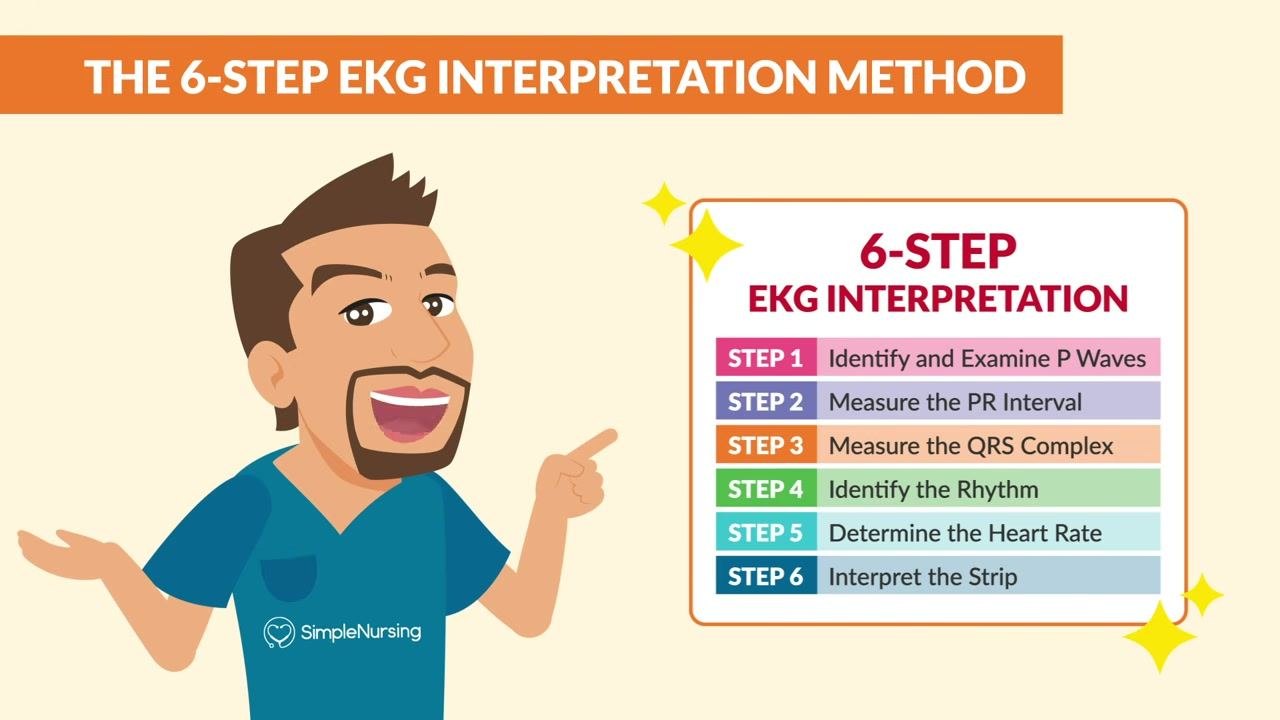
Step 27 — Gather your strip and review the six steps. With your EKG strip in hand, prepare to apply the six-step method: identify and examine P waves, measure the PR interval, measure the QRS complex, identify the rhythm, determine the heart rate, and interpret the strip.
Step 28 — Keep the method as a quick reference. The six-step method is color-coded for clarity and is worth keeping close at hand every time you interpret a strip.
Step 29 — Step 1: Identify and examine P waves. Check whether P waves are present, missing, or inverted. Missing or inverted P waves suggest a junctional rhythm or atrial fibrillation.
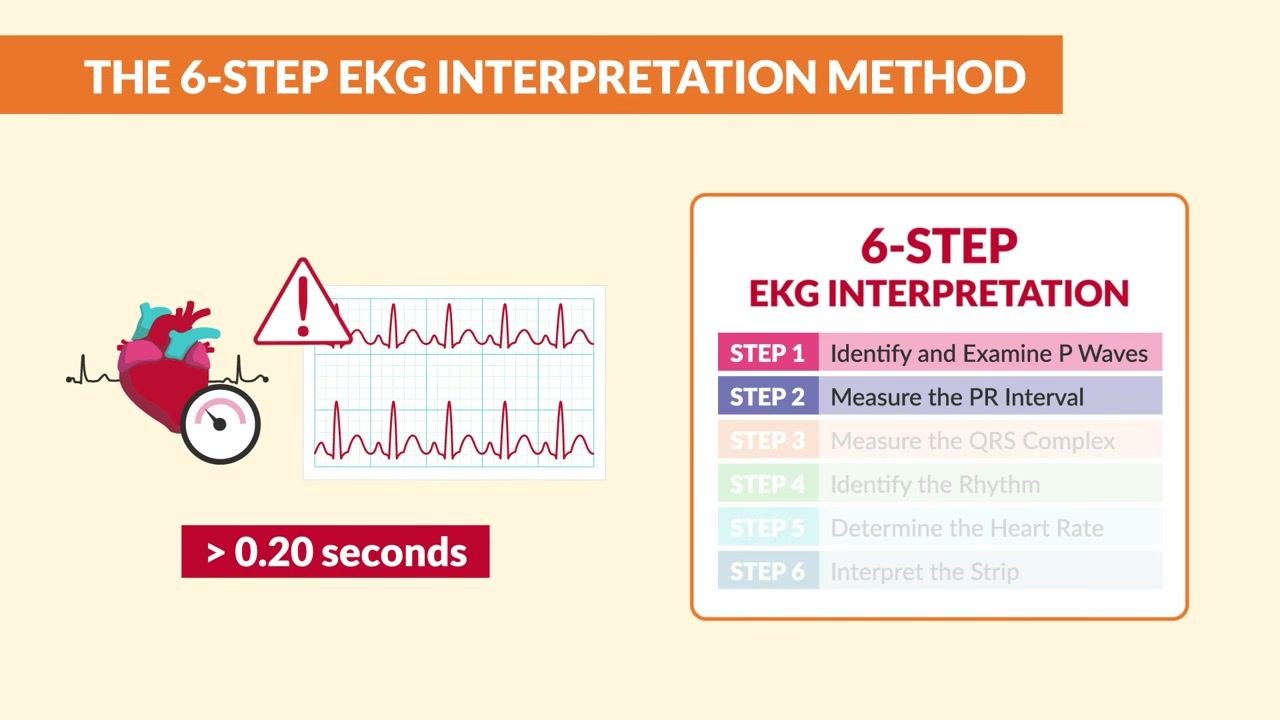
Step 30 — Step 2: Measure the PR interval. Highlight the PR interval on the strip. A PR interval greater than 0.20 seconds is abnormal.
Step 31 — Step 3: Measure the QRS complex. Confirm the QRS duration falls between 0.06 and 0.12 seconds. A QRS wider than 0.12 seconds indicates a problem.
Step 32 — Step 4: Identify the rhythm. Ask whether the rhythm is regular or irregular by examining the spacing between QRS complexes. Reconfirm that the QRS duration is between 0.06 and 0.12 seconds.
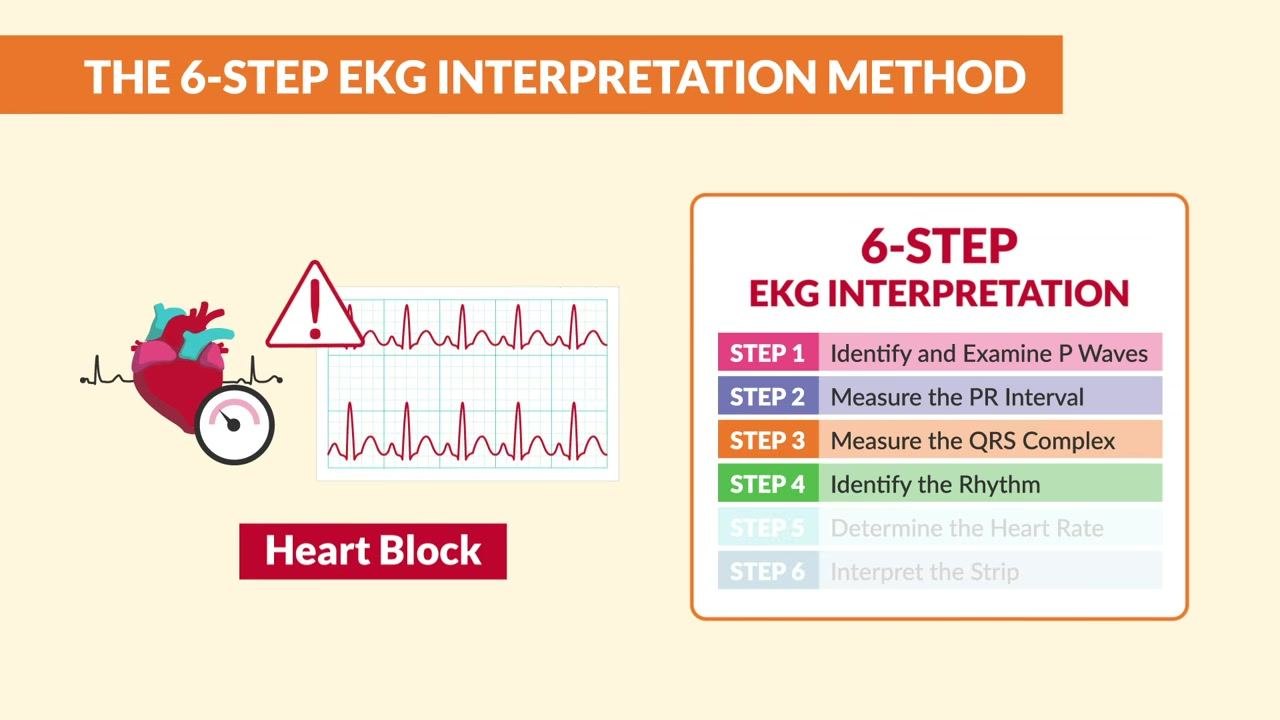
Step 33 — Watch for a "regularly irregular" pattern. Examine the strip for a rhythm that repeats at irregular intervals, and look for warning signs such as inconsistent spacing between QRS complexes.
Step 34 — Consider heart block. A regularly irregular rhythm can indicate heart block, so flag this pattern for further review.
Step 35 — Step 5: Determine the heart rate. A normal heart rate falls between 60 and 100 beats per minute. Review the summary table of normal EKG values: P waves present before each QRS in a 1:1 ratio, PR interval 0.12–0.20 seconds, QRS complex 0.06–0.12 seconds, regular rhythm, and heart rate 60–100/min.
Step 36 — Step 6: Interpret the strip. Review your findings from Steps 1 through 5 and confirm whether all intervals and waveforms fall within normal ranges to reach your final interpretation.
Part 7: Rapid review and additional resources
Step 37 — Recall the three core waveforms. Review the labeled EKG waveform one more time: P wave = Atrial Depolarization, QRS complex = Ventricular Depolarization, and T wave = Ventricular Repolarization, which represents the ventricles relaxing and refilling with blood.
Step 38 — Recall normal interval durations. Confirm the normal PR interval (0.12–0.20 seconds) and normal QRS duration (0.06–0.12 seconds) one final time before finishing your review.
Step 39 — Apply the six-step method to every strip. Use the color-coded six-step EKG interpretation method consistently, on every strip you review, to keep your process reliable.
Step 40 — Reference the nine NCLEX strips again. Return to the EKG Quick View: 9 strips to know for the NCLEX chart, which lists normal sinus rhythm, bradycardia, ventricular fibrillation, ventricular tachycardia, atrial fibrillation, atrial flutter, SVT, torsades de pointes, and asystole.
Step 41 — Download the cheat sheet for ongoing reference. Locate and download the free EKG Quick View: 9 strips to know for the NCLEX cheat sheet, which lists labeled strips for normal sinus rhythm, bradycardia, V-Fib, V-Tach, A-Fib, A-Flutter, SVT, torsades de pointes, and asystole for quick reference during study or clinical practice.
Verification
By completing these steps, you can systematically interpret any EKG strip: trace the conduction pathway from the SA node to the Purkinje fibers, identify the P wave, QRS complex, and T wave, measure the PR interval and QRS duration against normal ranges, and apply the six-step method to reach a final interpretation. Confirm that P waves are present and identical, the PR interval falls between 0.12–0.20 seconds, the QRS complex falls between 0.06–0.12 seconds, the rhythm is regular, and the heart rate falls between 60–100 beats per minute for a normal reading. Flag any widened QRS complex, missing or inverted P waves, or irregular spacing for further review.
What's next
Keep the EKG Rhythms Cheat Sheet and the EKG Quick View: 9 strips to know for the NCLEX chart on hand for quick reference during clinical practice and exam preparation. Continue practicing the six-step method on additional strips, and review the nine core NCLEX rhythms regularly to build speed and confidence in reading an EKG strip.
Generation details: cost, quality tiers
Docsie billed 4,500 credits ($3.15) to analyze this 9-minute video at standard quality. The rewrite, template fill and Word/PDF exports were included. The same video at each quality tier:
| Quality | Frames sampled | Credits | Approx. cost |
|---|---|---|---|
| Draft | every 16-30 s | 2,250 | $1.57 |
| Standard (this guide) | every 8-15 s | 4,500 | $3.15 |
| Detailed | every 4-7 s | 9,000 | $6.30 |
| Ultra | every 1-3 s | 18,000 | $12.60 |
Credits priced at $0.70 per 1,000; plans include a monthly allowance. Enterprise customers on on-premise or bring-your-own-model deployments run this on their own inference and pay no per-video credits.
Generated by Docsie Video-to-Docs on 2026-09-09 from a 8-minute video. Screenshots are frames from the source video and belong to their creator, SimpleNursing, whose original is embedded above. If you own this video and want the guide removed or credited differently, contact us and we will act within one business day.