
How to Interpret an EKG Strip
This document explains how to interpret an EKG strip by measuring the PR interval, a key indicator of AV (atrioventricular) conduction time. Following this procedure allows you to confirm normal cardiac conduction or recognize findings that require further clinical evaluation, such as a possible heart block.
Video: How to Measure a PR Interval on EKG Strip | How to Interpret EKGs by RegisteredNurseRN (2015). All credit for the demonstration goes to the creator; watch the original on YouTube. The written guide below was generated from this video by Docsie. Creator? Request a change or removal.
This document explains how to interpret an EKG strip by measuring the PR interval, a key indicator of AV (atrioventricular) conduction time. Following this procedure allows you to confirm normal cardiac conduction or recognize findings that require further clinical evaluation, such as a possible heart block.
Procedure synopsis
| Field | Details |
|---|---|
| Procedure title | How to Interpret an EKG Strip: Measuring the PR Interval |
| Applicable guideline | Not specified in the source material; follow your institution's standard EKG interpretation protocol. |
| Clinical indication | Assessment of AV (atrioventricular) conduction time |
| Target population | Clinicians and learners reviewing an EKG strip |
| Design summary | A stepwise visual measurement using the EKG strip's grid of small and large squares |
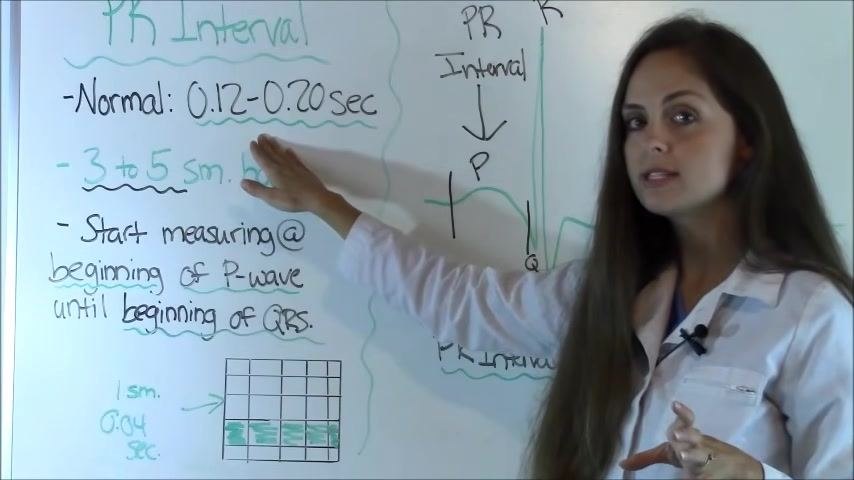
| Primary objective | Confirm that the PR interval falls within the normal range of 0.12–0.20 seconds (3–5 small boxes) |
| Estimated duration | The full measurement can typically be completed in a few minutes per strip |
Background and rationale
The PR interval represents the time it takes for an electrical impulse to travel through the AV node, measuring AV conduction time on an EKG strip. A normal PR interval falls between 0.12 and 0.20 seconds.
Accurately measuring this interval is important because values outside the normal range may indicate a heart block, which requires further evaluation. Recognizing this early supports timely clinical decision-making.
There is no pharmacological mechanism involved in this procedure, as it is a manual, visual measurement technique rather than a treatment intervention.
The rationale for standardizing this measurement is to ensure that clinicians and learners can consistently identify normal conduction versus abnormal patterns using the EKG grid.
Measurement procedure
This is a manual, stepwise visual measurement performed directly on an EKG strip; it is not a randomized or blinded process, and there are no treatment arms or dosing regimens involved.
The procedure follows this general sequence:
- Confirm the normal range and unit of measurement.
- Identify the key waveform components on the strip.
- Determine the start and end points for measurement.
- Count the small boxes between those points.
- Calculate and interpret the PR interval.
Each small box on the EKG grid represents 0.04 seconds, and each large square contains five small squares. The normal PR interval of 0.12–0.20 seconds corresponds to 3 to 5 small squares.
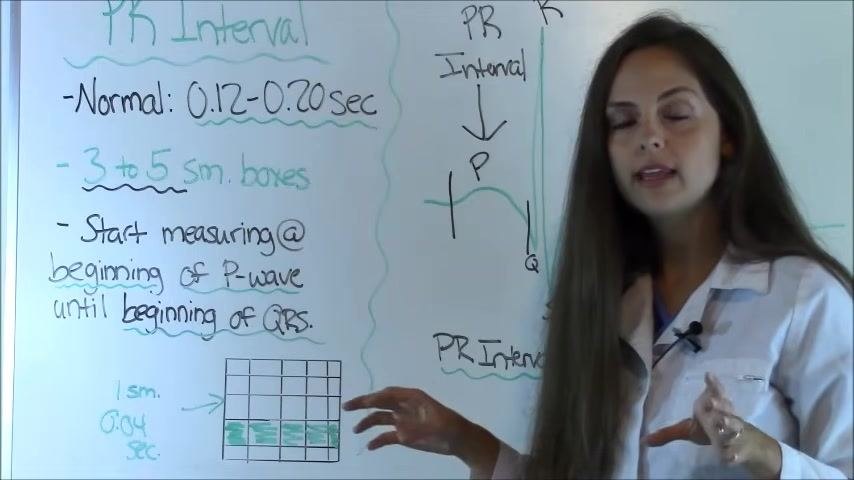
Locate the P wave, QRS complex, T wave, and, when present, the U wave on the EKG strip. A blown-up diagram can help with clarity when identifying these components.
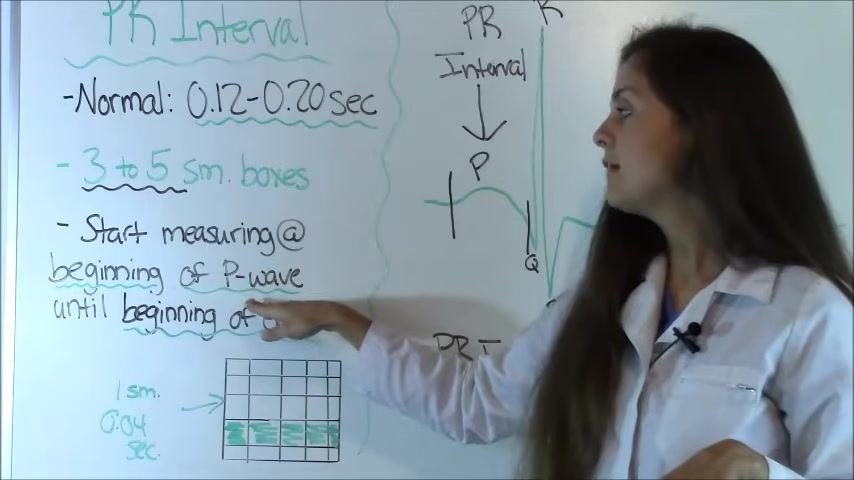
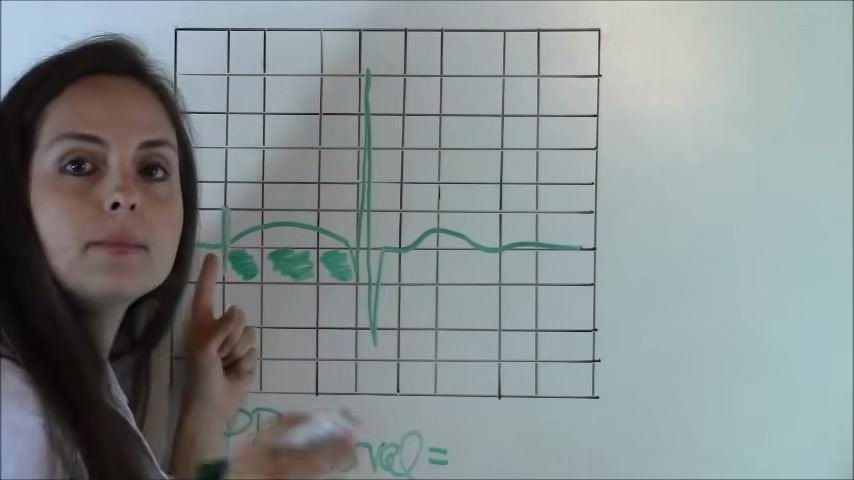
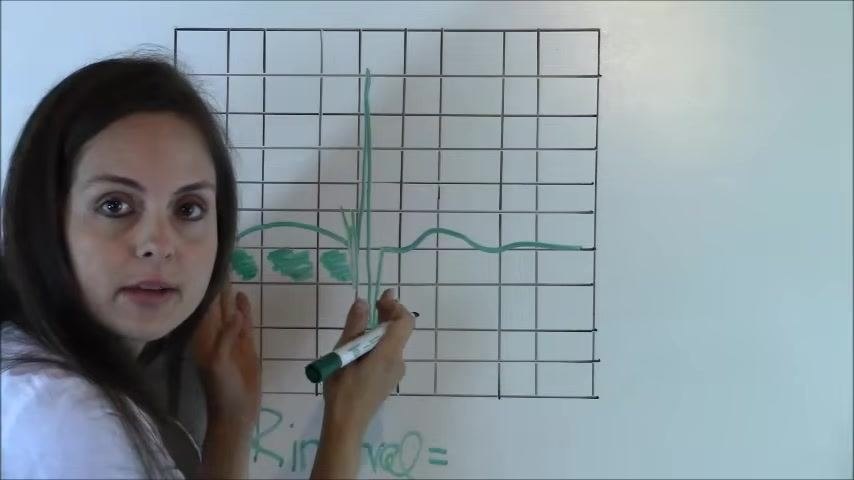
Start measuring at the beginning of the P wave (the first upward deflection) and stop at the beginning of the QRS complex (where the sharp spike begins). Visually confirm both points before counting.
Interpretation criteria
Use the following criteria to determine whether a measured PR interval is normal or requires further evaluation.
Normal findings (inclusion criteria):
- The PR interval measures between 0.12 and 0.20 seconds.
- The interval corresponds to 3 to 5 small boxes, each equal to 0.04 seconds.
- Measurement begins at the start of the P wave and ends at the start of the QRS complex.
Abnormal findings (exclusion / referral criteria):
- The PR interval measures greater than 0.20 seconds.
- The box count falls outside the 3–5 small box range.
- The pattern suggests a possible heart block and requires further clinical assessment.
Key measurement points
- Primary measurement point: Calculate the PR interval and confirm it falls within the normal 0.12–0.20 second range.
- Secondary measurement points: Correctly identify the P wave, QRS complex, T wave, and U wave on the strip.
- Supporting practice: Use sample or practice EKG strips with a visible grid to reinforce accurate box counting.
Step-by-step assessment schedule
| Step | Action | Reference point |
|---|---|---|
| 1 | Locate the P wave on the EKG strip | Beginning of the P wave |
| 2 | Locate the QRS complex on the EKG strip | Beginning of the QRS complex |
| 3 | Mark both the start of the P wave and the start of the QRS complex | Marked interval |
| 4 | Count the small boxes between the two marked points | 3–5 small boxes expected |
| 5 | Practice the count on a sample strip with a shaded PR interval | Shaded interval area |
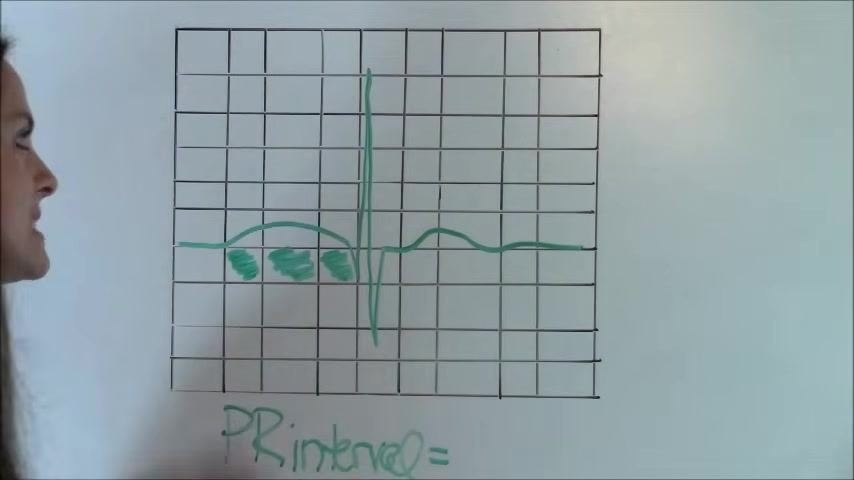
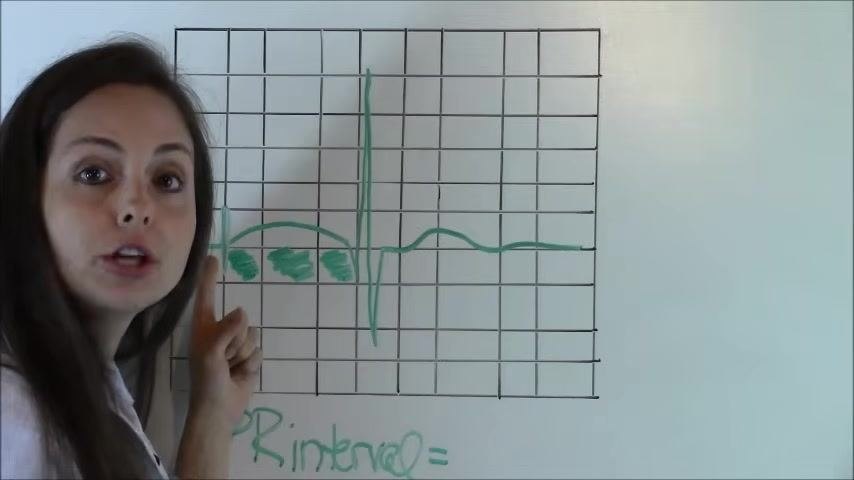
Focus on the small boxes within the background grid, counting from the start of the P wave to the start of the QRS complex, and confirm the count falls between 3 and 5 small boxes.
Calculation method
To calculate the PR interval, count the number of small boxes between the start of the P wave and the start of the QRS complex, then multiply that count by 0.04 seconds per box.
In a worked example, 3 small boxes are counted between the two points:
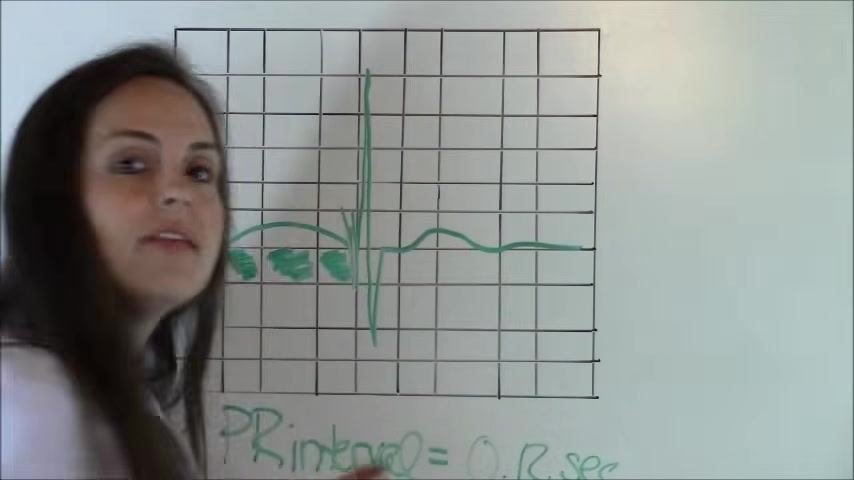
- Calculation: 3 boxes × 0.04 seconds = 0.12 seconds
- Result: PR interval = 0.12 seconds, which falls within the normal range.
Abnormal findings and reporting
A calculated PR interval of 0.12 seconds in the worked example is confirmed to be within the normal range of 0.12–0.20 seconds.
Any PR interval greater than 0.20 seconds may indicate a heart block and should be flagged for further evaluation. The source material does not specify a formal grading scale, reporting timeline, or oversight body beyond this normal/abnormal distinction; follow your institution's protocol for escalating abnormal EKG findings.
What's next
To continue building EKG interpretation skills, explore further resources on:
- How to measure the QRS complex.
- The PQRS method for EKG interpretation.
- How to interpret other EKG rhythms.
Additional practice materials, including free quizzes and NCLEX practice quizzes, are available at RegisteredNurseRN.com.
Generation details: cost, quality tiers, downloads
Docsie billed 2,500 credits ($1.75) to analyze this 5-minute video at standard quality. The rewrite, template fill and Word/PDF exports were included. The same video at each quality tier:
| Quality | Frames sampled | Credits | Approx. cost |
|---|---|---|---|
| Draft | every 16-30 s | 1,250 | $0.88 |
| Standard (this guide) | every 8-15 s | 2,500 | $1.75 |
| Detailed | every 4-7 s | 5,000 | $3.50 |
| Ultra | every 1-3 s | 10,000 | $7.00 |
Credits priced at $0.70 per 1,000; plans include a monthly allowance. Enterprise customers on on-premise or bring-your-own-model deployments run this on their own inference and pay no per-video credits.
Generated by Docsie Video-to-Docs on 2026-09-14 from a 4-minute video. It was generated straight into Docsie's Clinical Protocol Document template, so every section of that template is filled from the video. Screenshots are frames from the source video and belong to their creator, RegisteredNurseRN, whose original is embedded above. If you own this video and want the guide removed or credited differently, contact us and we will act within one business day.