
How to Equipment Maintenance Log Template
This document explains how to set up and use the Equipment Maintenance Management Template in Microsoft Excel. The equipment maintenance log template helps you define and track maintenance requirements, log jobs and costs, and visualize key maintenance metrics through built-in dashboards and charts.
Video: Equipment Maintenance Management Excel & Google Sheets CMMS Template Step-by-Step Video Tutorial! by Simple Sheets (2021). All credit for the demonstration goes to the creator; watch the original on YouTube. The written guide below was generated from this video by Docsie. Creator? Request a change or removal.
Purpose
This document explains how to set up and use the Equipment Maintenance Management Template in Microsoft Excel. The equipment maintenance log template helps you define and track maintenance requirements, log jobs and costs, and visualize key maintenance metrics through built-in dashboards and charts.
Scope
This procedure applies to anyone responsible for planning, scheduling, and recording equipment maintenance activities using the SimpleSheets Equipment Maintenance Management Template. It covers initial setup of foundational data, configuration of the annual maintenance schedule, logging maintenance activities, and using analytics tools to review performance.
Requirements
- Microsoft Excel (Desktop App or Excel Online)
- The Equipment Maintenance Management Template file (part of the SimpleSheets collection, which includes over one hundred pre-built and smart templates)
- Note: Five free templates are available to try before purchasing the full collection.
Review the introduction sheet
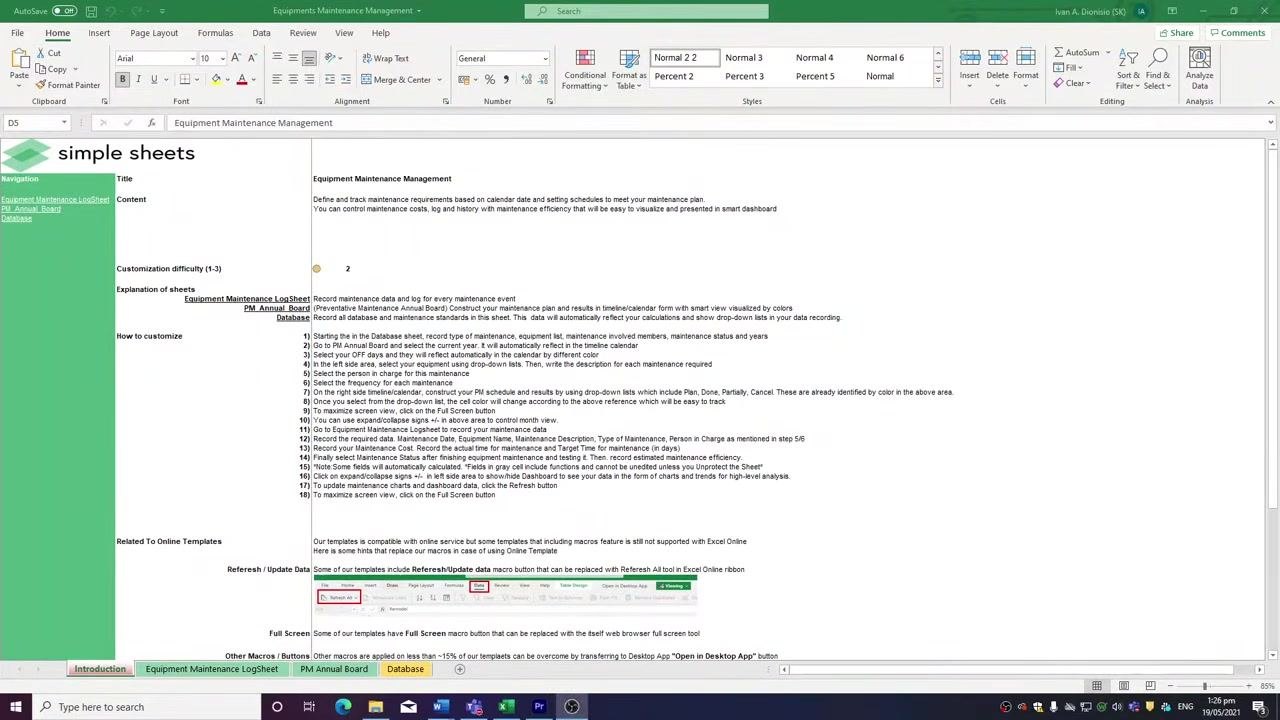
Open the Equipment Maintenance Management Template in Microsoft Excel. The Introduction sheet appears first and provides an overview of the template's purpose and structure.
Read the short description at the top of the sheet, which explains that the template is designed to define and track maintenance requirements, log jobs and costs, and visualize metrics. Note the Customization Difficulty indicator, rated 2 out of 3.
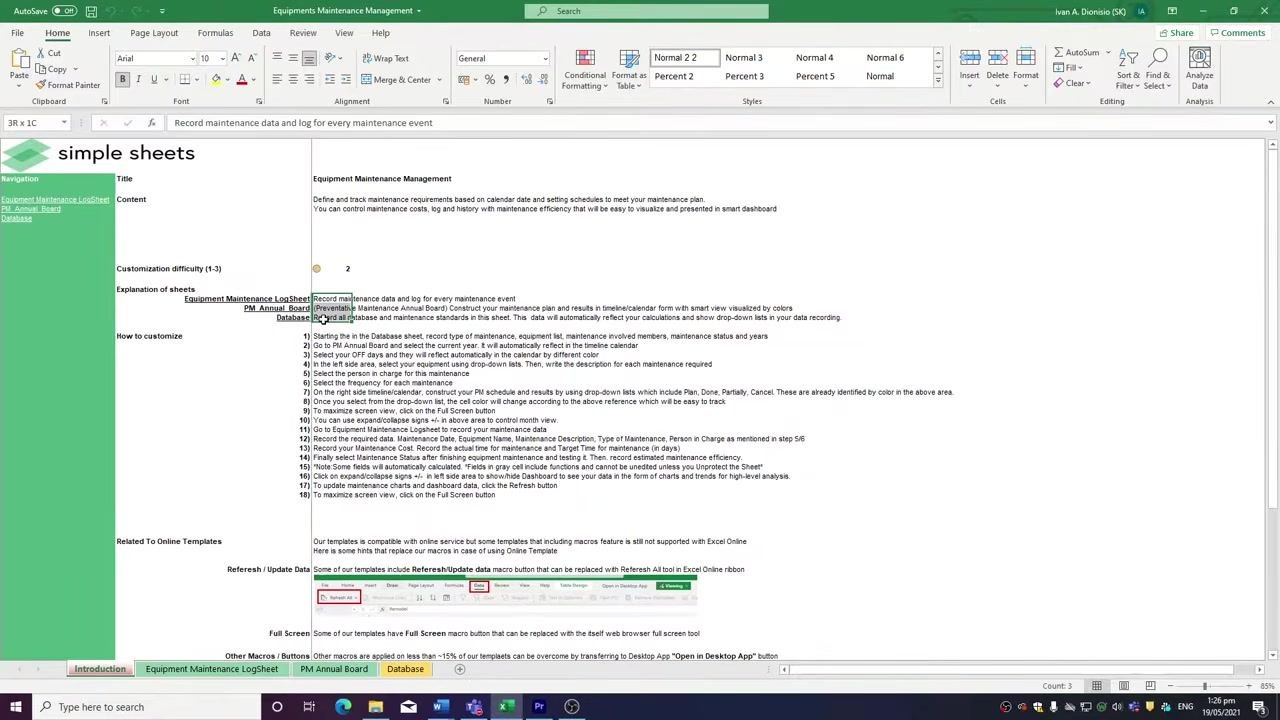
Review the Explanation of Sheets section, which outlines the three main tabs: - Equipment Maintenance LogSheet - PM Annual Board - Database
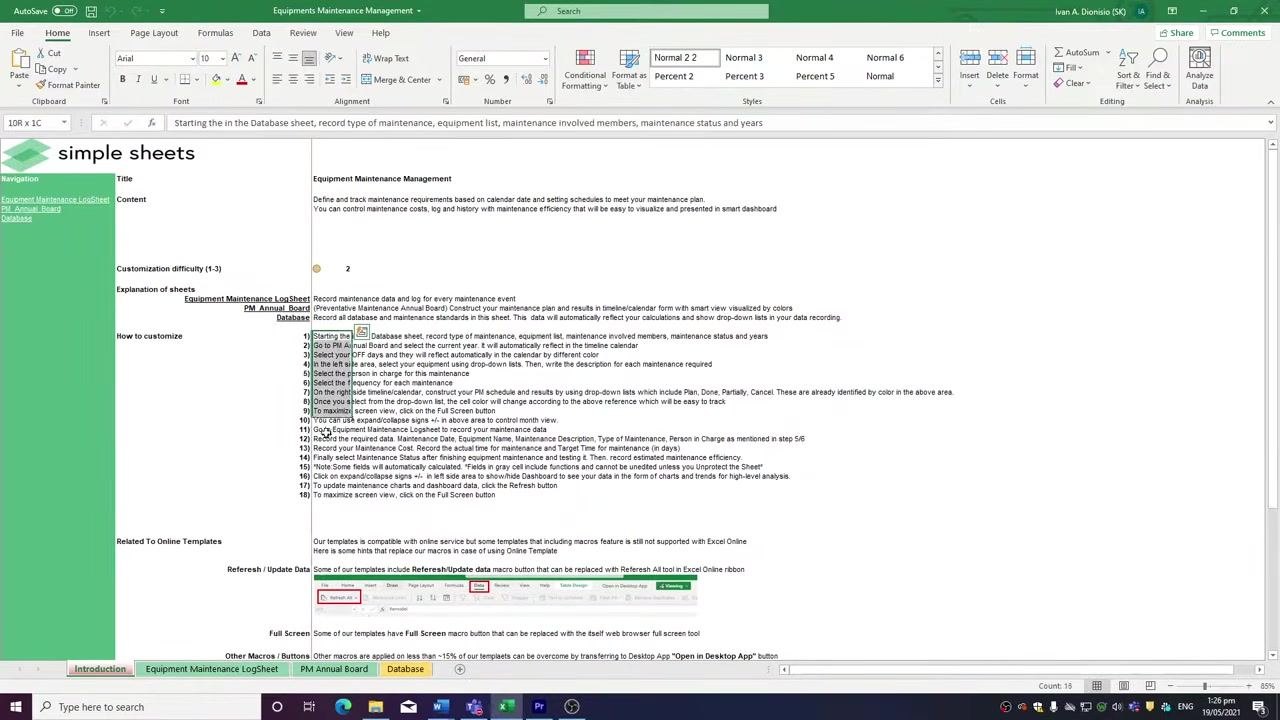
Follow the How to Customize instructions for a step-by-step guide to setting up and using the template. Use the left navigation panel to switch between the Introduction, Equipment Maintenance LogSheet, PM Annual Board, and Database tabs.
Review online compatibility instructions
Scroll to the bottom of the Introduction sheet to review the Related To Online Templates section. This area provides tips for using the template with Excel Online and the Desktop App, including instructions for refreshing and updating data, using full screen mode, and handling macros and buttons.
Reference the screenshots and highlighted buttons provided for visual guidance.
Set up the database tab
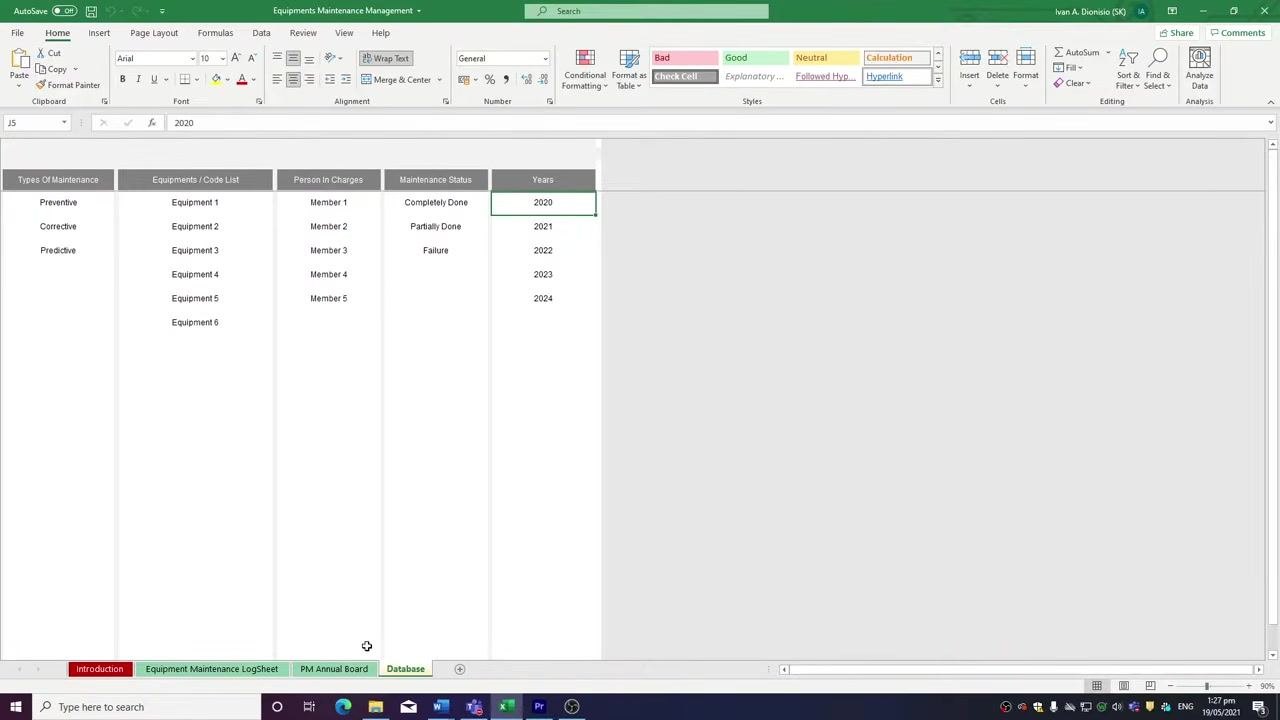
Click the Database tab at the bottom of the template. This tab holds all foundational data for your maintenance management system and populates drop-down lists used throughout the other tabs.
Enter the following data into the Database tab: - Types Of Maintenance column: Enter maintenance types such as Preventive, Corrective, and Predictive. - Equipments / Code List column: List each piece of equipment or unique code (for example, Equipment 1, Equipment 2, Equipment 3). - Person in Charges column: List technicians or mechanics responsible for maintenance (for example, Member 1, Member 2, Member 3). - Maintenance Status column: Enter statuses such as Completely Done, Partially Done, or Failure. - Years column: Enter relevant years (for example, 2020, 2021, 2022, 2023, 2024).
Ensure all data is complete, as this information will populate drop-down lists in other tabs.
Select the year in the PM Annual Board tab
Click the PM Annual Board tab at the bottom of the template. Use the drop-down menu to select the year for your preventive maintenance schedule. All data entered in the Database tab becomes available for selection here and in other tabs.
Set company off days
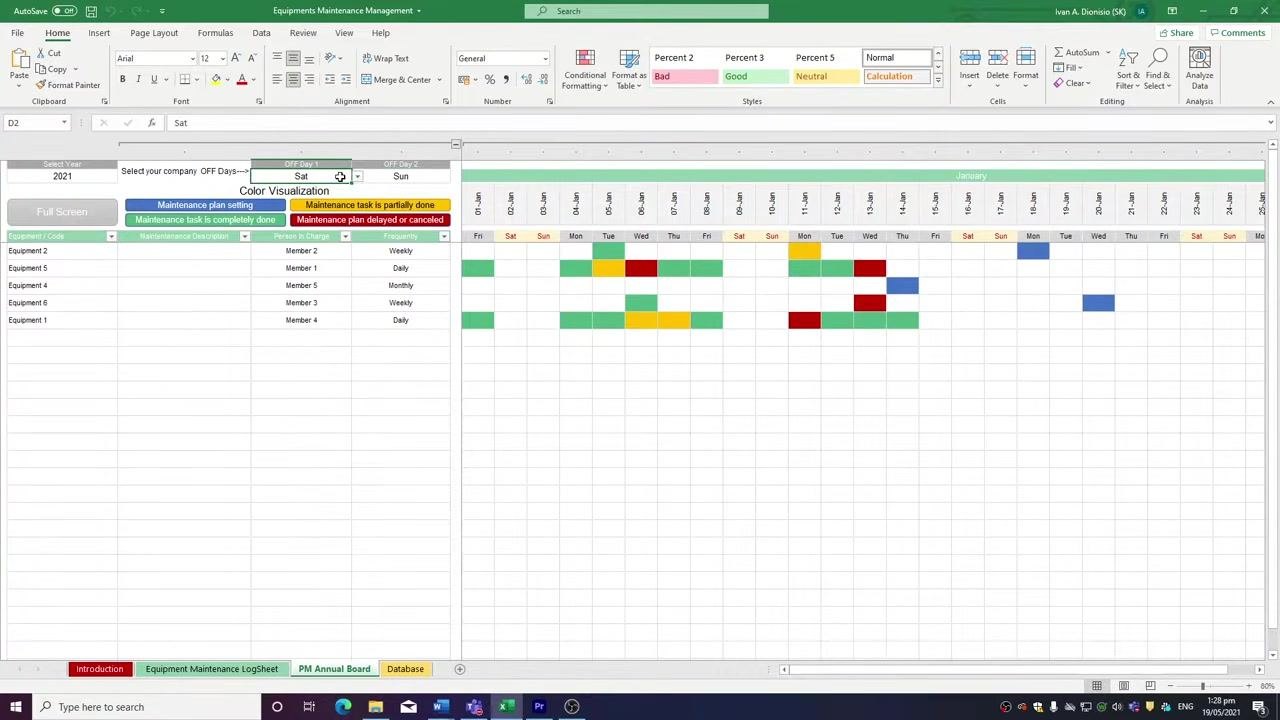
At the top of the PM Annual Board tab, locate the OFF Day 1 and OFF Day 2 dropdowns. Select your standard off days (for example, Sat and Sun, or Fri and Sat if your business schedule differs).
The selected off days are automatically highlighted in the calendar view, and the day rows update accordingly.
Add equipment to track
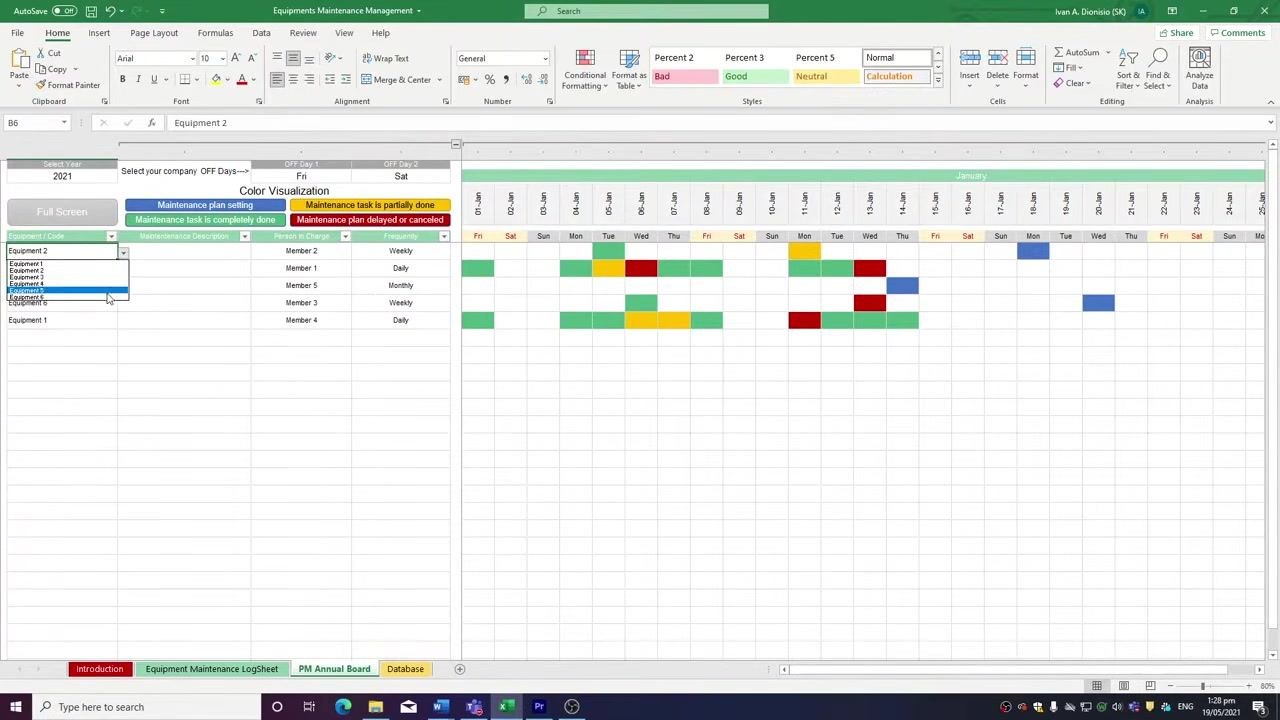
In the Equipment / Code column, use the dropdown to select equipment from the list populated by the Database tab. For example, select "Equipment 2" from the dropdown.
Enter task details and frequency
Fill in the Maintenance Description column with a brief summary of the task to be performed. Use the dropdown in the Person in Charge column to assign the responsible team member.
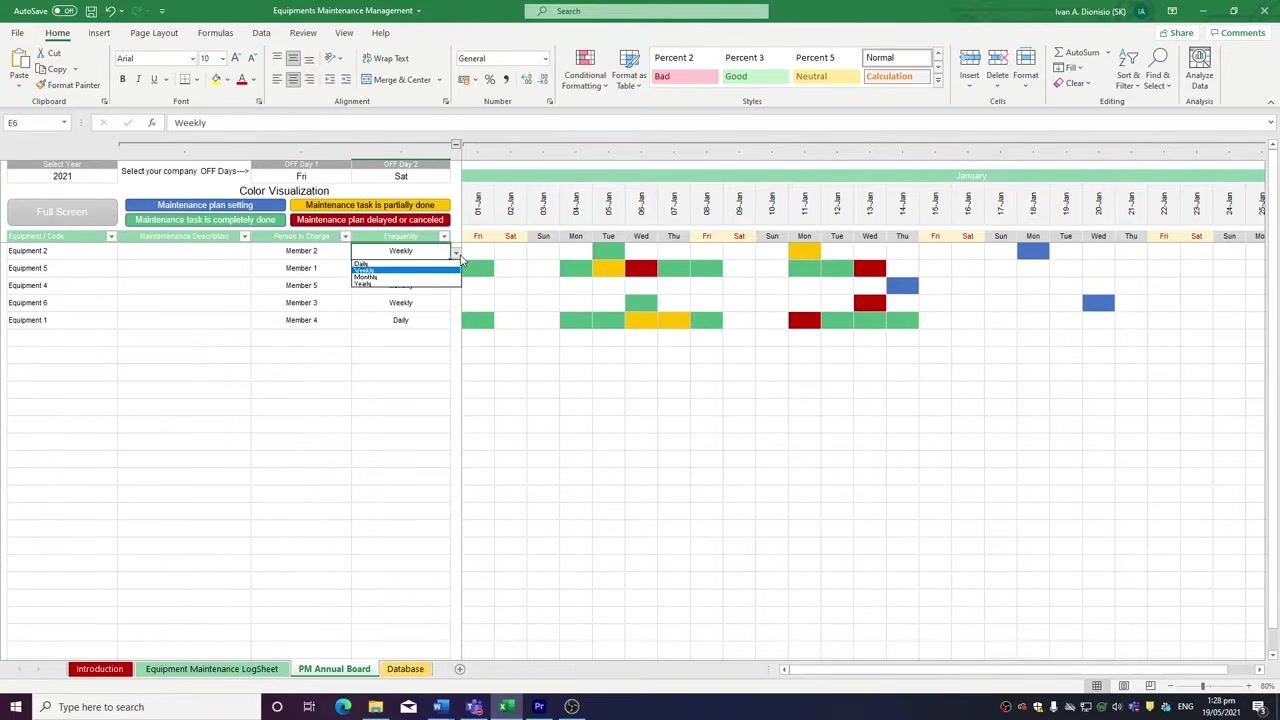
In the Frequency column, select the appropriate schedule from the dropdown: Daily, Weekly, or Monthly.
Understand the color legend and calendar layout
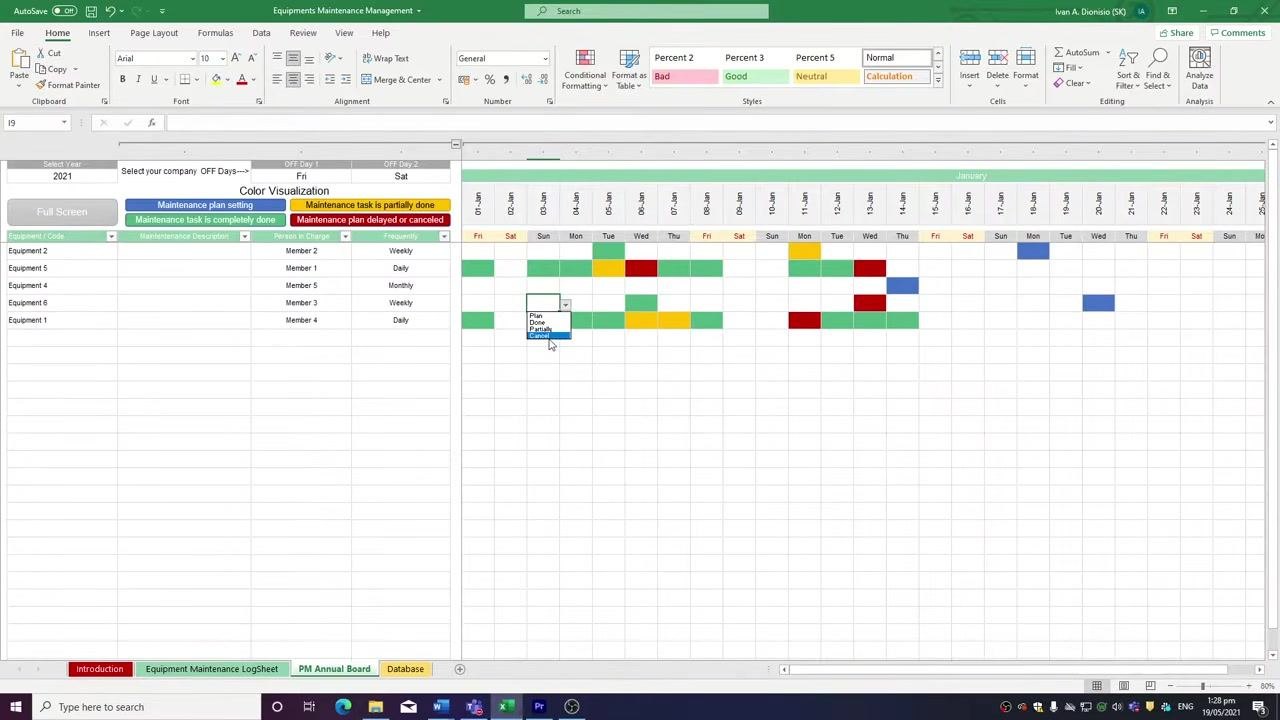
Review the color visualization legend at the top of the sheet before entering status data: - Blue: Maintenance plan setting - Green: Maintenance task is completely done - Yellow: Maintenance task is partially done - Red: Maintenance plan delayed or canceled
The calendar columns represent dates within the selected month, and each row corresponds to a piece of equipment and its scheduled maintenance activities.
Track maintenance status per day
For each equipment and date, use the dropdown in the calendar cell to select the maintenance status: Plan, Done, Partial, or Canceled. The cell color updates automatically to match the status, giving you a quick visual reference.
Navigate between months
Use the collapse and expand buttons at the top of each month to view or hide the calendar for different months as needed.
Log maintenance activities in the LogSheet
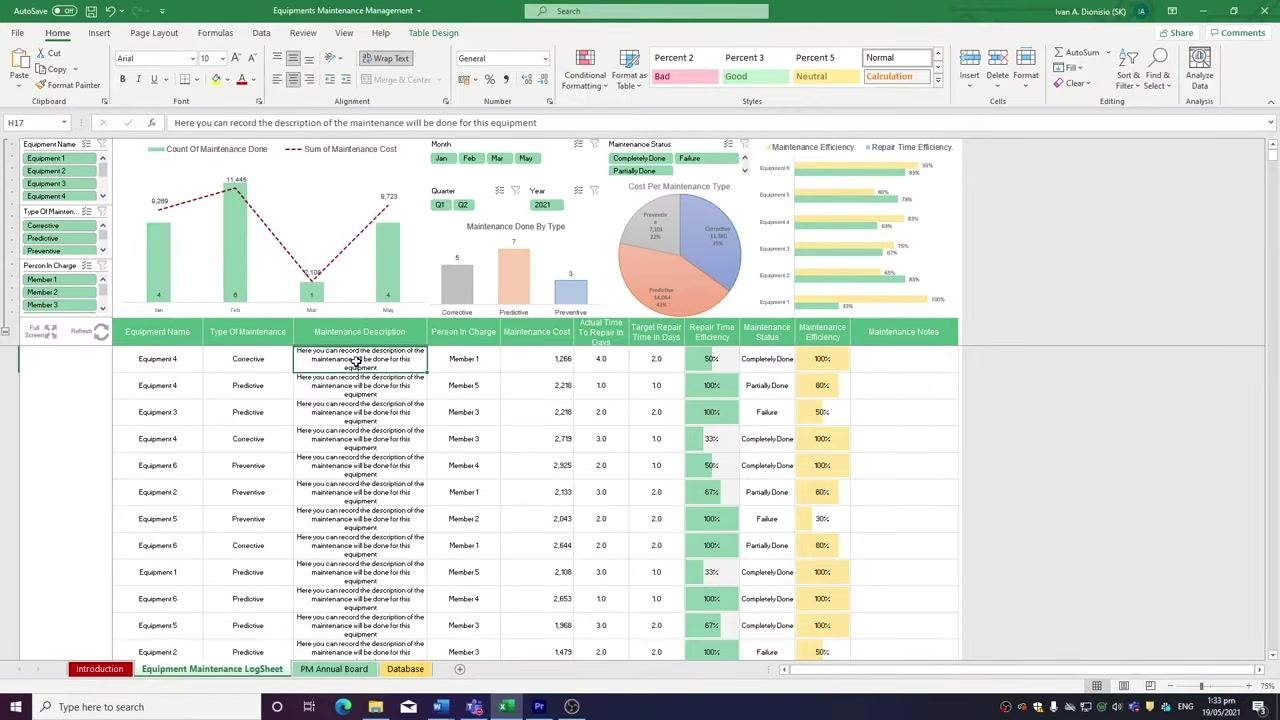
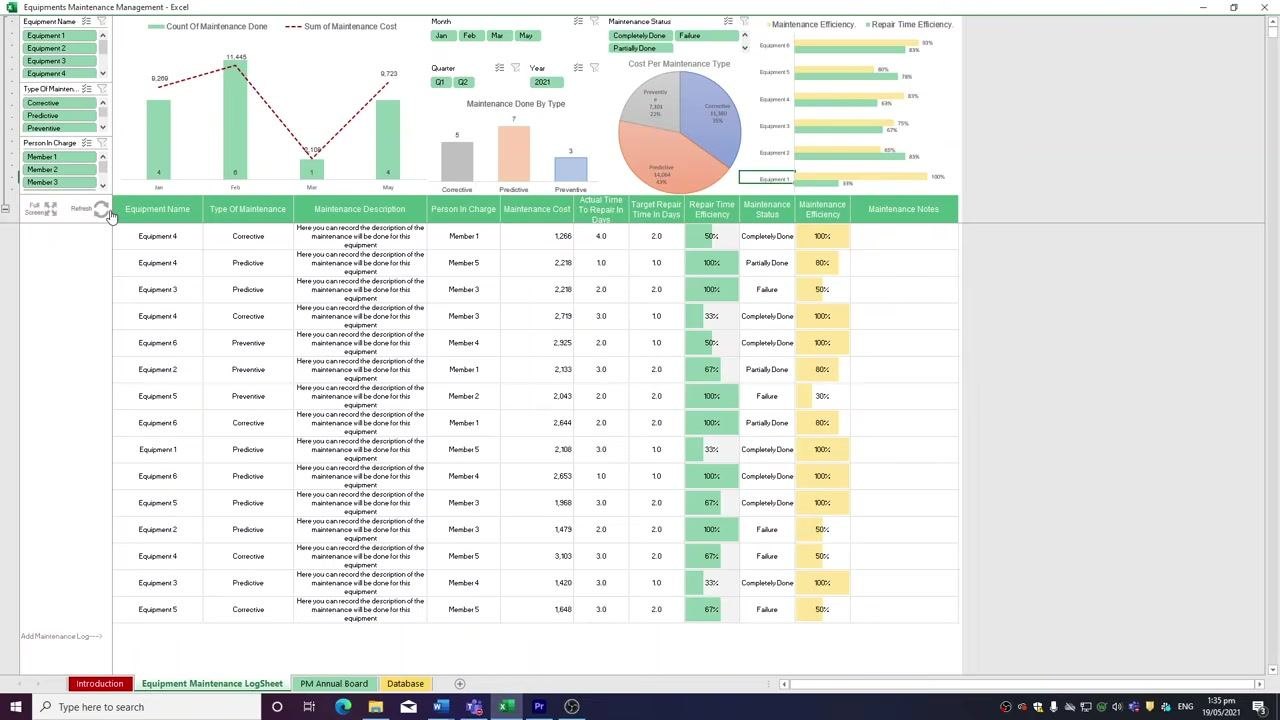
Switch to the Equipment Maintenance LogSheet tab to record detailed maintenance data for each piece of equipment. For each entry, provide:
- Equipment Name: Select from the dropdown list.
- Type of Maintenance: Choose Preventive, Corrective, or Predictive.
- Maintenance Description: Enter a description of the maintenance performed.
- Person in Charge: Select the responsible team member.
- Maintenance Cost: Enter the cost incurred.
- Actual Time to Repair (in days): Input the actual repair duration.
- Target Repair Time (in days): Enter the planned repair duration.
- Maintenance Status: Choose Completely Done, Partially Done, or Failure.
- Maintenance Efficiency: Enter or select the efficiency percentage.
- Maintenance Notes: Add any relevant notes or comments.
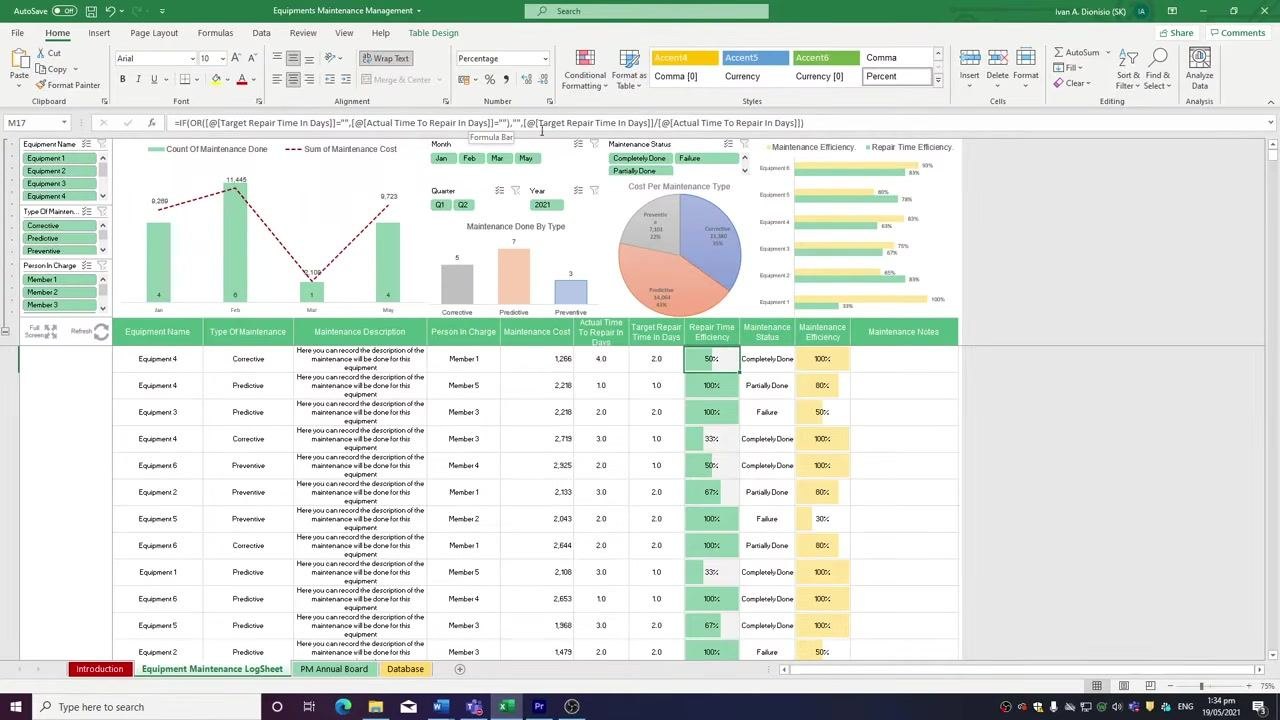
Important: Do not enter data manually in the Repair Time Efficiency column. This value is calculated automatically based on the actual and target repair times. Entering values here will overwrite the formula.
Add maintenance notes
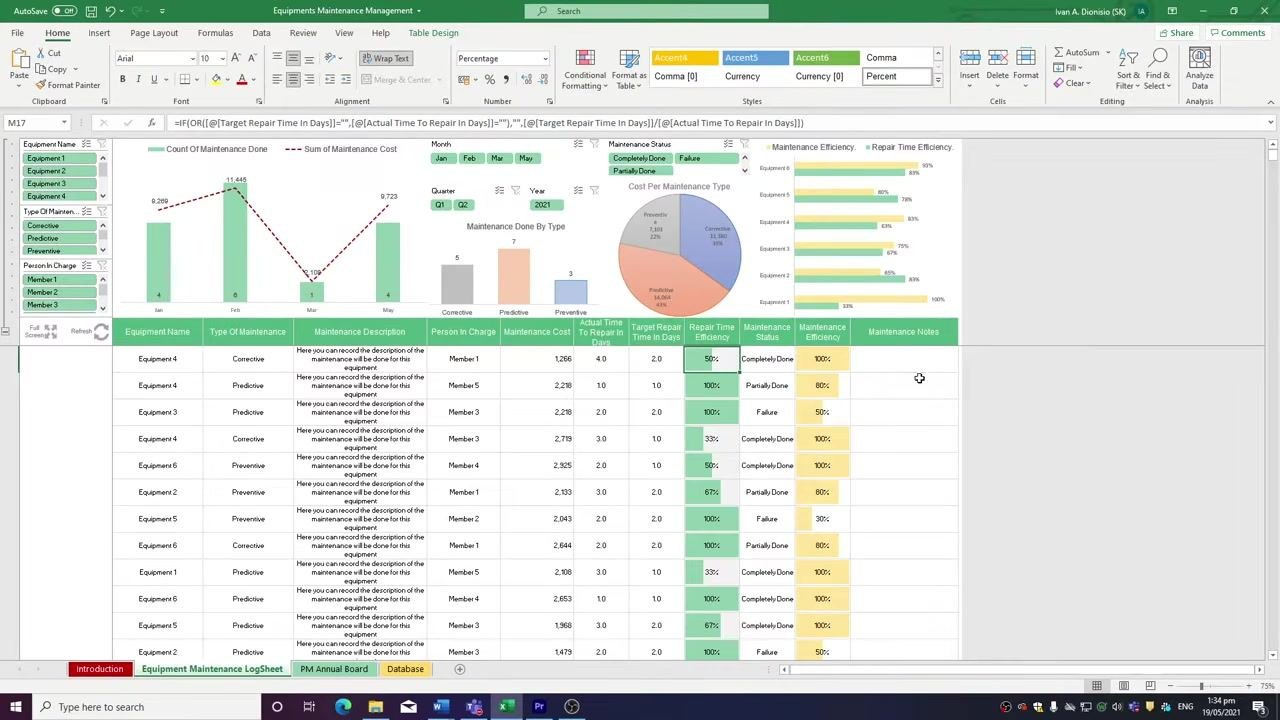
Use the Maintenance Notes column to record any additional information or comments about each maintenance activity. This column is provided for your reference and can be filled in as needed.
Review visual analytics
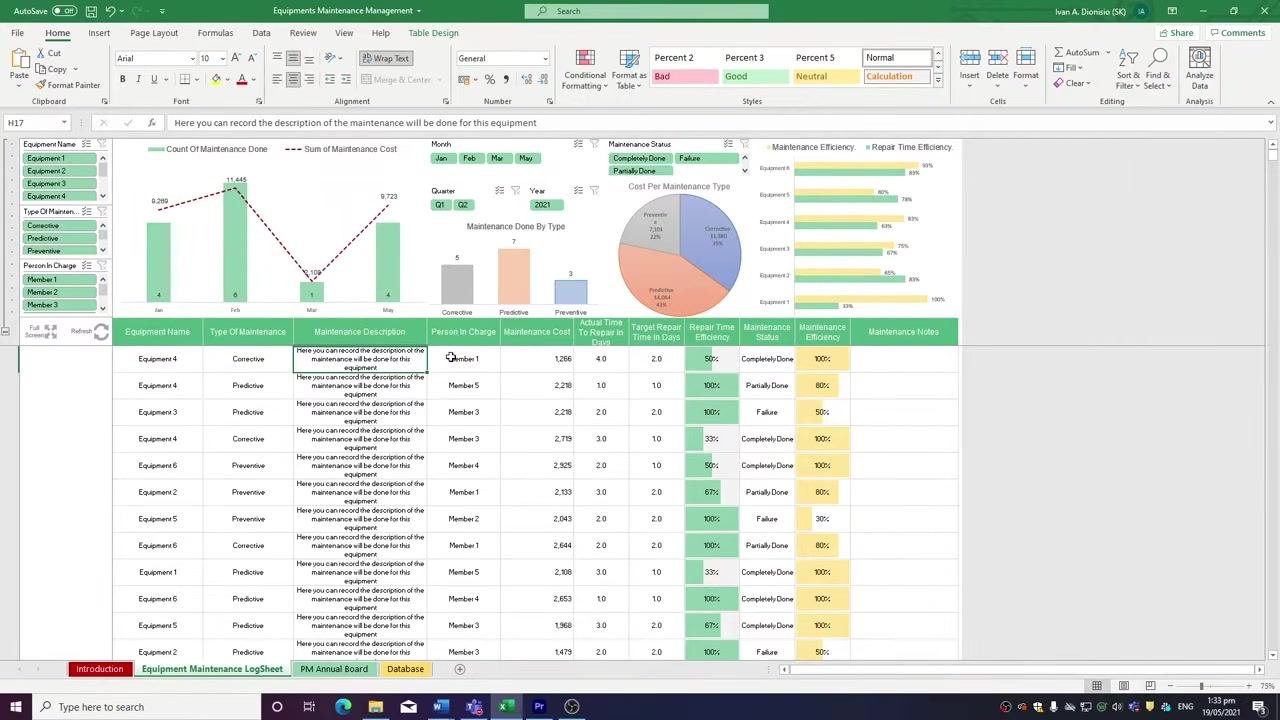
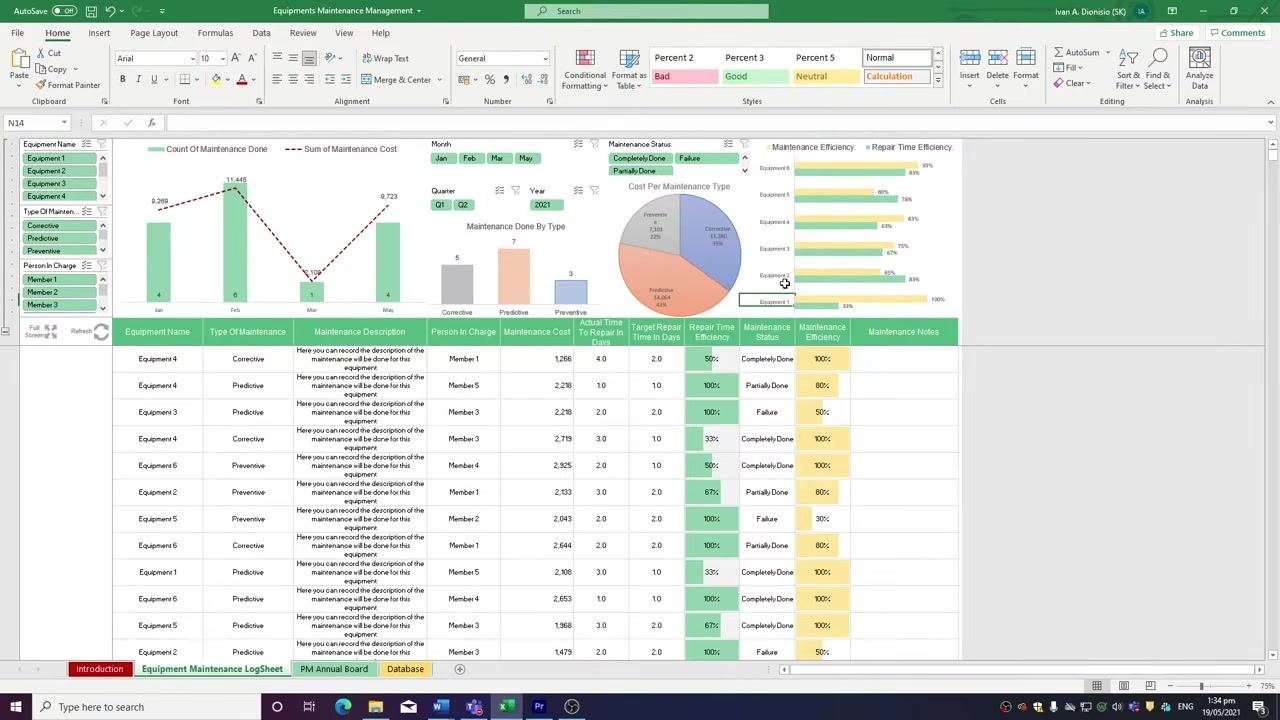
At the top of the LogSheet, examine the built-in charts and graphs:
- Count of Maintenance Done vs. Sum of Maintenance Cost: Bar and line chart showing monthly maintenance activity and costs.
- Maintenance Done By Type: Bar chart categorizing jobs as Corrective, Predictive, or Preventive.
- Cost Per Maintenance Type: Pie chart breaking down costs by maintenance type.
- Maintenance Efficiency and Repair Time Efficiency: Bar charts comparing efficiency metrics for each equipment.
Use these visuals to analyze trends, identify costly months, and assess efficiency.
Filter data using slicers
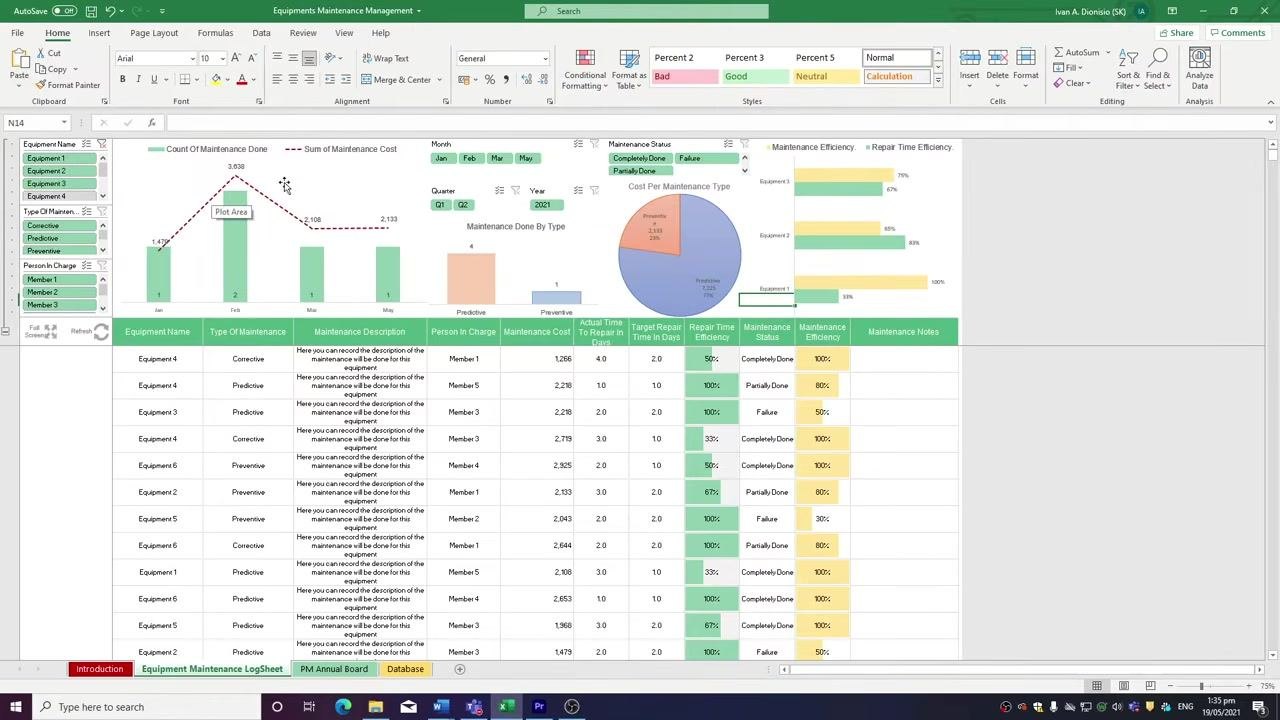
On the left side of the LogSheet, locate slicers for Equipment Name, Type of Maintenance, and Person in Charge. Additional slicers are available for Month, Quarter, and Maintenance Status.
To filter data, click a slicer value (for example, "Equipment 2") to display only relevant records and update the charts accordingly. To select multiple criteria, hold the Control (Ctrl) key while clicking additional values.
Clear filters
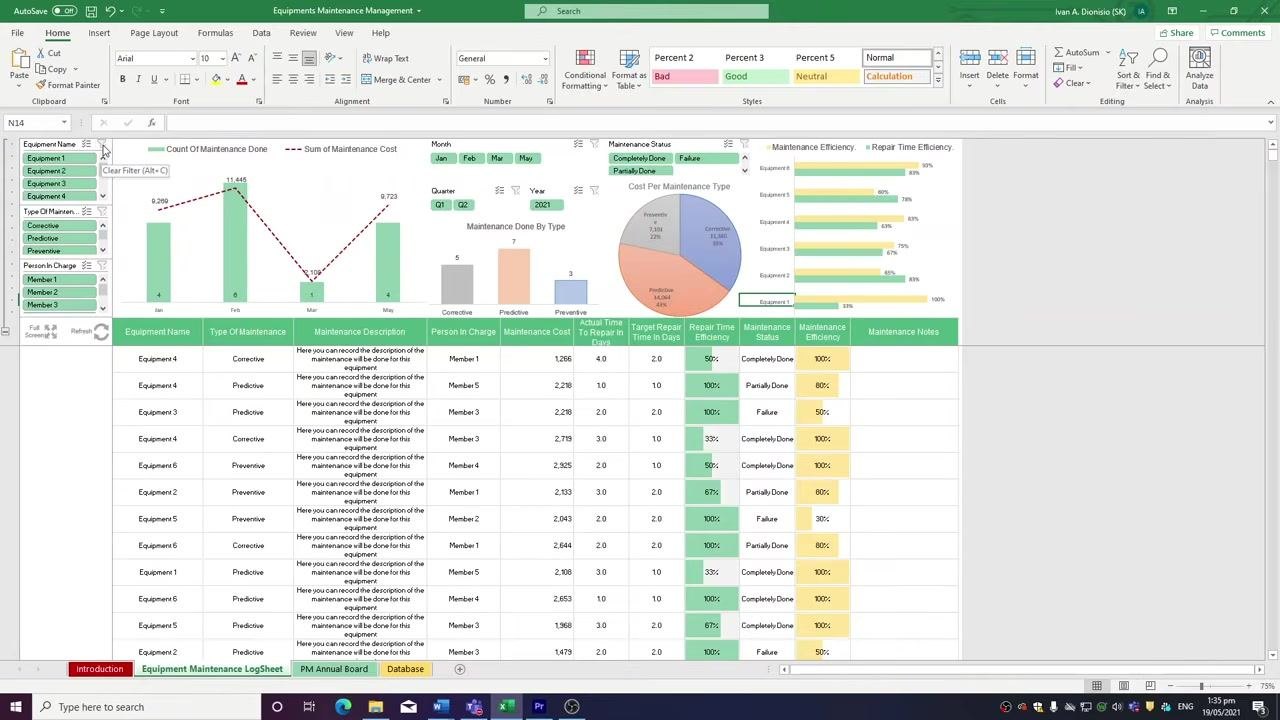
Each slicer group has a clear filter button at the top right. Click this button to reset the slicer and display all data again.
Use full screen mode (optional)
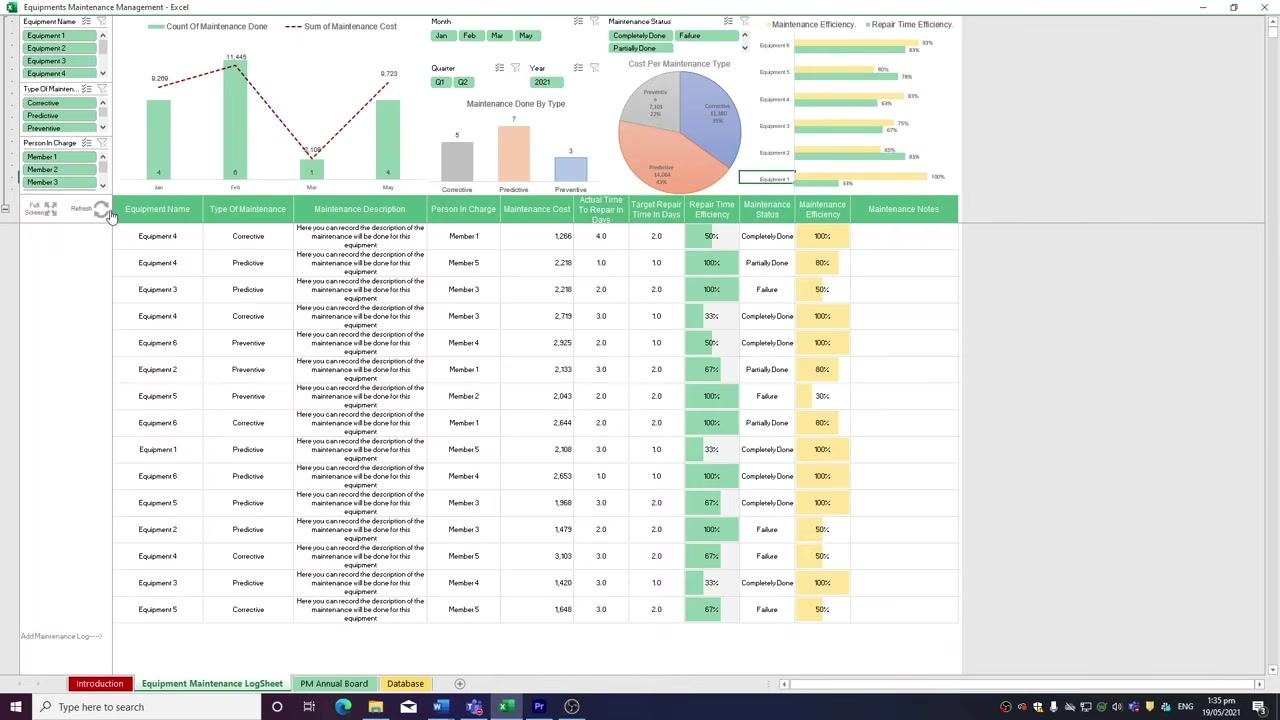
Click the Full Screen macro button, located on the left side of the sheet below the slicers, to hide the Excel ribbon and maximize your worksheet area. This makes charts and data tables bigger and easier to read, providing a focused workspace for analysis.
To exit full screen mode, use the same button or the standard Excel controls to restore the ribbon.
Refresh analytics after data entry
Click the Refresh button, located below the slicers on the left side of the sheet, whenever you input new data into the log sheet. This updates all charts, graphs, and analytics to reflect the latest information.
Always refresh after making changes to ensure your visualizations remain current.
Verification and summary
After completing these steps, confirm the following:
- The Database tab contains complete data for maintenance types, equipment, personnel, statuses, and years.
- The PM Annual Board reflects your company's off days and shows accurate, color-coded maintenance status for each tracked equipment.
- The Equipment Maintenance LogSheet contains complete entries for each maintenance activity, with the Repair Time Efficiency column left untouched (formula-driven).
- Charts and analytics have been refreshed to reflect the latest data, and slicers have been used to review specific equipment, maintenance types, or team members as needed.
What's next
For further automation and productivity enhancements, consider exploring advanced templates and training resources such as SimpleSheet's University. These resources can help streamline your Excel processes and improve overall workflow efficiency when using your equipment maintenance log template.
Generation details: cost, quality tiers
Docsie billed 3,000 credits ($2.10) to analyze this 6-minute video at standard quality. The rewrite, template fill and Word/PDF exports were included. The same video at each quality tier:
| Quality | Frames sampled | Credits | Approx. cost |
|---|---|---|---|
| Draft | every 16-30 s | 1,500 | $1.05 |
| Standard (this guide) | every 8-15 s | 3,000 | $2.10 |
| Detailed | every 4-7 s | 6,000 | $4.20 |
| Ultra | every 1-3 s | 12,000 | $8.40 |
Credits priced at $0.70 per 1,000; plans include a monthly allowance. Enterprise customers on on-premise or bring-your-own-model deployments run this on their own inference and pay no per-video credits.
Generated by Docsie Video-to-Docs on 2026-09-10 from a 5-minute video. Screenshots are frames from the source video and belong to their creator, Simple Sheets, whose original is embedded above. If you own this video and want the guide removed or credited differently, contact us and we will act within one business day.