
How to Create a Custom Report in Workday
This guide explains how to create a custom report in Workday, from selecting a data source through configuring columns, sorting, and filters. Follow the steps below to build a report that fits your organization's reporting needs.
Video: Workday Creating Custom Reports | ZaranTech by Workday Learner Community (2023). All credit for the demonstration goes to the creator; watch the original on YouTube. The written guide below was generated from this video by Docsie. Creator? Request a change or removal.
This guide explains how to create a custom report in Workday, from selecting a data source through configuring columns, sorting, and filters. Follow the steps below to build a report that fits your organization's reporting needs.
Prerequisites
Before you start, it helps to understand the data source types available in Workday, since the data source you choose determines the primary business object and starting view for your report:
- Standard: Multiple data sources can be delivered for the same business object, each representing a different view.
- Indexed: Fewer data sources are needed for the same business object. You can apply data source filters to a single indexed data source to create different views. Indexed data sources are optimized for performance, aggregation, and faceted filtering, and are delivered for high-volume areas such as Workers, Time Blocks, and Journal Lines.
- Custom: A data source you define yourself for specific reporting needs.
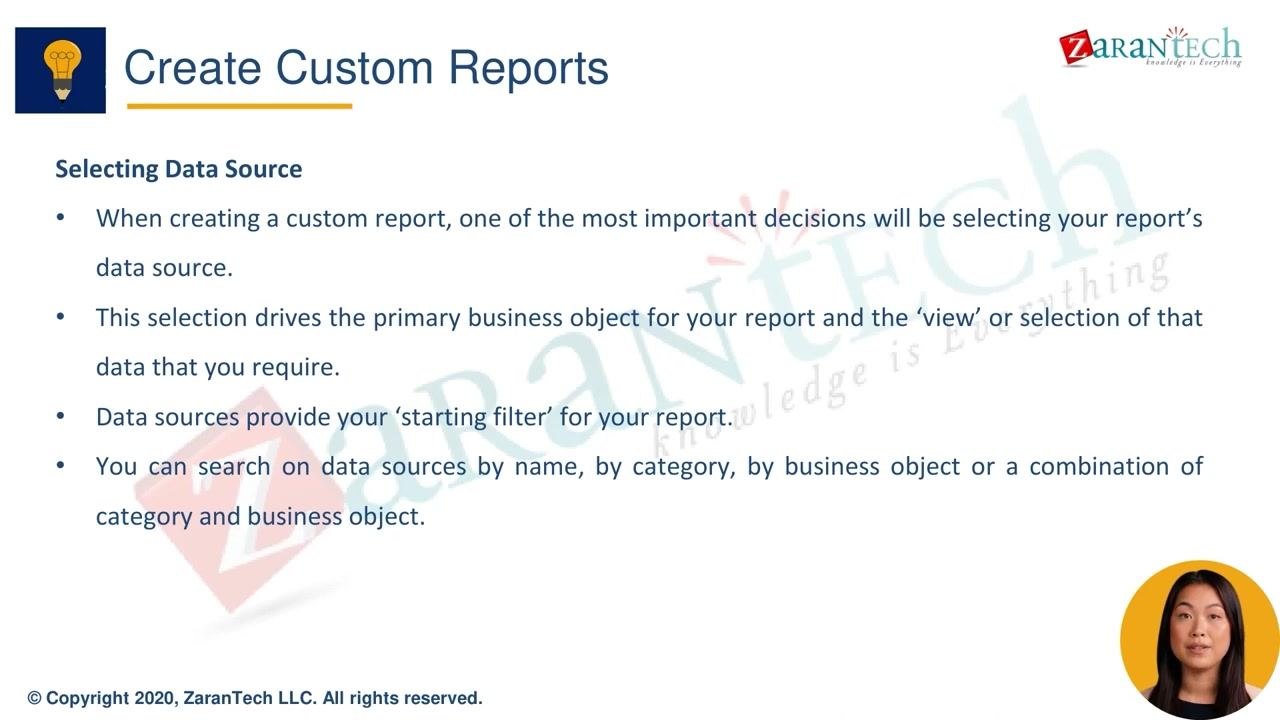
Because the data source is the most critical step in the process, keep this distinction in mind before you begin building your report.
Open the Create Custom Report task
Navigate to the Create Custom Report task in Workday. This is where you name your report, choose a report type, select a data source, and optionally mark the report as temporary.
Review the key configuration steps
Before configuring your report, review the sequence you will follow:
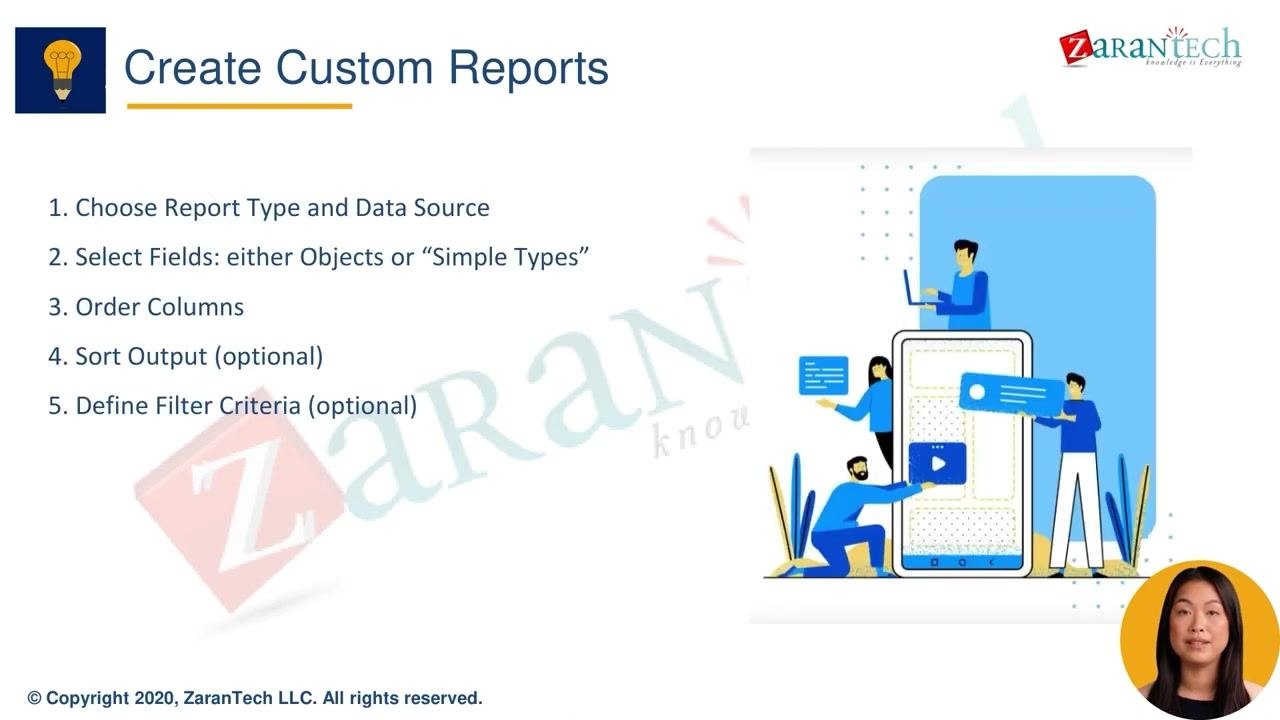
- Choose a report type and data source.
- Select the fields to include (objects or simple types such as text, numbers, or dates).
- Order the columns as needed.
- Sort the output (optional).
- Define filter criteria (optional).
Choose a report type
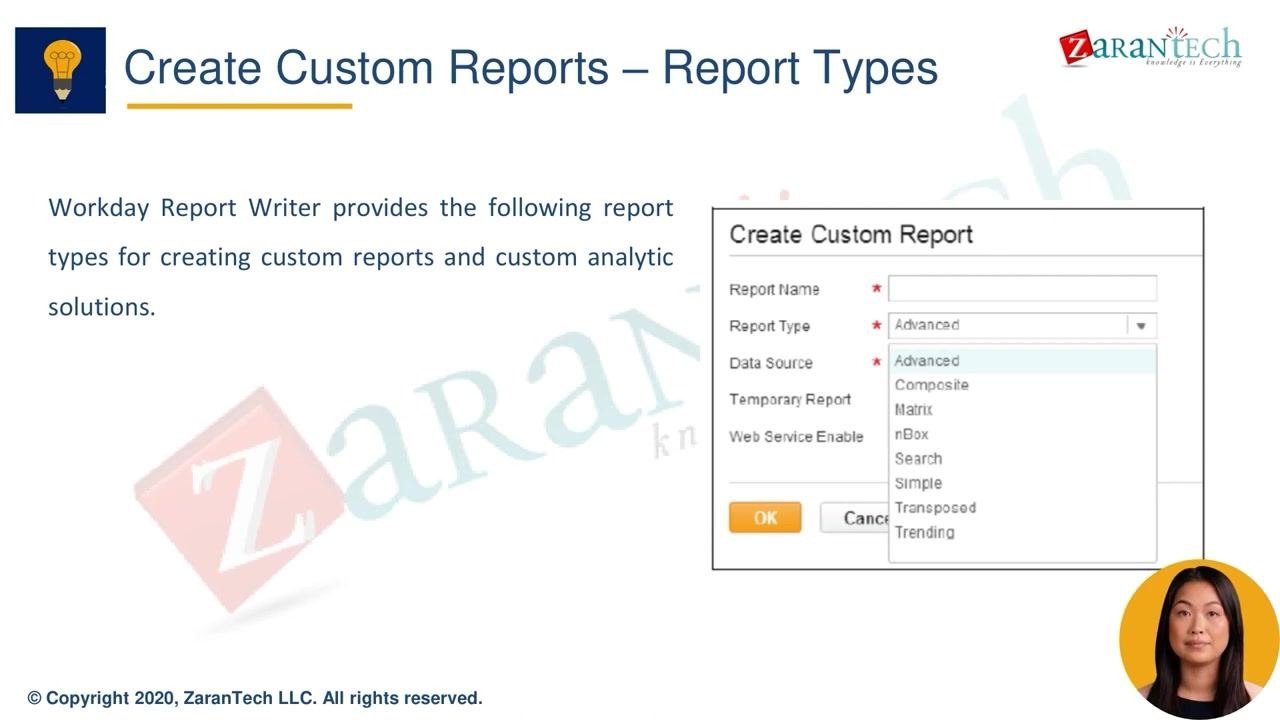
Workday offers several report types, each suited to different reporting needs:
- Simple: Select fields, sort, and filter on a single object.
- Analytic: Aggregate fields using counts, sums, and averages.
- Matrix: Generate pivot table-style reports for comparisons.
- Advanced: Use advanced reporting expressions for maximum flexibility.
The dropdown menu also includes Composite, nBox, Search, Transposed, and Trending as additional report type options.
Compare report type layouts
Before committing to a report type, you can compare how each one presents data:
- Advanced: Detailed, flexible reports with multiple configuration options.
- Search: Focused on finding and filtering data.
- Matrix: Displays data in a pivot table format for easy comparison.
- nBox: Visualizes data in a grid or box format.
- Transposed: Swaps rows and columns for alternative data views.
- Trending: Shows data trends over time with charts.
- Composite: Combines multiple data sets or views in one report.
Select the data source
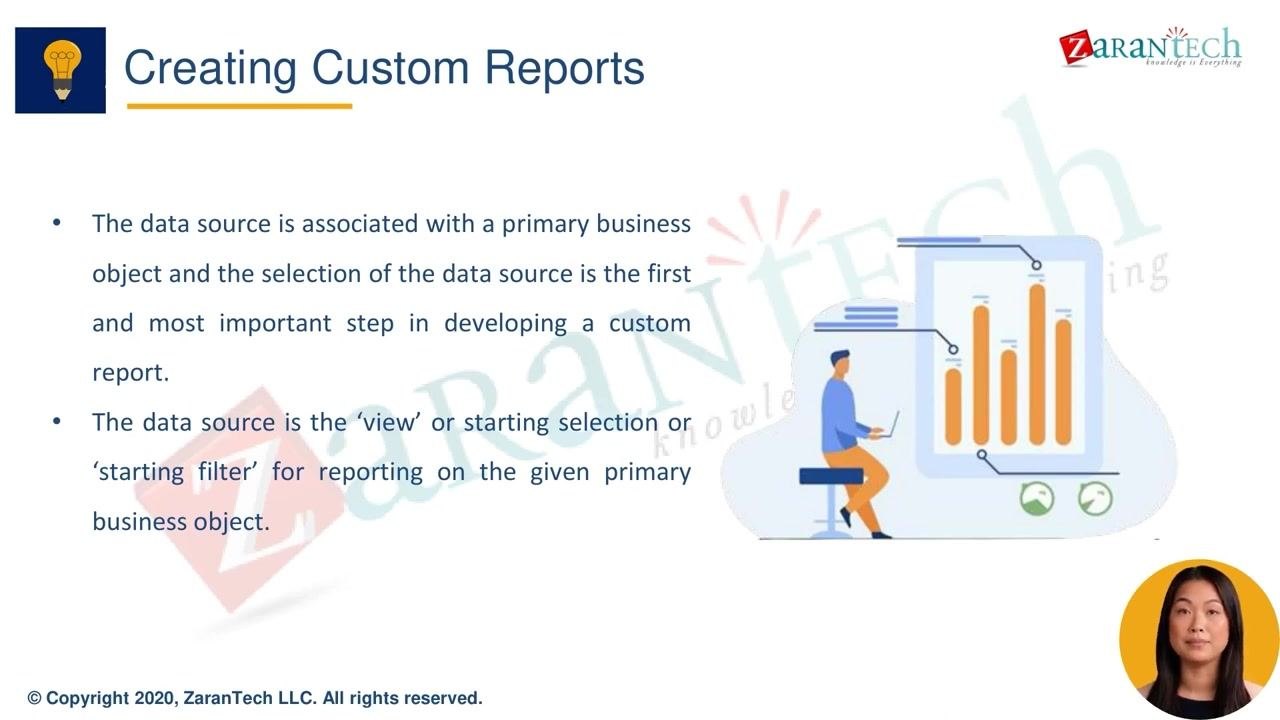
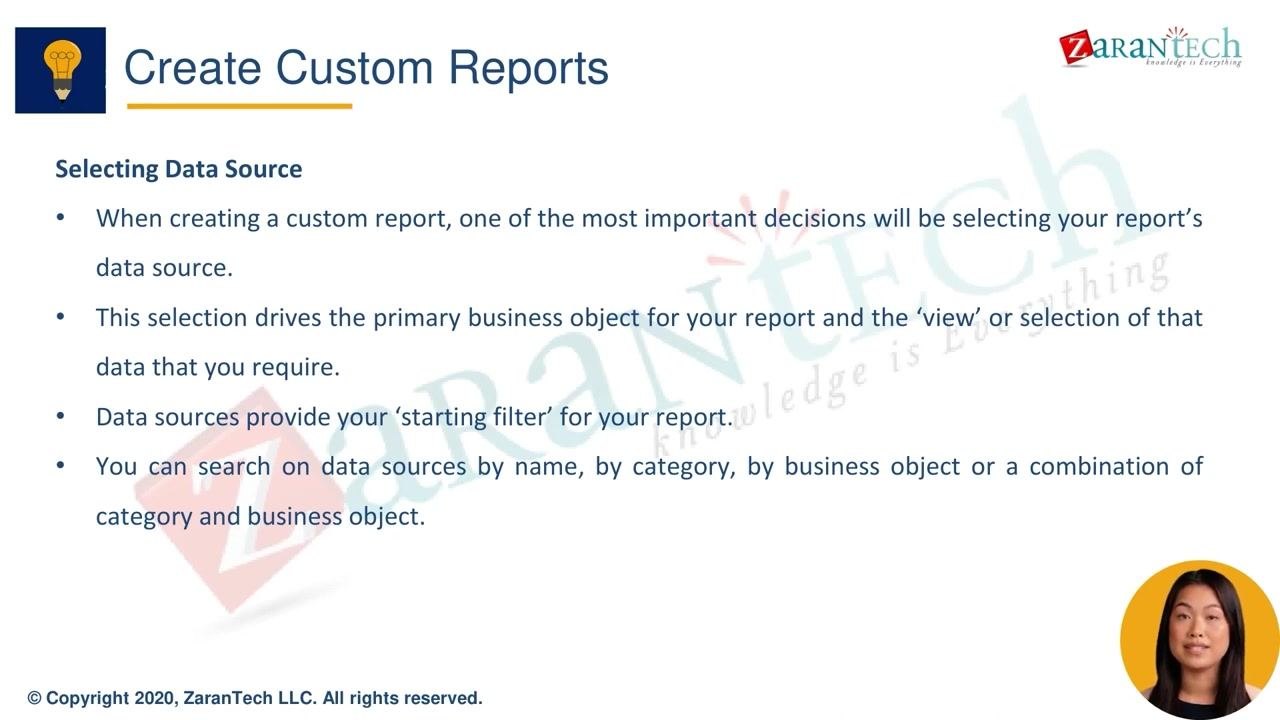
Selecting the correct data source is one of the most important decisions when creating a custom report, since it determines:
- The primary business object for your report.
- The "view" or selection of data required.
- The starting filter for your report.
You can search for a data source by name, category, business object, or a combination of category and business object.
Search for and preview a data source
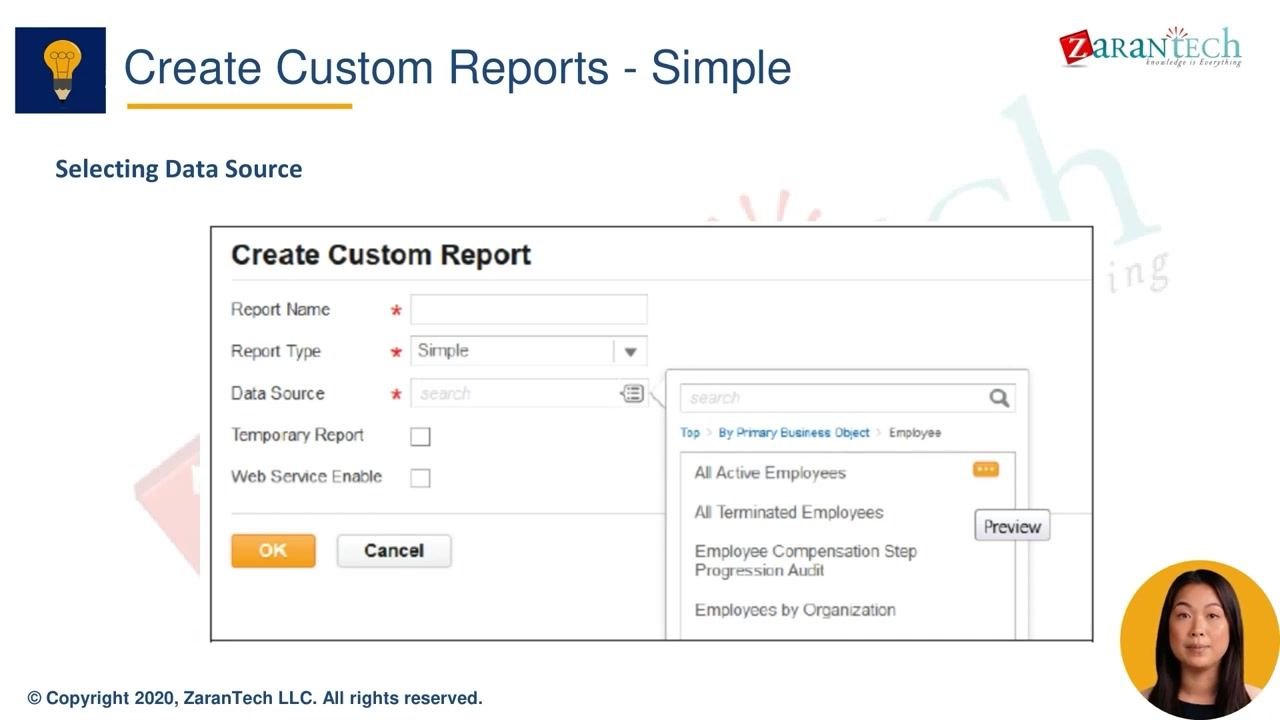
In the Create Custom Report dialog, enter the report name and select the report type (for example, Simple). Use the search field under Data Source to find the data source you need.
You can filter results by primary business object—for example, filtering by Employee shows options such as All Active Employees or All Terminated Employees. Use the Preview button to review a data source before selecting it.
Configure the Columns, Sort, and Filter tabs
For Simple reports, configure your report using three main tabs:
- Columns: Select and arrange the fields to display in your report.
- Sort: Define the sort order for your report results.
- Filter: Set filter criteria to narrow down the data shown.
You can also add or remove columns, change the order of fields, override column labels, and set field options such as displaying currency symbols.
Preview and finalize your report
After configuring your columns, sort order, and filters, review your selections. Use the Preview button to see a sample of your report output, and make adjustments as needed before saving and running the report.
What's next
Once your report is saved and running, keep in mind the difference between standard and indexed data sources for future reports: standard data sources offer multiple views for the same business object, while indexed data sources are optimized for performance and are best suited for high-volume areas like Workers, Time Blocks, and Journal Lines. Choosing the right type for each new report will help you get the most accurate and efficient results in Workday.


Generation details: cost, quality tiers
Docsie billed 2,500 credits ($1.75) to analyze this 5-minute video at standard quality. The rewrite, template fill and Word/PDF exports were included. The same video at each quality tier:
| Quality | Frames sampled | Credits | Approx. cost |
|---|---|---|---|
| Draft | every 16-30 s | 1,250 | $0.88 |
| Standard (this guide) | every 8-15 s | 2,500 | $1.75 |
| Detailed | every 4-7 s | 5,000 | $3.50 |
| Ultra | every 1-3 s | 10,000 | $7.00 |
Credits priced at $0.70 per 1,000; plans include a monthly allowance. Enterprise customers on on-premise or bring-your-own-model deployments run this on their own inference and pay no per-video credits.
Generated by Docsie Video-to-Docs on 2026-09-14 from a 4-minute video. Screenshots are frames from the source video and belong to their creator, Workday Learner Community, whose original is embedded above. If you own this video and want the guide removed or credited differently, contact us and we will act within one business day.