
How to Debug a Fiori App in SAP
When you need to troubleshoot, extend, or simply understand how an SAP Fiori application retrieves its data, the first task is identifying the OData service behind it. This guide walks you through locating that service using browser developer tools, tracing its implementation in SAP GUI, and setting breakpoints so you can debug a Fiori app in SAP down to the ABAP code that handles the request.
Video: SAP Fiori: How to Debug FIORI App and the Debugger will trigger at SAP Back End? by arghadip kar (2020). All credit for the demonstration goes to the creator; watch the original on YouTube. The written guide below was generated from this video by Docsie. Creator? Request a change or removal.
When you need to troubleshoot, extend, or simply understand how an SAP Fiori application retrieves its data, the first task is identifying the OData service behind it. This guide walks you through locating that service using browser developer tools, tracing its implementation in SAP GUI, and setting breakpoints so you can debug a Fiori app in SAP down to the ABAP code that handles the request.
Prerequisites
- Access to the SAP Fiori Launchpad with a browser that supports developer tools (for example, pressing
F12). - Access to an SAP GUI session with authorization to run
/IWFND/MAINT_SERVICE. - Authorization to open the Class Builder and set breakpoints in ABAP classes.
Identify the OData service
Open the SAP Fiori Launchpad and search for the app
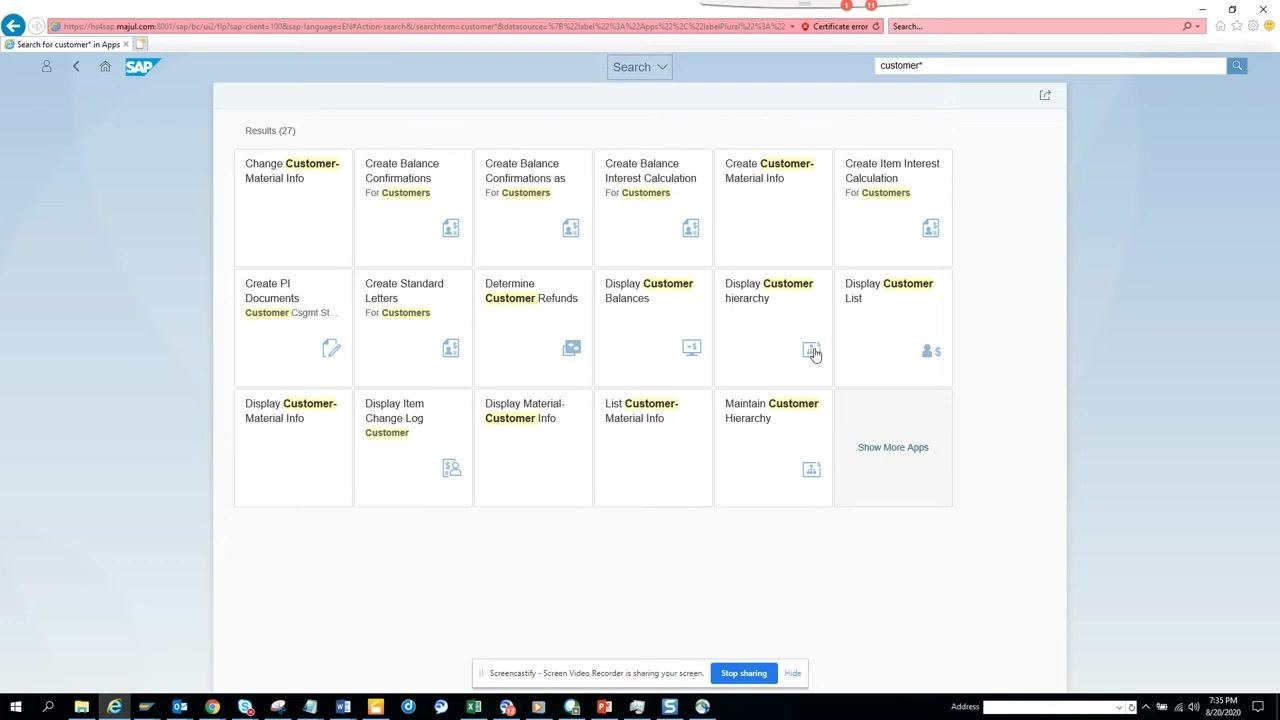
Launch the SAP Fiori Launchpad in your web browser. Use the search bar in the top right and enter customer* to filter for customer-related apps. Locate the Display Customer Balances tile among the search results.
Click the Display Customer Balances tile to open the app. The screen displays fields such as Customer, Company Code, and Fiscal Year, with Company Code pre-filled as 1000 and Fiscal Year pre-filled as 2020.
Open developer tools to prepare for inspection
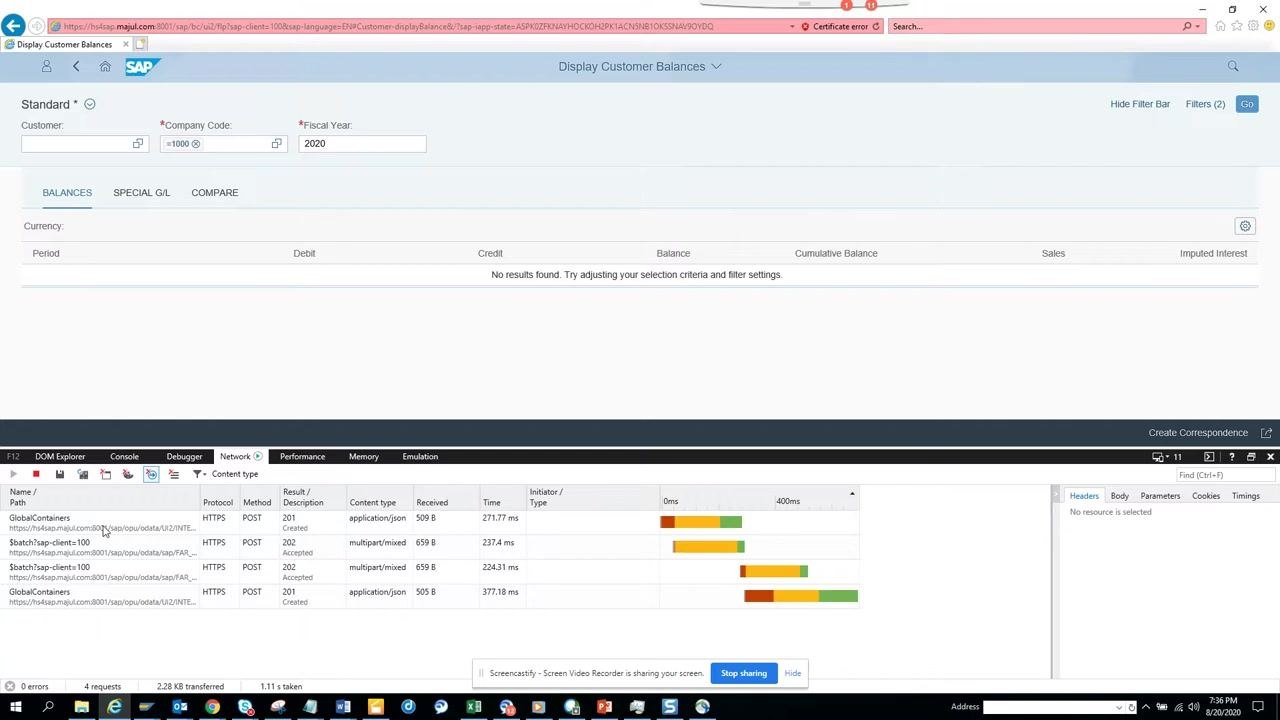
To find the OData service behind the app, open your browser's developer tools by pressing F12. This opens a panel at the bottom of your browser window where you can monitor network activity.
Trigger the OData call
With developer tools open, click the Go button on the app screen to trigger the backend call. This refreshes the data and generates network activity you can inspect in the developer tools.
Locate the OData service in network activity
In the developer tools, switch to the Network tab. Look for requests made to URLs containing /sap/opu/odata/. Identify the relevant OData service call, for example:
https://hs4sap.majuli.com:8001/sap/opu/odata/sap/FAR_CUST_BALANCE_SRV/$batch?sap-client=100
Select the request and copy the full URL.
Document the OData service URL
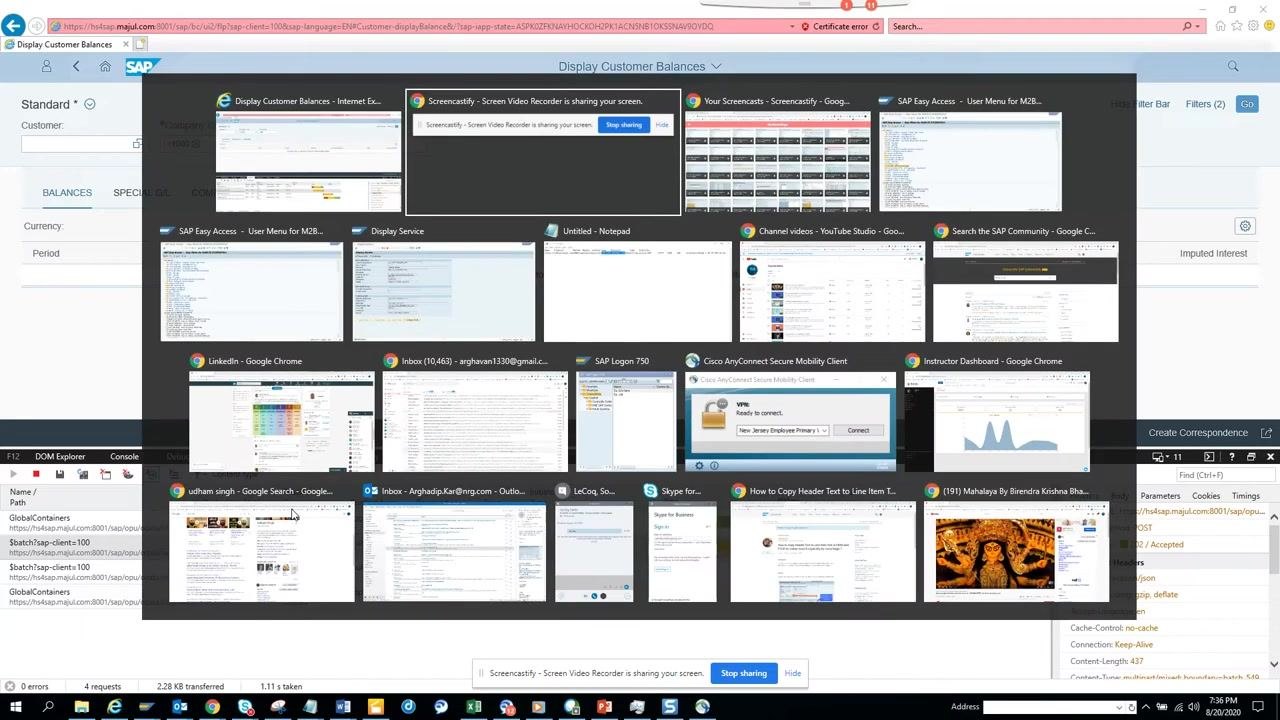
Open a text editor and paste the copied OData service URL so you have it for reference in the next steps.
Trace and debug the OData service implementation
Access SAP GUI to maintain OData services
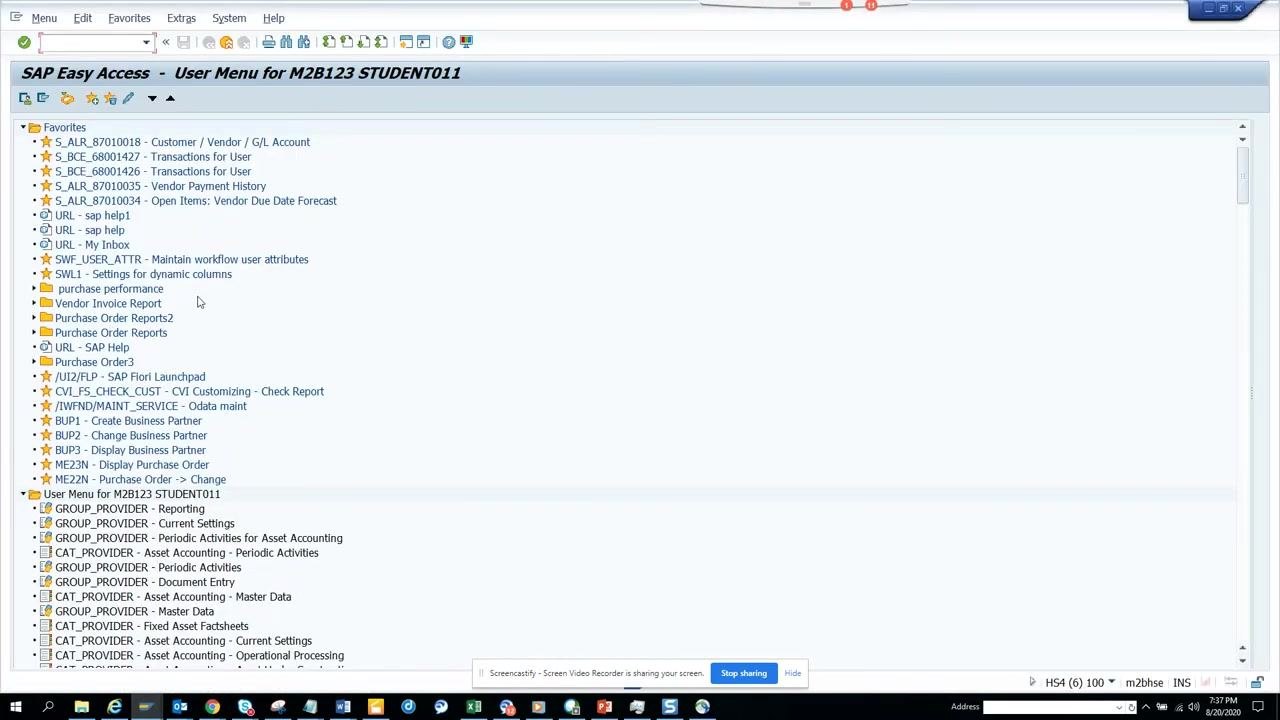
Switch to your SAP GUI session. In the SAP Easy Access menu, locate or search for the transaction code /IWFND/MAINT_SERVICE (OData service maintenance) and double-click it to open the transaction.
Search for the OData service in SAP GUI
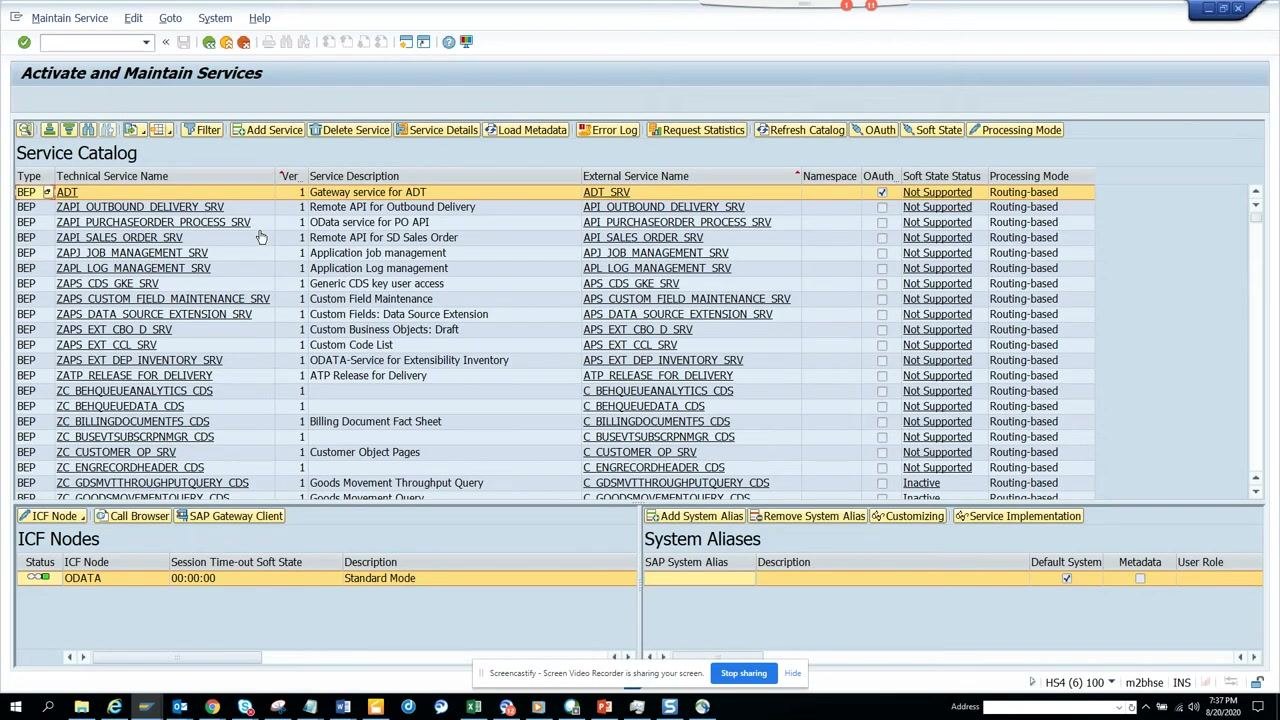
In the /IWFND/MAINT_SERVICE transaction, click the Find button. Paste the OData service name (for example, FAR_CUST_BALANCE_SRV) into the search field and press Enter. Locate the service in the Service Catalog list.
Select and open the OData service
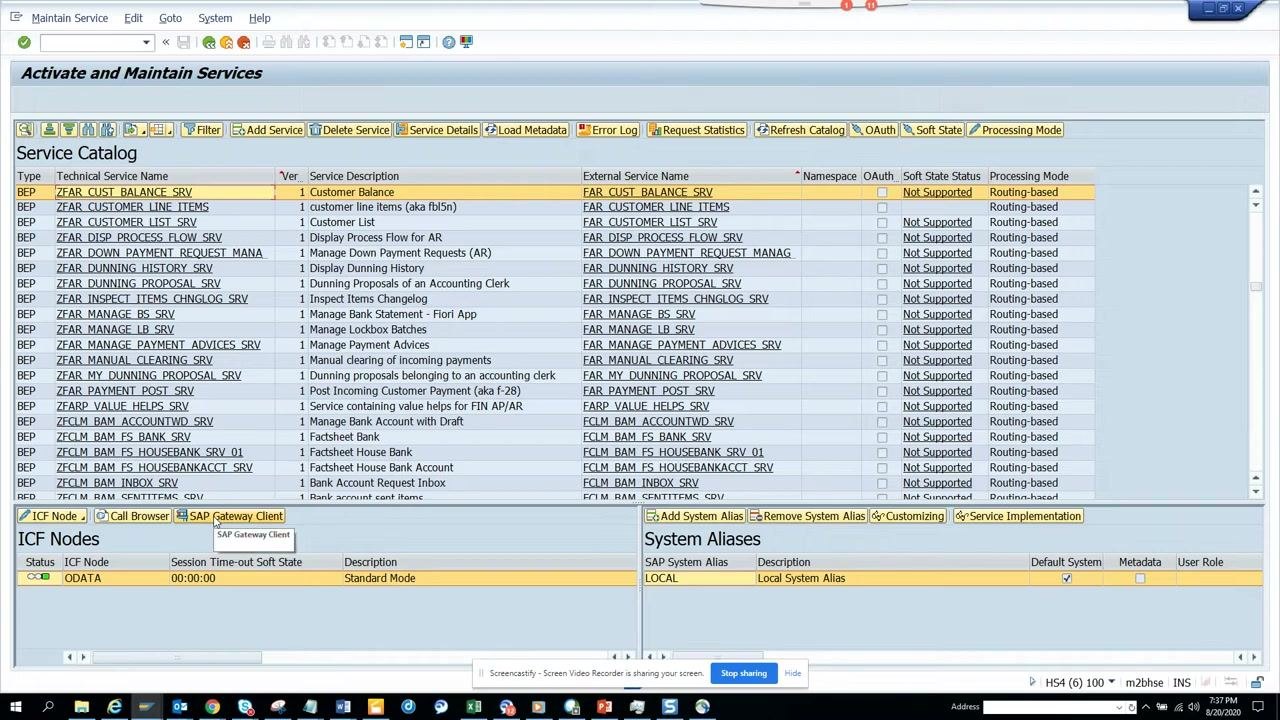
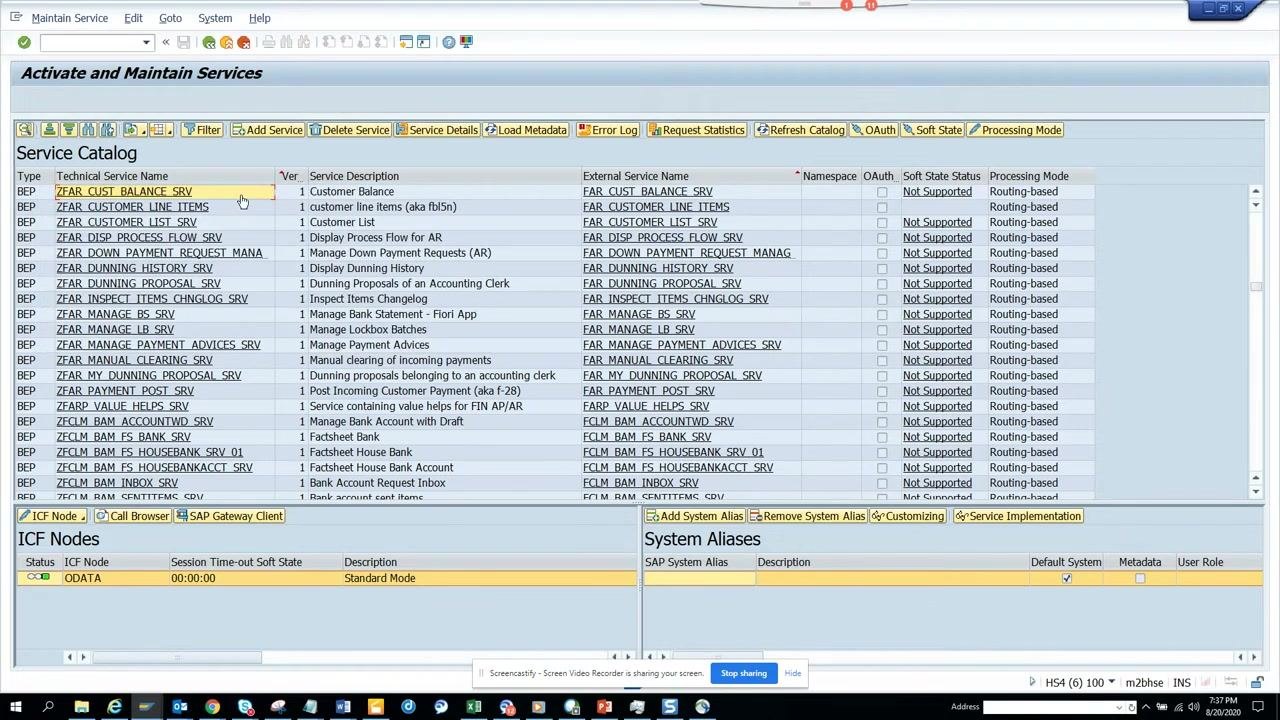
Double-click the relevant service entry (for example, Z_FAR_CUST_BALANCE_SRV). With the service highlighted, click the SAP Gateway Client button at the bottom of the screen.
Access the service implementation
In the SAP Gateway Client window, confirm the Request URI matches your OData service (for example, /sap/opu/odata/sap/FAR_CUST_BALANCE_SRV/?$format=xml). Click the Service Implementation button in the toolbar.
Review the service details
The Display Service screen shows detailed information, including:
- Technical Service Name:
FAR_CUST_BALANCE_SRV - Service Version:
1 - Description:
Customer Balance - Data Provider Class:
CL_FAR_CUST_BALANCE_DPC_EXT - Model Provider Class:
CL_FAR_CUST_BALANCE_MPC_EXT
Note these details for reference, since you will need the Data Provider Class in the next step.
Set a breakpoint for debugging
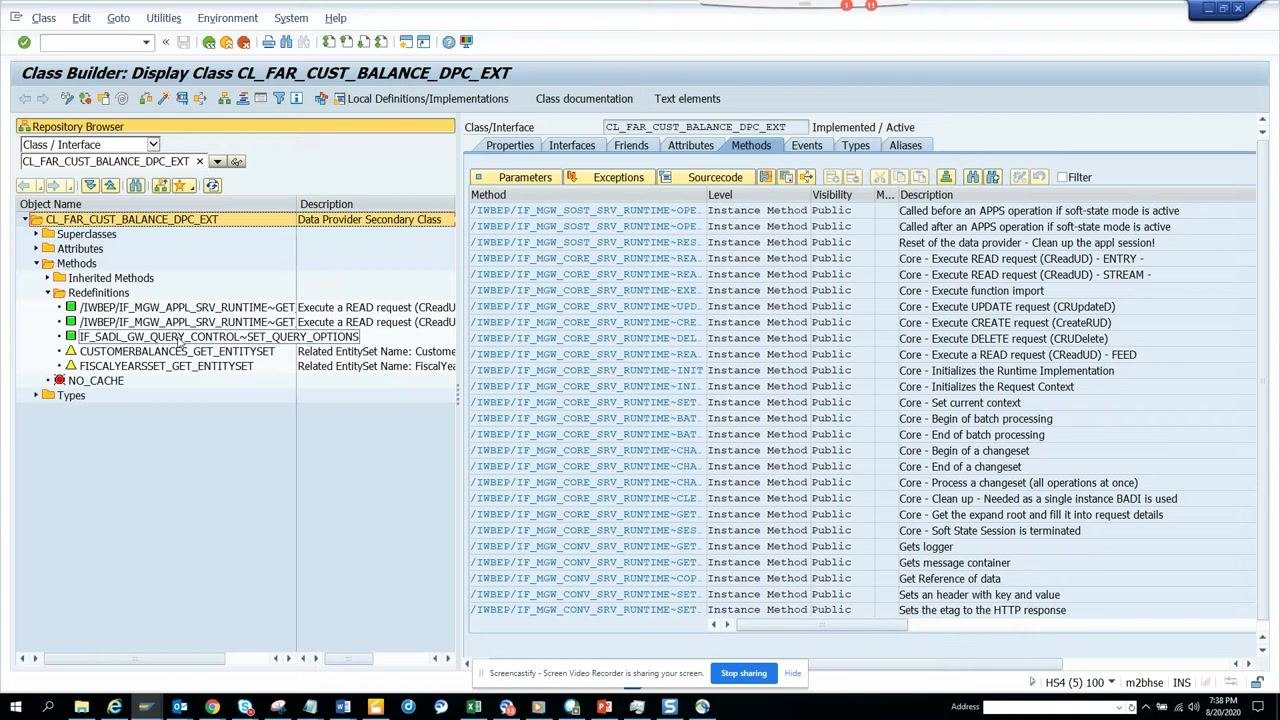
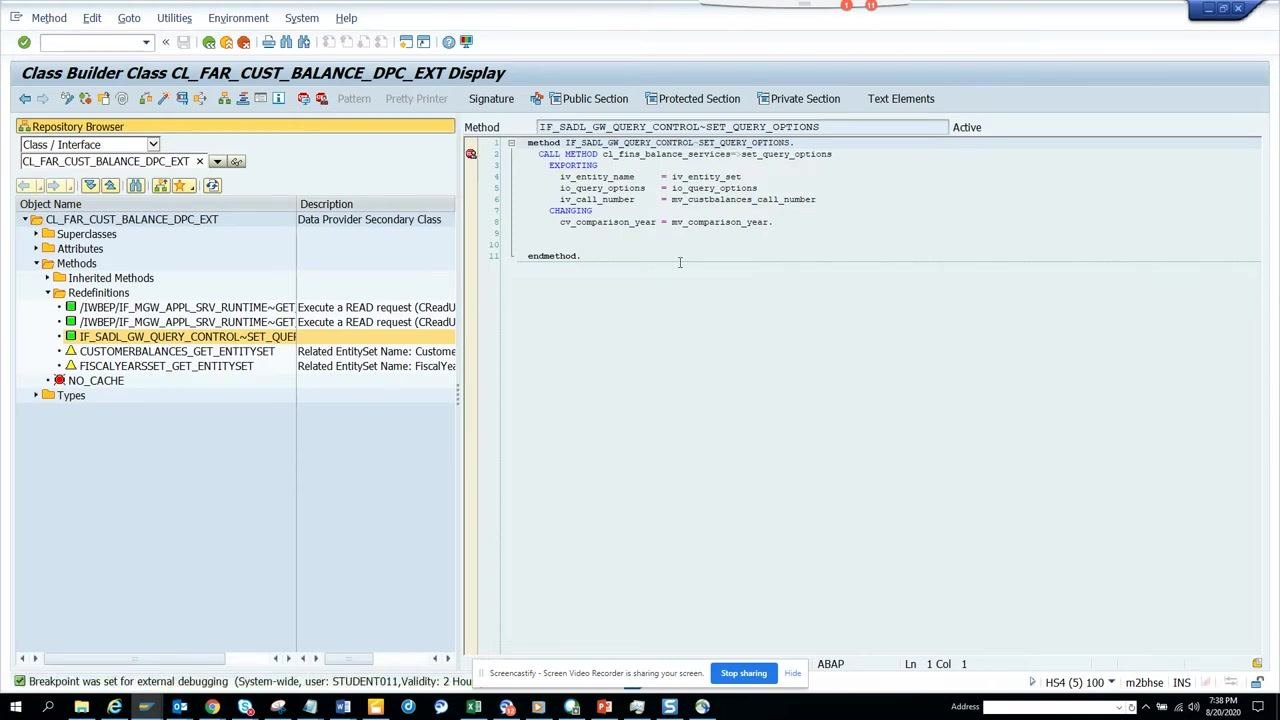
In the Methods list, locate and select the method you want to debug, for example IF_SADL_GW_QUERY_CONTROL~SET_QUERY_OPTIONS. Double-click the method to view its implementation, then set an external breakpoint in the method.
Return to the Fiori app and trigger the OData call
Switch back to the Fiori app (Display Customer Balances). Enter a Customer (for example, 1710) and Fiscal Year (for example, 2020), then click Go to trigger the OData call.
If you see an error such as "Maximum number of SAP GUI sessions reached," close unused SAP GUI sessions and try again.
Inspect query options and debug in ABAP
Confirm the debugger is active
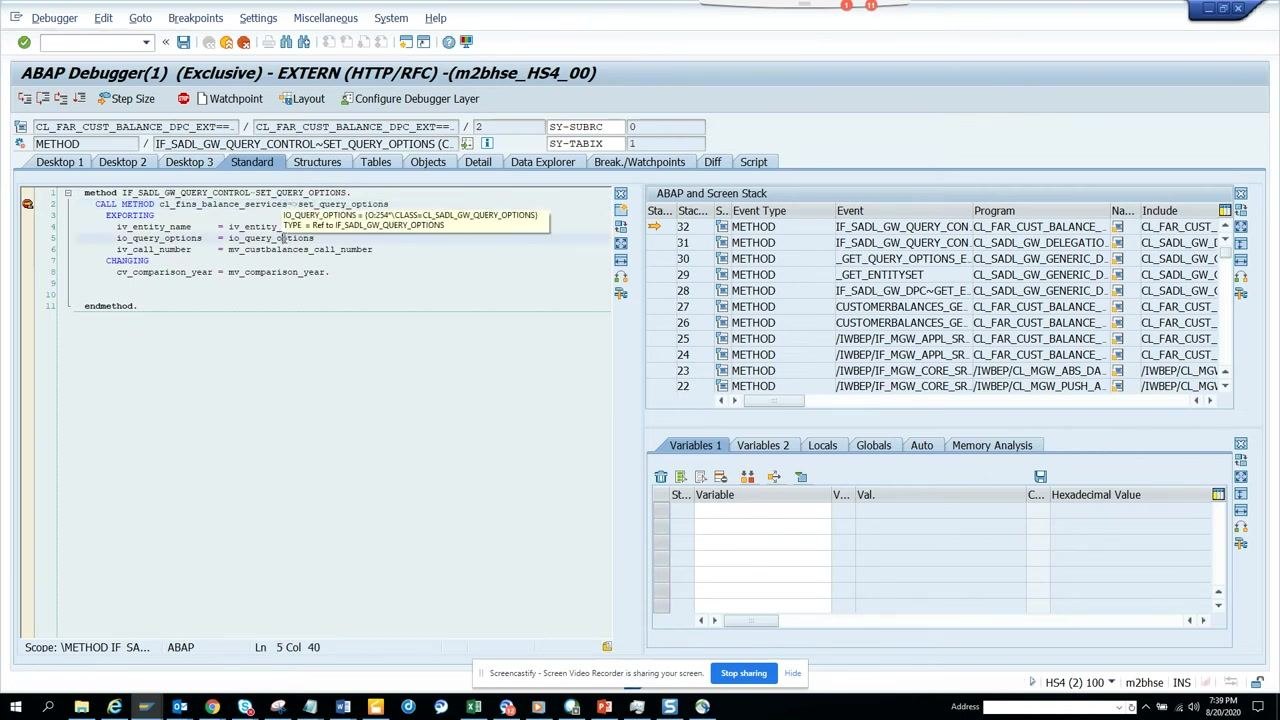
After triggering the OData call from the Fiori app, check the SAP GUI window and confirm the ABAP Debugger window is active and blinking, which indicates execution has stopped at your breakpoint. This confirms the backend logic is paused for inspection.
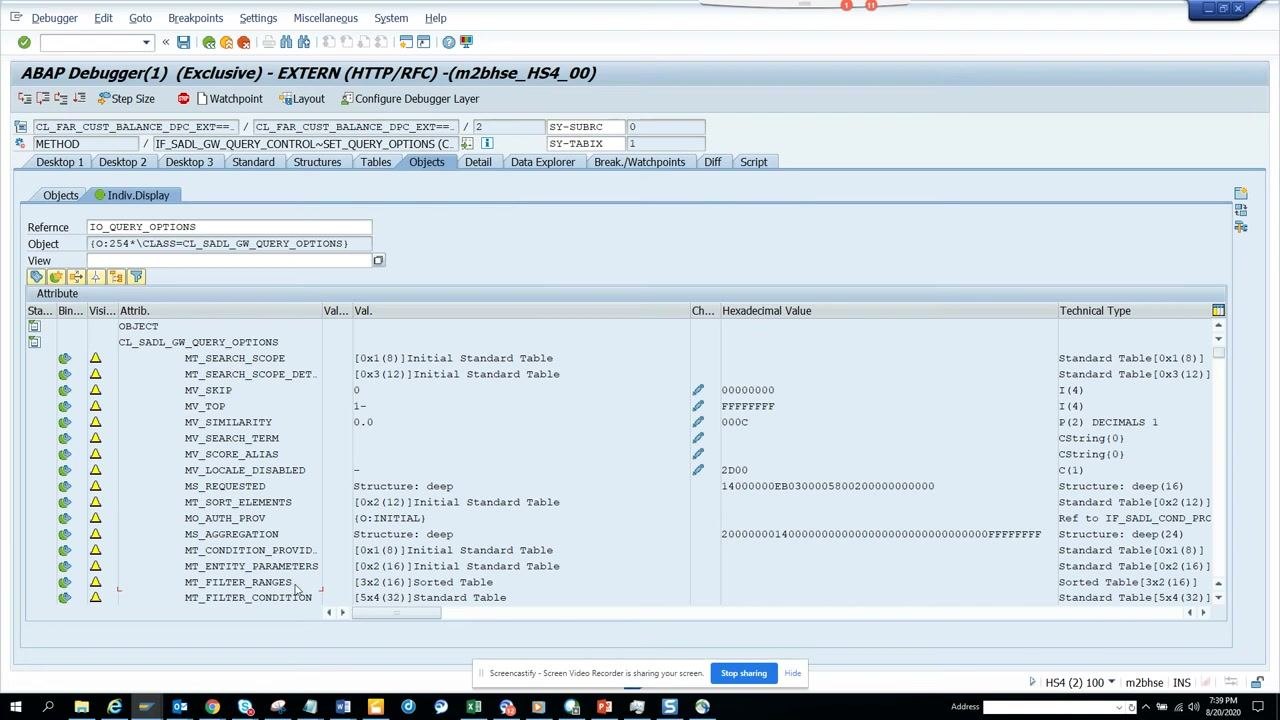
In the ABAP Debugger, locate the method where you set the breakpoint (for example, IF_SADL_GW_QUERY_CONTROL~SET_QUERY_OPTIONS). In the variables pane, find the IO_QUERY_OPTIONS object and double-click it to expand and view its attributes.
Review key attributes such as:
MT_FILTER_RANGESMT_FILTER_CONDITION
These attributes display the filter values and conditions passed from the Fiori app, for example Customer = 1710 and Fiscal Year = 2020.
Extend debugging as needed
If you want to tweak the logic, add more filters, or further analyze the data being read, you can do so directly in the debugger. Use the debugger tools to step through the code, inspect additional variables, or set further breakpoints as required.
Summary
By following these steps, you can identify the OData service behind any SAP Fiori app, trace its implementation in SAP GUI, and set breakpoints to debug a Fiori app in SAP at the ABAP level. This workflow lets you inspect the exact filter values and conditions passed from the app, making it a reliable approach for troubleshooting, custom enhancements, or understanding data flow in Fiori applications.
Generation details: cost, quality tiers
Docsie billed 2,500 credits ($1.75) to analyze this 5-minute video at standard quality. The rewrite, template fill and Word/PDF exports were included. The same video at each quality tier:
| Quality | Frames sampled | Credits | Approx. cost |
|---|---|---|---|
| Draft | every 16-30 s | 1,250 | $0.88 |
| Standard (this guide) | every 8-15 s | 2,500 | $1.75 |
| Detailed | every 4-7 s | 5,000 | $3.50 |
| Ultra | every 1-3 s | 10,000 | $7.00 |
Credits priced at $0.70 per 1,000; plans include a monthly allowance. Enterprise customers on on-premise or bring-your-own-model deployments run this on their own inference and pay no per-video credits.
Generated by Docsie Video-to-Docs on 2026-10-14 from a 4-minute video. Screenshots are frames from the source video and belong to their creator, arghadip kar, whose original is embedded above. If you own this video and want the guide removed or credited differently, contact us and we will act within one business day.