
How to Create a Crystal Report in SAP Business One
Creating a Crystal Report in SAP Business One allows you to connect to your database, select the data you need, and build a customized report layout. This guide walks you through the full process—from opening SAP Crystal Reports to setting a data source, adding fields, previewing results, and saving your finished report.
Video: How To create Crystal report for SAP b1 | SAP Crystal Reports for Beginners | by Learn online. All credit for the demonstration goes to the creator; watch the original on YouTube. The written guide below was generated from this video by Docsie. Creator? Request a change or removal.
Creating a Crystal Report in SAP Business One allows you to connect to your database, select the data you need, and build a customized report layout. This guide walks you through the full process—from opening SAP Crystal Reports to setting a data source, adding fields, previewing results, and saving your finished report.
Prerequisites
- SAP Crystal Reports installed on your desktop
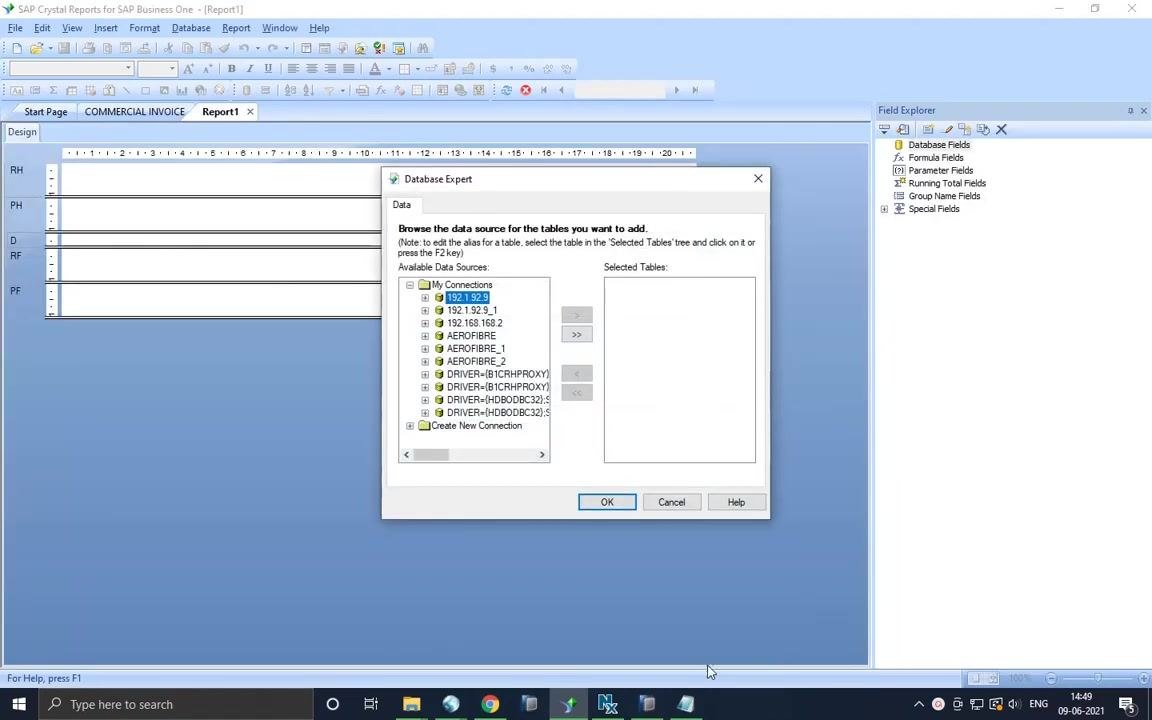
- Access to the relevant SAP Business One database connection (for example, a server address such as
192.1.92.9,192.192.9.1, or192.168.168.2)
Launch SAP Crystal Reports
Open the SAP Crystal Reports application from your desktop or start menu to begin building your report.
Start a new report
In SAP Crystal Reports, locate the Start a New Report section and select Blank report from the available options.
Set the data source
After you select Blank report, the Database Expert dialog appears automatically. Under Available Data Sources, expand My Connections and select the appropriate server or database connection for your report.
Expand and select the database connection
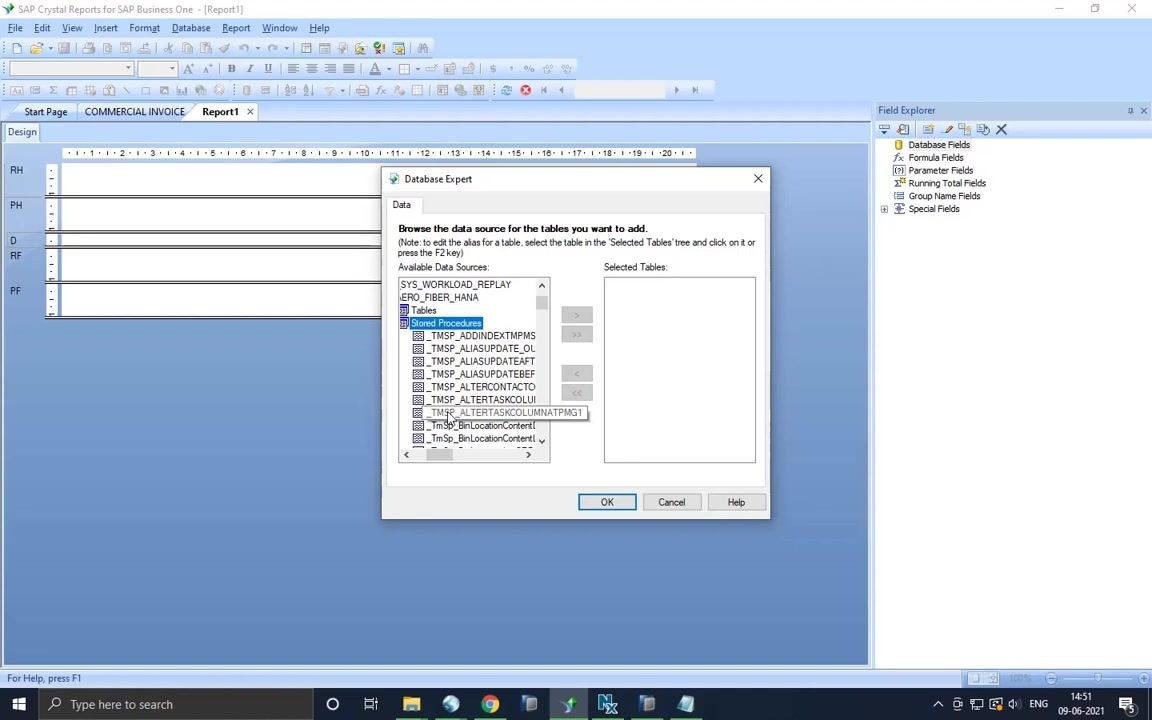
In the Database Expert dialog, expand the database connection you selected (for example, DRIVER={HDBODBC32}). Browse through the available folders, such as Tables and Stored Procedures, and locate the Stored Procedures section to find the relevant procedure for your report.
Choose the required stored procedure
Select the stored procedure you need for your report (for example, Sp_BOM), then click the right arrow button to move it into the Selected Tables pane. Click OK to confirm your selection and close the dialog.
Add fields to the report layout
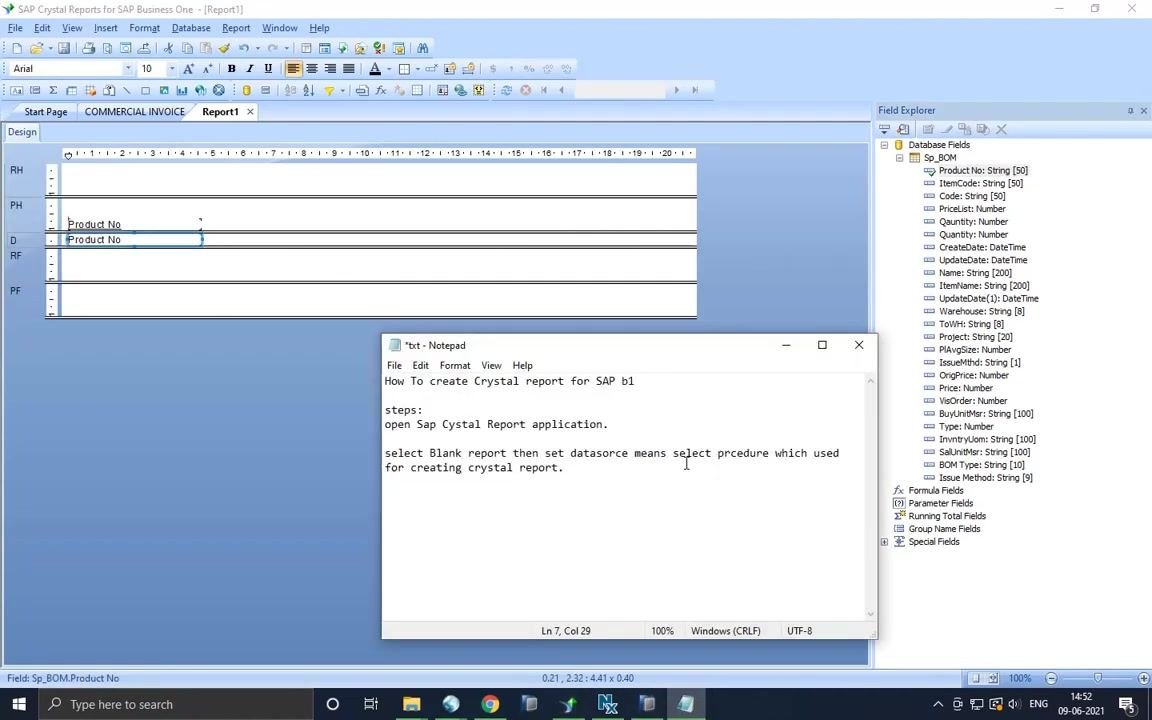
Once the data source is confirmed, the main Crystal Reports design window opens, and the Field Explorer pane on the right displays the fields available from your selected stored procedure (such as Sp_BOM). Drag and drop the fields you need—for example, Product No—from the Field Explorer into the report layout sections, such as the Details section.
Review field placement in the layout
Verify that your fields, such as Product No, have been placed correctly in both the Page Header and Details sections of the report layout. Confirm that the field names are properly aligned and visible in the layout grid, and that the Field Explorer still displays all available fields from the selected stored procedure.
Preview the report output
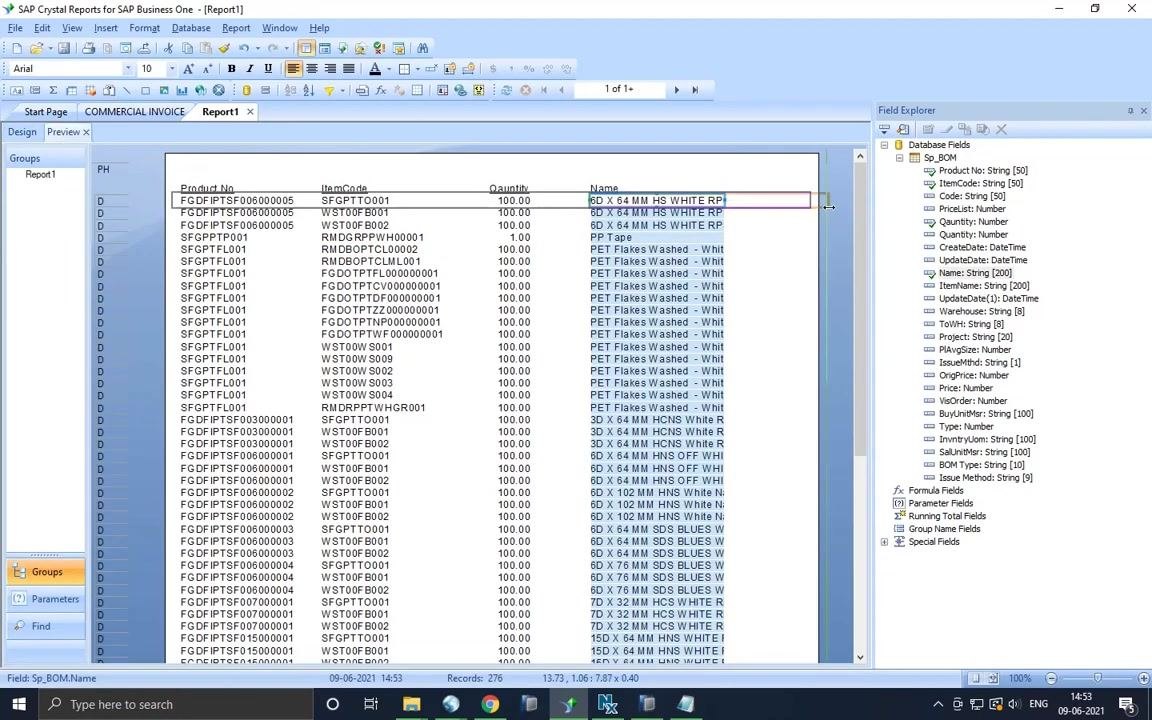
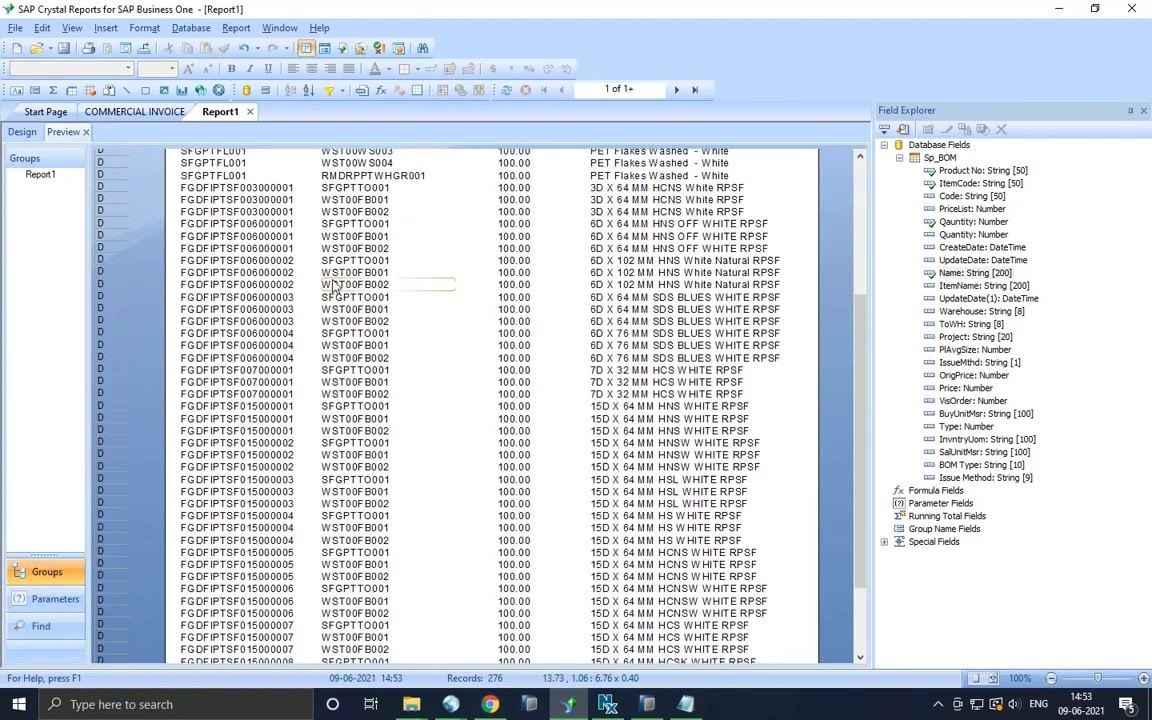
Switch to the Preview tab to view the generated report. The report displays a table with columns such as Product No, ItemCode, Quantity, and Name, populated with actual data from the database across multiple rows. The Field Explorer remains visible on the right, confirming the data source and available fields, while the bottom of the window indicates the total number of records returned (for example, 276 records).
Save the Crystal Report
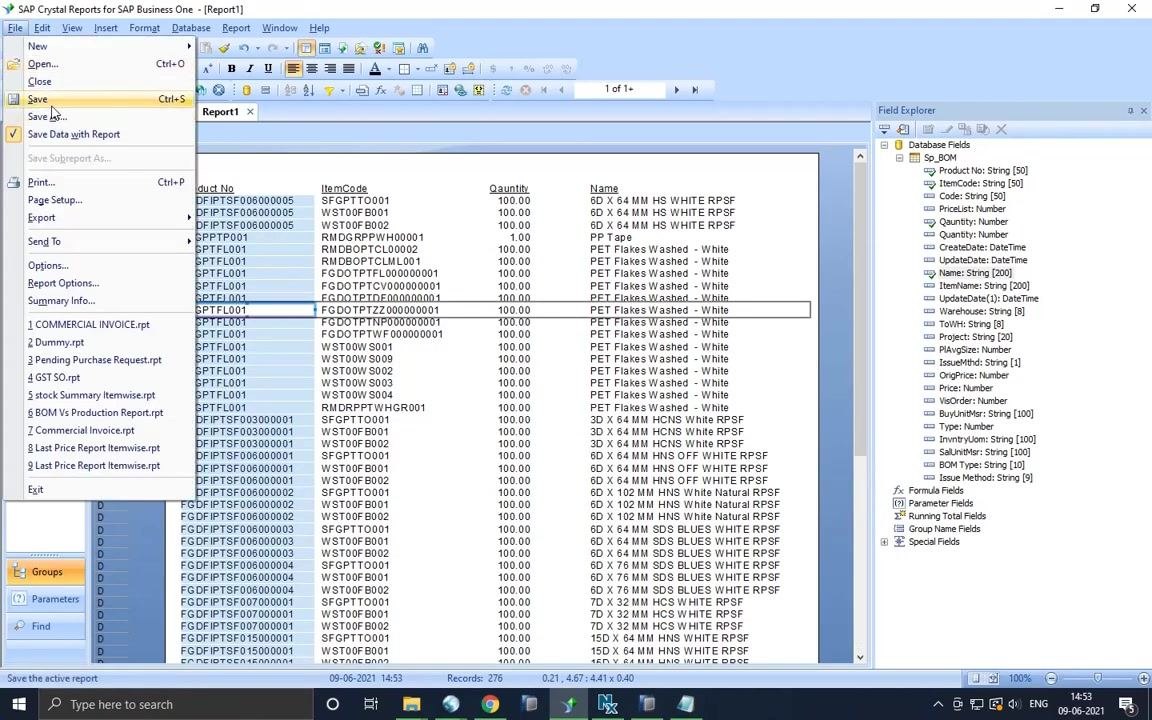
Click File in the top menu, then select Save (or use the Ctrl+S shortcut) to save your report. The File menu also offers additional options, including Save As, Save Data with Report, and a list of recently opened reports, letting you preserve your report design and data source selections for future use.
Summary
By following these steps, you have successfully set up a data source, placed fields in your report layout, previewed the populated report, and saved your Crystal Report for SAP Business One. Your report is now ready for further customization or distribution as needed.
Generation details: cost, quality tiers
Docsie billed 2,500 credits ($1.75) to analyze this 5-minute video at standard quality. The rewrite, template fill and Word/PDF exports were included. The same video at each quality tier:
| Quality | Frames sampled | Credits | Approx. cost |
|---|---|---|---|
| Draft | every 16-30 s | 1,250 | $0.88 |
| Standard (this guide) | every 8-15 s | 2,500 | $1.75 |
| Detailed | every 4-7 s | 5,000 | $3.50 |
| Ultra | every 1-3 s | 10,000 | $7.00 |
Credits priced at $0.70 per 1,000; plans include a monthly allowance. Enterprise customers on on-premise or bring-your-own-model deployments run this on their own inference and pay no per-video credits.
Generated by Docsie Video-to-Docs on 2026-10-12 from a 4-minute video. Screenshots are frames from the source video and belong to their creator, Learn online, whose original is embedded above. If you own this video and want the guide removed or credited differently, contact us and we will act within one business day.