
How to Read Gel Electrophoresis Results
This standard operating procedure explains how to read gel electrophoresis results after an agarose gel run, including how DNA bands travel through the gel, how gel concentration affects fragment separation, and how to safely handle and dispose of the gel once results are visualized. It is intended for laboratory and classroom settings that use agarose gel electrophoresis to compare DNA banding patterns for paternity or forensic-style analysis.
Video: Electrophoresis: How to Read Results by FisherScienceEd (2010). All credit for the demonstration goes to the creator; watch the original on YouTube. The written guide below was generated from this video by Docsie. Creator? Request a change or removal.
This standard operating procedure explains how to read gel electrophoresis results after an agarose gel run, including how DNA bands travel through the gel, how gel concentration affects fragment separation, and how to safely handle and dispose of the gel once results are visualized. It is intended for laboratory and classroom settings that use agarose gel electrophoresis to compare DNA banding patterns for paternity or forensic-style analysis.

Test Overview
- Test name: Agarose Gel Electrophoresis for DNA Fragment Separation and Band Pattern Analysis
- Methodology: Agarose gel electrophoresis, typically prepared at 0.8% or 1% agarose concentration
- Analytes measured: DNA fragments, differentiated by size based on migration distance through the gel
- Clinical/educational utility: Comparing DNA banding patterns between samples for applications such as paternity testing and forensic identification, or for classroom demonstration of DNA profiling concepts
- CPT code: Not specified in the source material; consult institutional billing guidance if this procedure is used in a clinical context
Specimen Requirements
| Parameter | Detail |
|---|---|
| Specimen type | DNA samples loaded into gel wells (e.g., reference, suspect, child, mother, or father samples in comparison testing) |
| Collection container | Not specified in source material |
| Minimum volume | Not specified in source material |
| Patient preparation | Not specified in source material |
| Transport conditions | Not specified in source material |
| Stability | Not specified in source material |
| Rejection criteria | Not specified in source material |

The source material does not define collection container, volume, patient preparation, transport, stability, or rejection criteria; these should be established according to institutional protocol before running the procedure.
Equipment & Reagents
- Agarose powder, approximately $1 per gram, used to prepare 0.8% or 1% gel concentrations
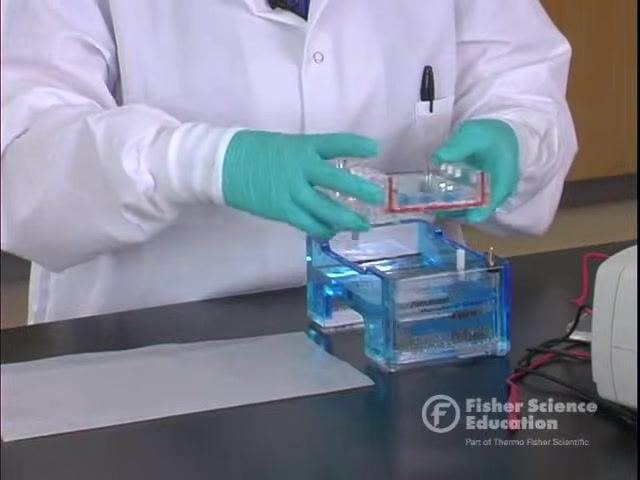
- Electrophoresis chamber and power supply
- Gel tray
- Running buffer for the electrophoresis chamber
- Viewing surface for gel transfer: wax paper, a weigh boat, or a white Styrofoam plate
- Personal protective equipment: lab coat, gloves, and goggles
Catalog numbers, calibrators, and control materials are not specified in the source material and should be added per manufacturer documentation if required.
Calibration & QC
The source material does not describe a formal calibration schedule, QC levels, or acceptable QC ranges for this procedure. The key process parameter identified is agarose concentration, which functions similarly to a calibration setting because it determines how far DNA fragments travel:
- 0.8% agarose: Lower cost, looser gel matrix, commonly used because it saves approximately $0.20 per gel compared to 1% agarose
- 1% agarose: Denser gel matrix, higher cost per gel
If QC materials or acceptable ranges are required for a given application, these should be defined by institutional protocol, as the source does not specify them.
Procedure Steps
-
Confirm the electrophoresis run is complete.
- Wait for the electrophoresis timer to finish before handling the gel.
-
Power down the electrophoresis chamber.
- Turn off the power supply to the electrophoresis chamber.
- Flip the switch to confirm no power is running to the system.
- Disconnect the electrical leads from the power supply for safety before proceeding.
-
Remove the gel from the electrophoresis chamber.
- Only after power is disconnected, carefully remove the lid from the chamber.
- Gently lift the gel tray straight up out of the buffer to avoid disturbing the gel.
- Allow excess buffer to drain off the tray to reduce mess and make results easier to view.
-
Transfer the gel for visualization.
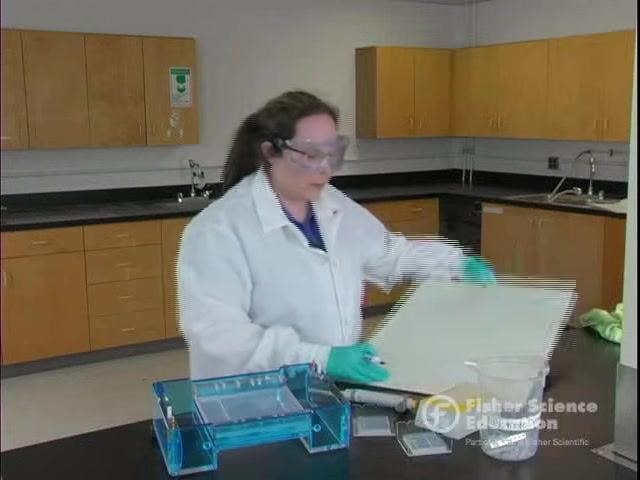
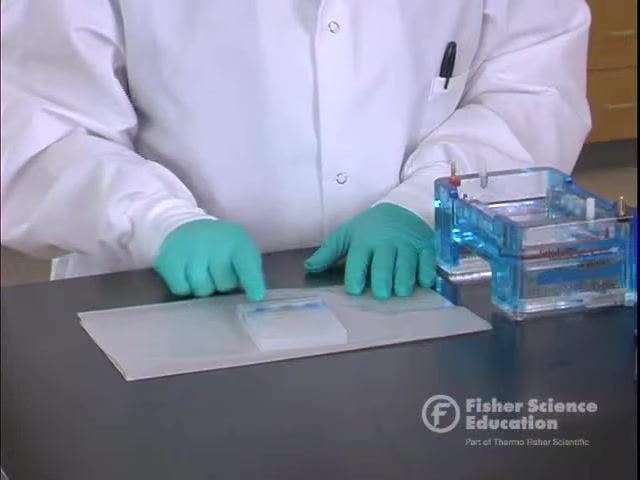
- Slide the gel gently out of the tray onto a suitable viewing surface.
- Use wax paper, a weigh boat, or a white Styrofoam plate—any clean, flat surface that allows clear visualization of the dye bands.
-
How to read gel electrophoresis results: visualize the dye bands.
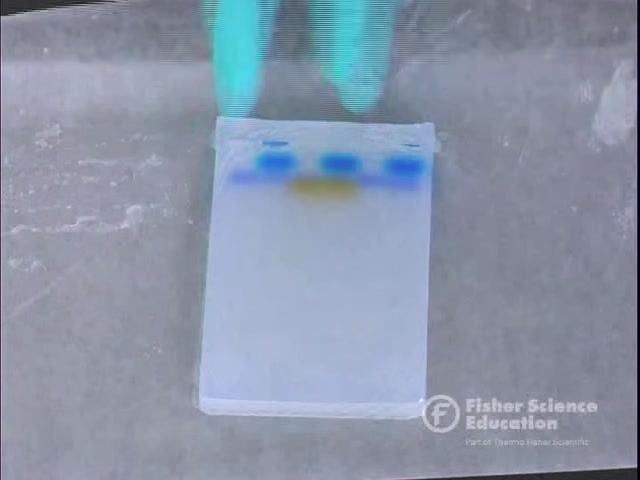
- Observe the separated dye bands on the gel surface.
- Note the number and position of bands in each lane before making comparisons.
-
Examine the gel to identify individual bands.
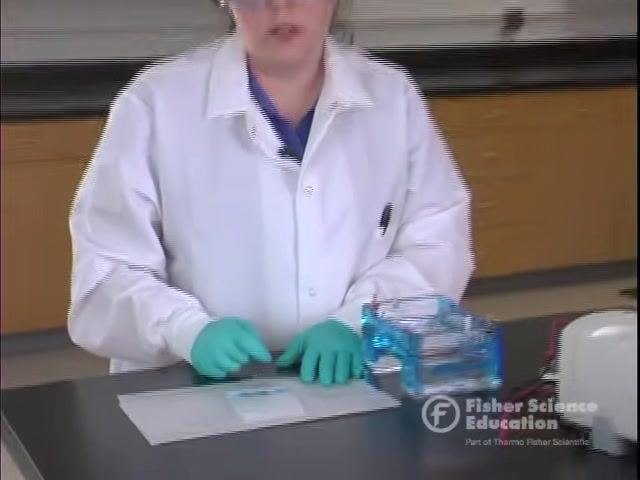
- Place the gel on a clean, flat surface covered with a protective sheet.
- Wear a lab coat and gloves throughout handling for safety and contamination prevention.
- Keep the electrophoresis chamber and other lab equipment nearby for reference.
-
Point out and compare individual bands.
- Use a gloved finger to point out bands corresponding to different lanes or samples.
- Observe the colored bands (blue and yellow), which represent different DNA or protein samples.
-
Compare banding patterns between lanes.
- Identify lanes with matching bands, such as lanes showing a single matching band, to determine similarities between samples.
- Use the pattern of matches to draw conclusions, such as identifying identical samples or matching a sample to a reference lane.
-
Confirm the gel material is safe to dispose of.
- Note that the gel is synthesized from seaweed (agarose), making it safe for disposal in regular trash.
- No special hazardous waste procedures are required for this gel material.
-
Dispose of the gel and protective sheet.
- While wearing gloves, pick up the gel and the protective sheet together.
- Dispose of both in the regular trash.
-
Maintain good laboratory practice.
- Wear gloves when handling gels and chemicals at all times, even when materials are non-hazardous, to model proper lab safety.

Reference Ranges
The source material does not provide age- or sex-stratified reference ranges, as this procedure produces qualitative DNA band patterns rather than a quantitative clinical result. Instead, the relevant reference behavior relates to how gel concentration affects fragment migration distance:
| Gel concentration | Mesh density | Large DNA fragment migration | Small DNA fragment migration |
|---|---|---|---|
| 0.8% agarose | Loose | Travels farther than in 1% gel | Travels farthest of all fragment sizes |
| 1% agarose | Dense | Slowed more than in 0.8% gel | Still travels farthest of all fragment sizes, but overall migration is more restricted |
No critical or panic values are defined in the source material, and no notification requirements are specified.
Result Interpretation
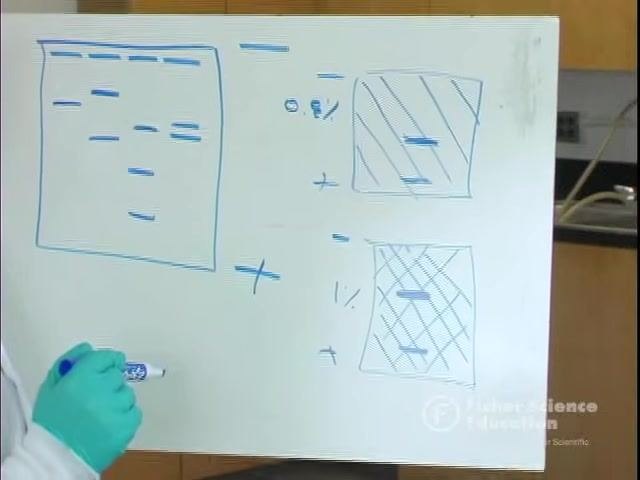
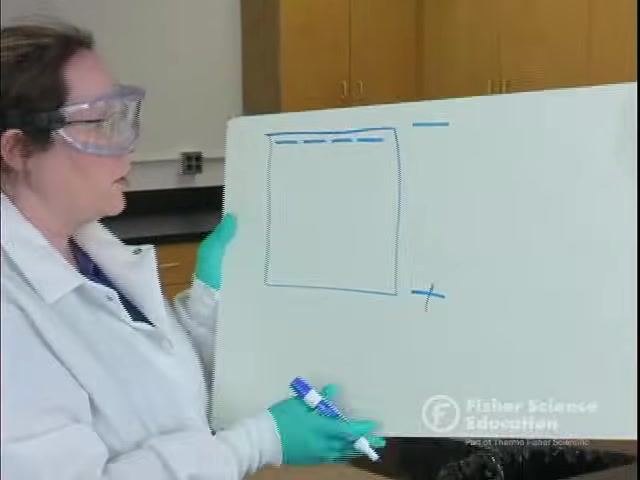
How DNA moves through the gel: On the gel diagram, the negative (–) end is where DNA samples are loaded into wells, because DNA is negatively charged. The negative current pushes DNA samples toward the positive (+) end during the run.
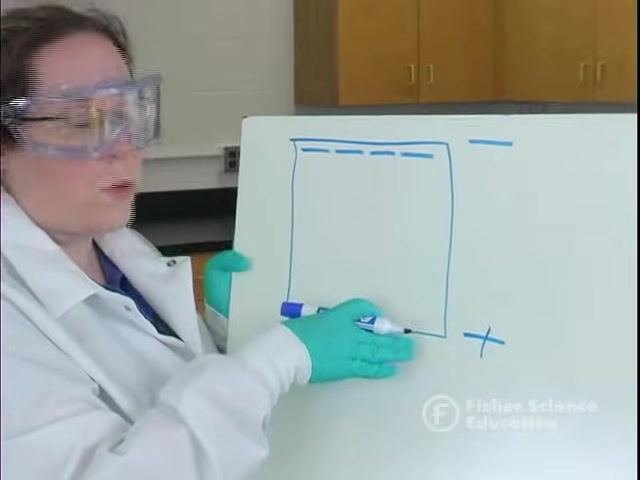
Each horizontal band represents DNA fragments of the same size. Bands at the same distance from the wells, even across different lanes, indicate fragments of the same size. Smaller fragments travel farther through the gel, while larger fragments remain closer to the wells.

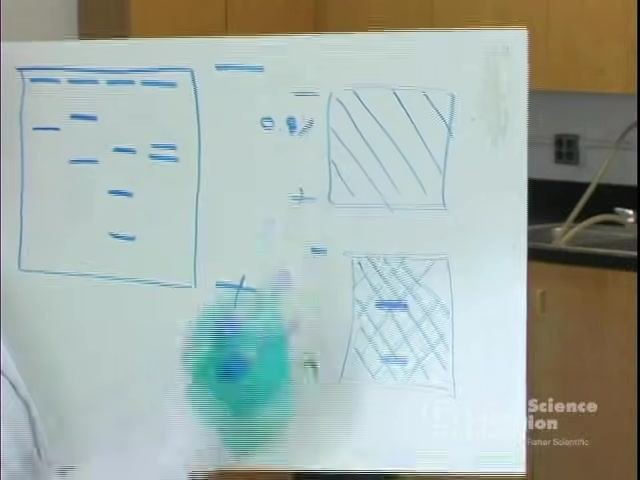
Mesh analogy: Agarose gel acts like a mesh, similar to a forest with trees spaced at different distances. Higher agarose concentration creates a denser mesh; lower concentration creates a looser mesh. A large DNA fragment (like a horse) moves more easily through a loose mesh than a dense one, while a small DNA fragment (like a dog) moves quickly through both, but especially through the looser mesh.
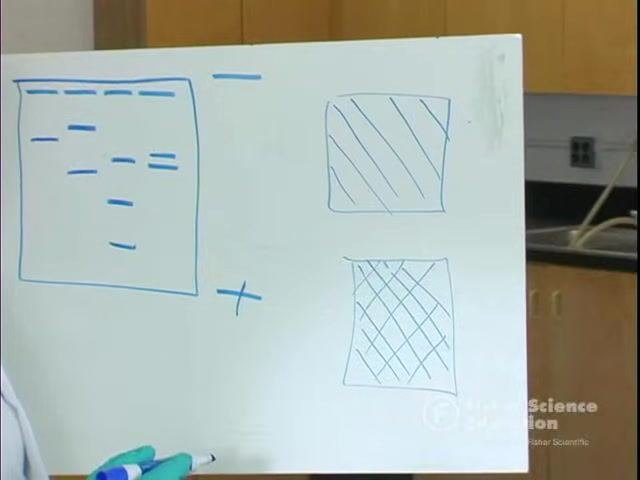
In a 0.8% gel, large fragments travel farther than they would in a 1% gel. In a 1% gel, large fragments are slowed down more, while small fragments still move quickly.
Comparing samples for paternity or forensic analysis: Compare the banding pattern of each lane against reference lanes. In a paternity comparison, a maternal band should match the child, and a paternal band should match the child; the lane sharing bands with both the child and the mother identifies the most likely father.
In a forensic-style comparison, one example showed the following band counts across lanes:
| Lane | Band count |
|---|---|
| Lane 1 | Reference |
| Lane 2 | Two bands |
| Lane 3 | Single band |
| Lane 4 | Three bands |
| Lane 5 | Two bands |
| Lane 6 | Two bands |
| Lane 7 | One band (crime scene sample) |
A second demonstration used different suspect lanes, each representing a different individual, with the final lane representing the crime scene sample:
| Lane | Band count |
|---|---|
| Lane 1 | Two bands |
| Lane 2 | Single band |
| Lane 3 | Three bands |
| Lane 4 | Two bands |
| Lane 5 | Two bands |
| Lane 6 | One band (crime scene sample) |
Matching bands between lanes indicate genetic or protein similarities, which can be used for identification purposes. In one demonstration, a matching pattern between two lanes was traced to identical twins, illustrating that identical individuals can produce identical banding patterns.
Limitations: The source material does not identify specific interfering substances or analytical limitations of the method beyond the qualitative nature of band comparison; results depend on correctly identifying matching band positions between lanes rather than a numeric measurement.
Troubleshooting
The source material does not provide a dedicated troubleshooting section with specific analytical issues and corrective actions. Related operational guidance includes:
- Selecting 0.8% agarose instead of 1% reduces reagent cost by approximately $0.20 per gel without eliminating the need to interpret migration differences between fragment sizes.
- Always disconnect the power supply and remove the chamber lid only after power is off, to prevent unsafe handling of the gel.
- Always wear gloves when handling the gel and protective sheet, even though agarose gel is non-hazardous, to maintain consistent lab safety practice.
What's Next
After reading and recording the band patterns, dispose of the gel and protective sheet in regular trash, since agarose is derived from seaweed and requires no special hazardous waste handling. Institutions applying this procedure clinically should supplement the missing specimen requirements, calibration/QC criteria, and CPT coding per their own protocols, as these are not defined in the source material.
Generation details: cost, quality tiers, downloads
Docsie billed 3,500 credits ($2.45) to analyze this 7-minute video at standard quality. The rewrite, template fill and Word/PDF exports were included. The same video at each quality tier:
| Quality | Frames sampled | Credits | Approx. cost |
|---|---|---|---|
| Draft | every 16-30 s | 1,750 | $1.22 |
| Standard (this guide) | every 8-15 s | 3,500 | $2.45 |
| Detailed | every 4-7 s | 7,000 | $4.90 |
| Ultra | every 1-3 s | 14,000 | $9.80 |
Credits priced at $0.70 per 1,000; plans include a monthly allowance. Enterprise customers on on-premise or bring-your-own-model deployments run this on their own inference and pay no per-video credits.
Generated by Docsie Video-to-Docs on 2026-09-20 from a 6-minute video. It was generated straight into Docsie's Lab Test Procedure template, so every section of that template is filled from the video. Screenshots are frames from the source video and belong to their creator, FisherScienceEd, whose original is embedded above. If you own this video and want the guide removed or credited differently, contact us and we will act within one business day.