
How to Measure Static Pressure in an Hvac System
This standard operating procedure describes how to measure static pressure in an HVAC system in order to determine the total external static pressure across the indoor unit. Measuring static pressure allows you to calculate the CFM (cubic feet per minute) of air moving through the system and to assess whether the system's airflow and efficiency meet design expectations.
Video: How to Measure the Total External Static Pressure on an HVAC System. by R. F. Fager Co. (2020). All credit for the demonstration goes to the creator; watch the original on YouTube. The written guide below was generated from this video by Docsie. Creator? Request a change or removal.
This standard operating procedure describes how to measure static pressure in an HVAC system in order to determine the total external static pressure across the indoor unit. Measuring static pressure allows you to calculate the CFM (cubic feet per minute) of air moving through the system and to assess whether the system's airflow and efficiency meet design expectations.
Purpose
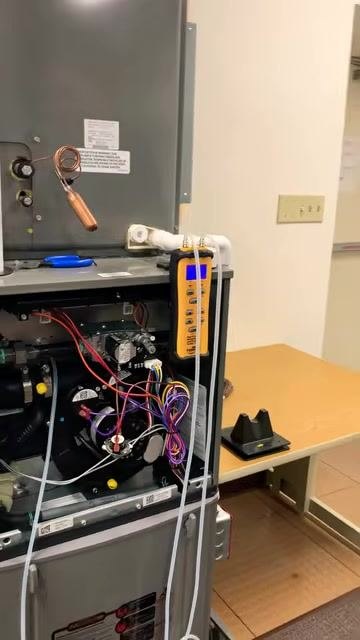
The purpose of this procedure is to guide you through measuring total external static pressure on an HVAC system using a digital dual port manometer. This measurement accounts for all resistance the blower works against, including ductwork, registers, filters, and grills, and it forms the basis for diagnosing airflow problems.
Scope
This procedure applies to gas furnace and air handler systems where total external static pressure needs to be measured for diagnostic or maintenance purposes. It covers measuring supply static pressure, return static pressure, calculating total external static pressure, and interpreting the results against a manufacturer's blower performance chart.
Required equipment
- Digital dual port manometer (a Fieldpiece model is used in this procedure)
- Alternative tools such as a magnehelic gauge or an incline manometer may also be used, though this procedure demonstrates the process with a dual port electronic manometer
- Manufacturer's blower performance chart (blower curve) for the specific furnace or air handler model
Understand what you are measuring
Measuring total external static pressure is essential for determining the CFM, or volume of air, moving through the indoor unit. This measurement helps you assess the system's airflow and efficiency.
Ensure your measurement accounts for all resistance the blower works against, including:
- All ductwork (supply and return)
- Registers, takeoffs, and boots
- Filters
- Return duct and grills
All of these components contribute to static pressure and affect airflow, so each one must be considered for an accurate reading.
Locate the measurement point before the blower
Find or drill a hole in the furnace box after the filter but before the blower so you can insert the manometer probe. Confirm that the filter is installed diagonally, as shown in the setup.
Prepare the manometer
Power on the digital dual port manometer and attach the tubing to the appropriate port on the unit.
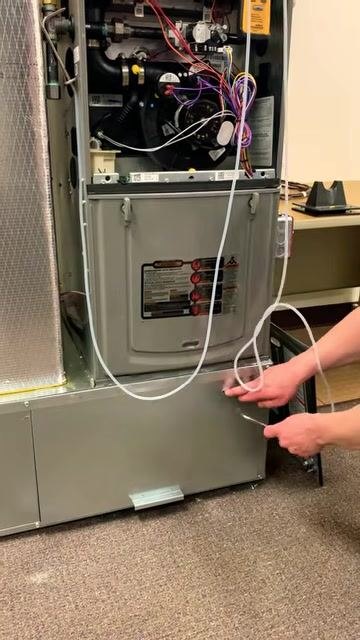
Insert the probe for the first measurement
Insert the manometer probe into the pre-drilled hole in the furnace box. Position the probe so that it measures everything before the blower, including the filter.
Double-check that all sources of resistance — ducts, filters, grills, and other components — are included in your measurement setup, since any resistance present will impact the airflow reading.
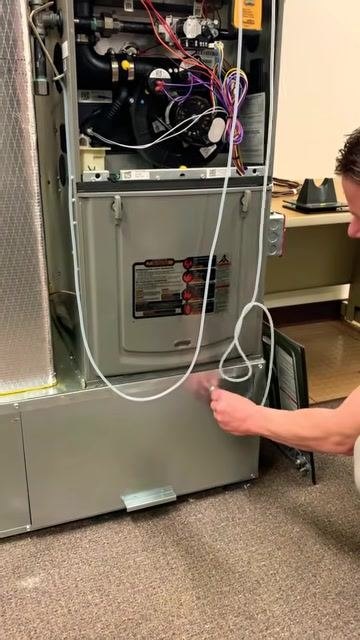
Insert the supply side probe
Insert the supply side probe to measure static pressure after the blower.
Safety note: If you are working on a gas furnace with an A-coil, do not drill into the coil. Instead, remove the high limit switch (after removing its screws) and insert the supply probe into the opening left by the switch. This method lets you measure supply static pressure without damaging the coil.
Ensure the probe is securely positioned in the supply plenum.
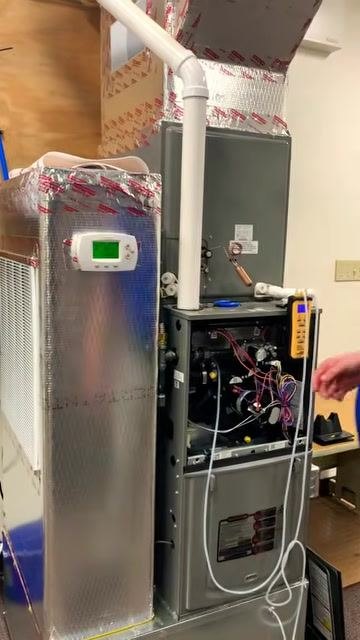
Turn on the blower fan
Set the system's fan to the On position using the thermostat or control panel. The manometer should initially display zero inches of water column before the blower starts. As the blower ramps up, watch the reading increase — this indicates the supply static pressure.
Read and record the supply static pressure
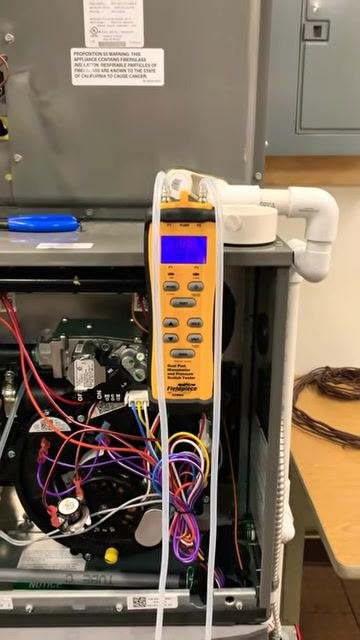
Confirm that the manometer is set to port one (supply side). Observe the reading once the blower reaches full speed and record the supply static pressure value, which should be approximately 0.14 to 0.15 inches of water column.
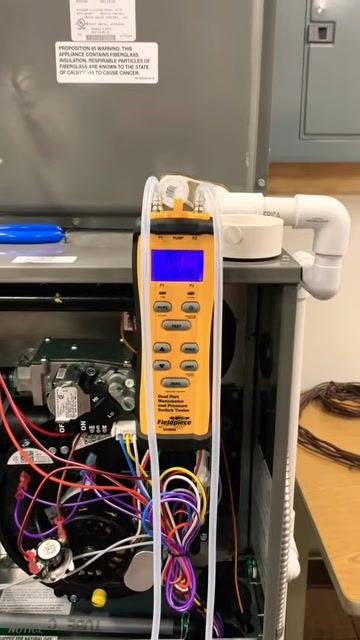
Switch to measure return static pressure
Change the manometer connection to port two to measure the return (negative) static pressure. Observe the display as it updates and record the return static pressure value, which should be approximately 0.03 to 0.04 inches of water column.
Calculate total external static pressure
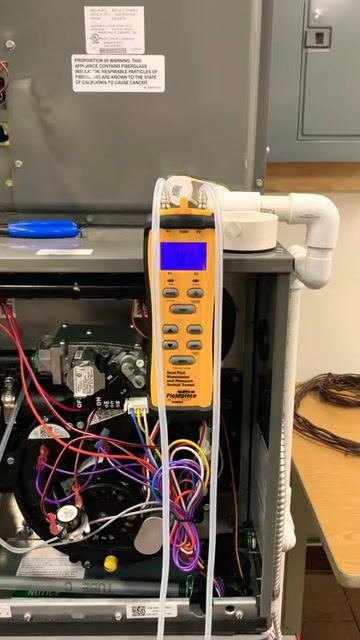
Add the absolute values of the supply and return static pressures to determine the total external static pressure.
For example, if the supply static pressure is 0.15 inches and the return static pressure is 0.03 inches (negative):
0.15 + 0.03 = 0.18 inches of water column (w.c.)
This value represents the total external static pressure for the system.
Reference the blower performance chart
Locate the blower curve (performance chart) for the specific furnace or air handler model. This chart, provided by the manufacturer, lists airflow (CFM) at various static pressures, typically ranging from 0 to 0.8 inches w.c.
Find your measured total external static pressure (for example, 0.18 inches) on the chart and use it to determine the corresponding CFM of airflow. This step allows you to verify whether the system is moving the correct amount of air as designed.
Demonstrate the effect of supply register restriction
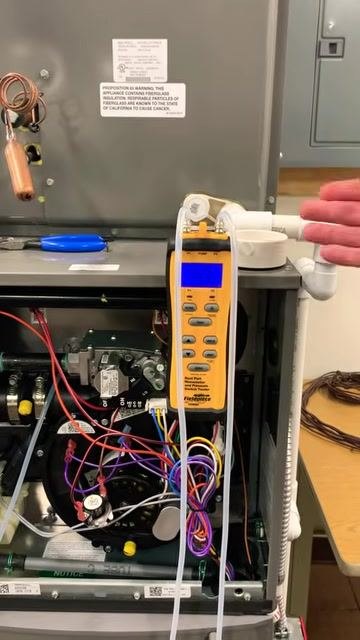
Begin closing supply registers to simulate added restriction in the ductwork. Observe the manometer display as the static pressure increases. Closing two supply registers can nearly double the static pressure reading, indicating increased resistance to airflow.
Relieve the restriction and observe the pressure drop
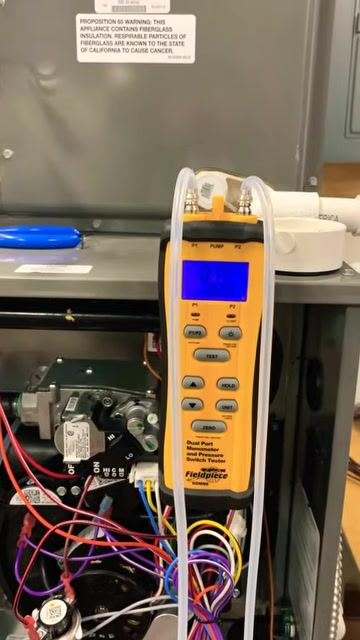
Open the previously closed supply registers and watch the manometer as the static pressure reading decreases. This demonstrates the direct relationship between register restriction and static pressure.
Switch to return static pressure and test a return restriction
Change the manometer connection to port two to measure return static pressure. Block off the return grill to simulate a restriction on the return side and observe the display as the static pressure increases in response.
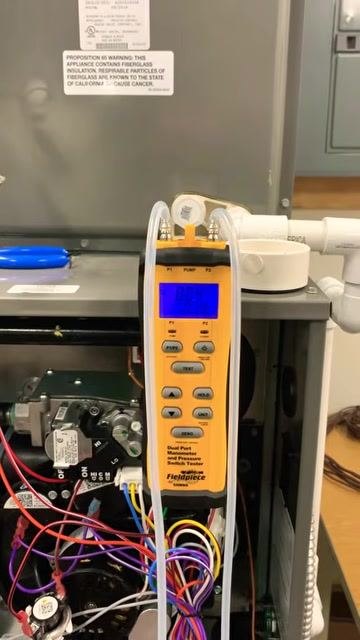
Interpret high static pressure readings
Observe the manometer display when the static pressure is well over 1 inch of water column (w.c.). A reading above 1 inch w.c. indicates extremely high resistance in the duct system. This level of resistance can severely restrict airflow and is not typical for a properly functioning system.
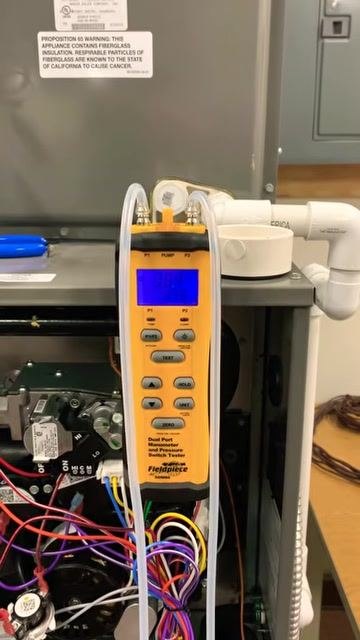
Identify causes of high static pressure
High static pressure readings can be caused by a dirty air filter or a blocked evaporator coil. These obstructions increase resistance in the duct system, leading to reduced airflow.
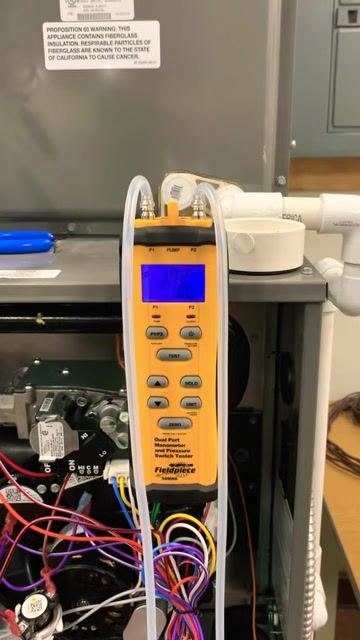
Understand the impact of restrictions on airflow
Any restriction, such as a dirty filter or blocked coil, contributes to increased resistance in the duct system. Increased resistance results in lower airflow, which can negatively affect system performance and efficiency.
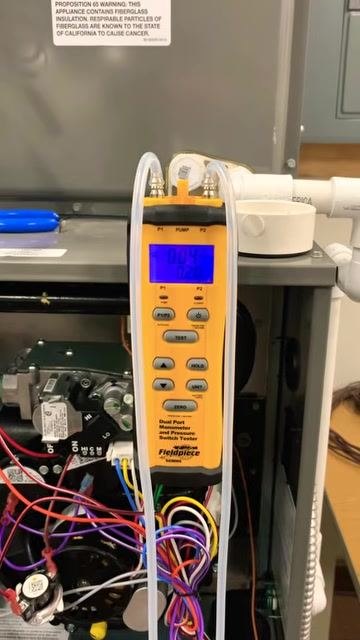
Verification and summary
Before concluding the procedure, confirm that you have measured total external static pressure by following the correct sequence: connecting the manometer, taking readings at both supply and return, and interpreting the results. Ensure all tools are removed and the furnace is returned to its normal operating state.
By completing this procedure, you will be able to:
- Accurately calculate total external static pressure using supply and return readings.
- Use the manufacturer's blower curve to determine actual system airflow (CFM).
- Understand how supply and return restrictions affect static pressure and system performance.
- Identify common causes of high static pressure, such as dirty filters or blocked coils.
- Recognize how restrictions in the duct system reduce airflow and impact overall HVAC performance.
Generation details: cost, quality tiers
Docsie billed 3,000 credits ($2.10) to analyze this 6-minute video at standard quality. The rewrite, template fill and Word/PDF exports were included. The same video at each quality tier:
| Quality | Frames sampled | Credits | Approx. cost |
|---|---|---|---|
| Draft | every 16-30 s | 1,500 | $1.05 |
| Standard (this guide) | every 8-15 s | 3,000 | $2.10 |
| Detailed | every 4-7 s | 6,000 | $4.20 |
| Ultra | every 1-3 s | 12,000 | $8.40 |
Credits priced at $0.70 per 1,000; plans include a monthly allowance. Enterprise customers on on-premise or bring-your-own-model deployments run this on their own inference and pay no per-video credits.
Generated by Docsie Video-to-Docs on 2026-09-14 from a 5-minute video. Screenshots are frames from the source video and belong to their creator, R. F. Fager Co., whose original is embedded above. If you own this video and want the guide removed or credited differently, contact us and we will act within one business day.