
How to Create a Processing Method in Empower
This guide walks you through how to create a processing method in Empower 3, from logging into the software to configuring integration, calibration, and suitability settings, and finally running background processing and previewing a report. Follow the steps below in order to build a complete processing method and apply it to a sample set.
Video: Empower 3 - How to Create Processing Method & Process the Data by Ahmed Saad - Analytical Engineer. All credit for the demonstration goes to the creator; watch the original on YouTube. The written guide below was generated from this video by Docsie. Creator? Request a change or removal.
This guide walks you through how to create a processing method in Empower 3, from logging into the software to configuring integration, calibration, and suitability settings, and finally running background processing and previewing a report. Follow the steps below in order to build a complete processing method and apply it to a sample set.
Prerequisites
- Access to the Empower 3 software with valid login credentials.
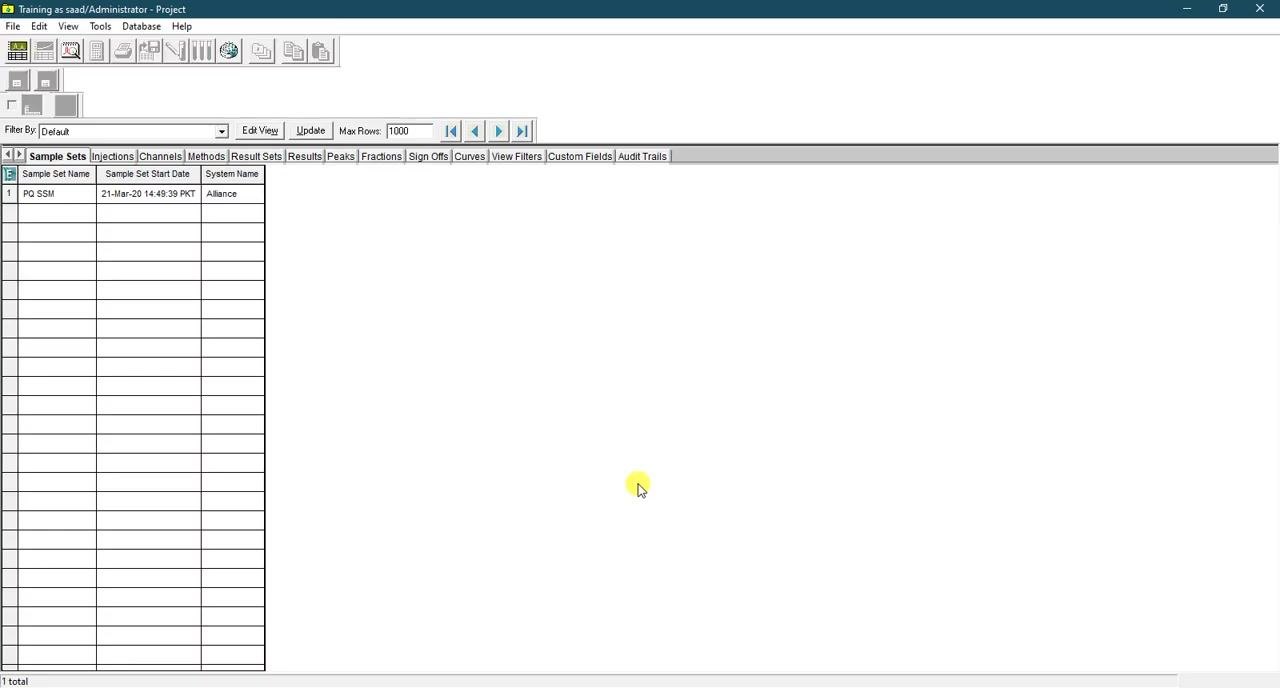
- An existing sample set with acquired chromatogram data (this guide uses the sample set "PQ SSM").
- Familiarity with basic chromatography terms such as peak width, retention time, and integration threshold.
Starting the software
Locate and launch Empower 3
Find the Empower 3 icon on the desktop, displayed against a background featuring Waters branding and laboratory equipment illustrations (Acquity Arc, Acquity H-Class, Alliance). Double-click the icon to launch the application.
Log in to Empower 3
When the Login dialog appears, enter your User Name and Password. The dialog notes that clicking OK logs you in using the default user type and interface, while Advanced lets you select a different user type or interface. Click OK to proceed.
Creating a new processing method
Open the chromatogram review window
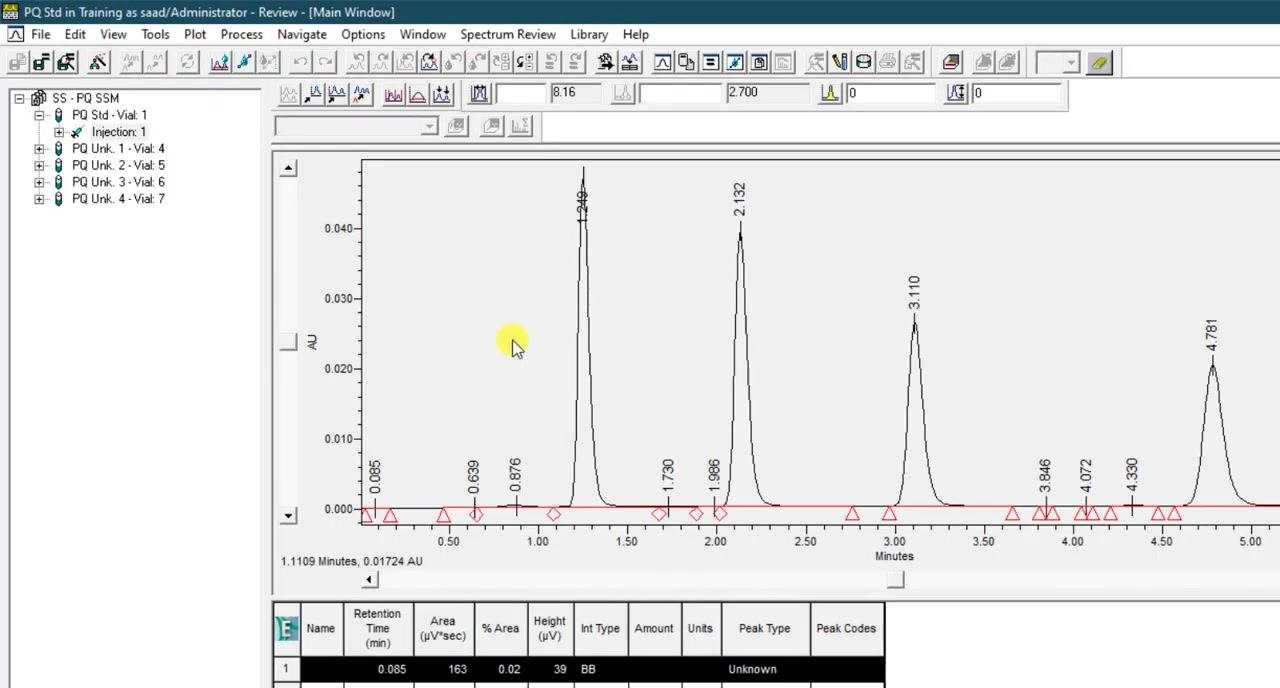
In the main window, titled "PQ Std in Training as [user]/Administrator - Review - [Main Window]", the left pane shows a tree structure for the sample set "PQ SSM," including its vials and injections. The main pane displays a chromatogram graph with peaks labeled by retention time (for example, 0.639, 0.876, 1.730, 2.132, 3.110, 4.072, 4.781), with the y-axis labeled "AU" and the x-axis labeled "Minutes." Below the graph, a table lists peak details such as Retention Time, Area, % Area, Height, Int Type, Amount, Units, Peak Type, and Peak Codes.
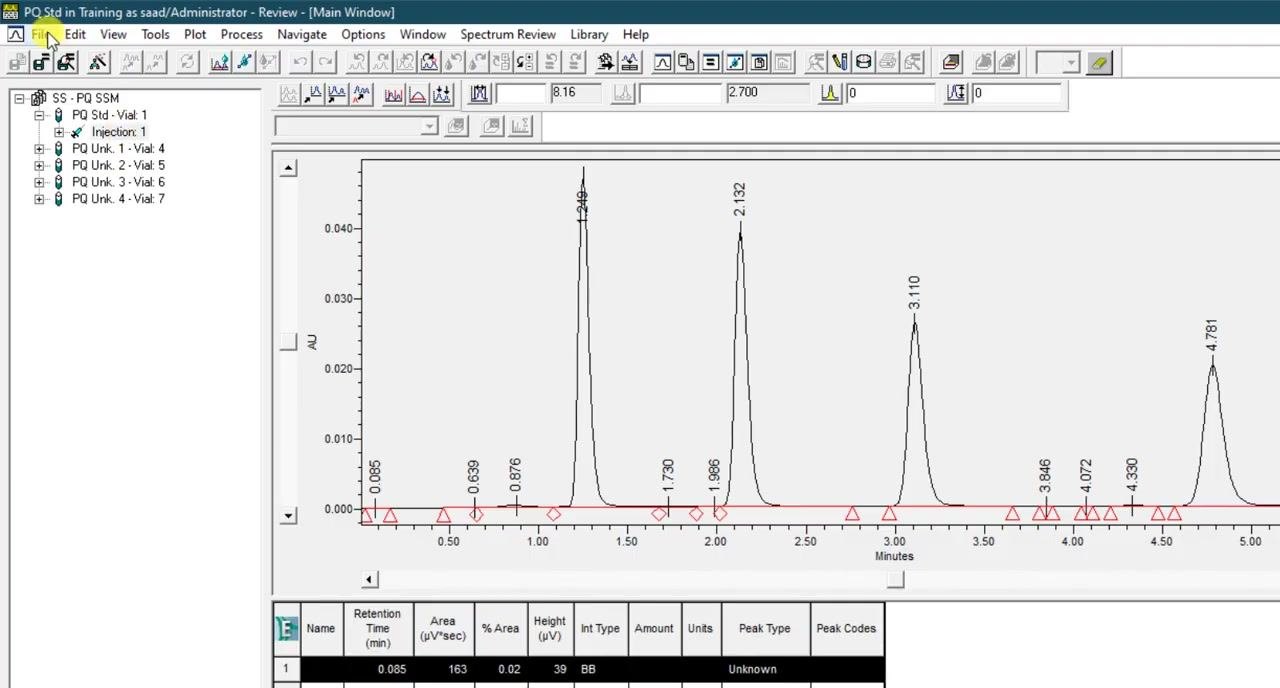
Open the New Processing Method dialog
In the New Processing Method dialog, select LC from the Processing Type dropdown and ApexTrack from the Integration Algorithm dropdown. Check Use Processing Method Wizard, and leave Include a Cross Channel Internal Standard unchecked. Click OK to proceed.
Set integration parameters
In the Integration - Peak Width and Threshold dialog, review the chromatogram preview and set the following values:
- Peak Width: 8.16
- Threshold: 3.100
The dialog notes that if this method will be used to process similar chromatograms, you can click Next without changes. Leave Clear Peak Width and Threshold unchecked, then click Next to continue.
Set peak rejection criteria
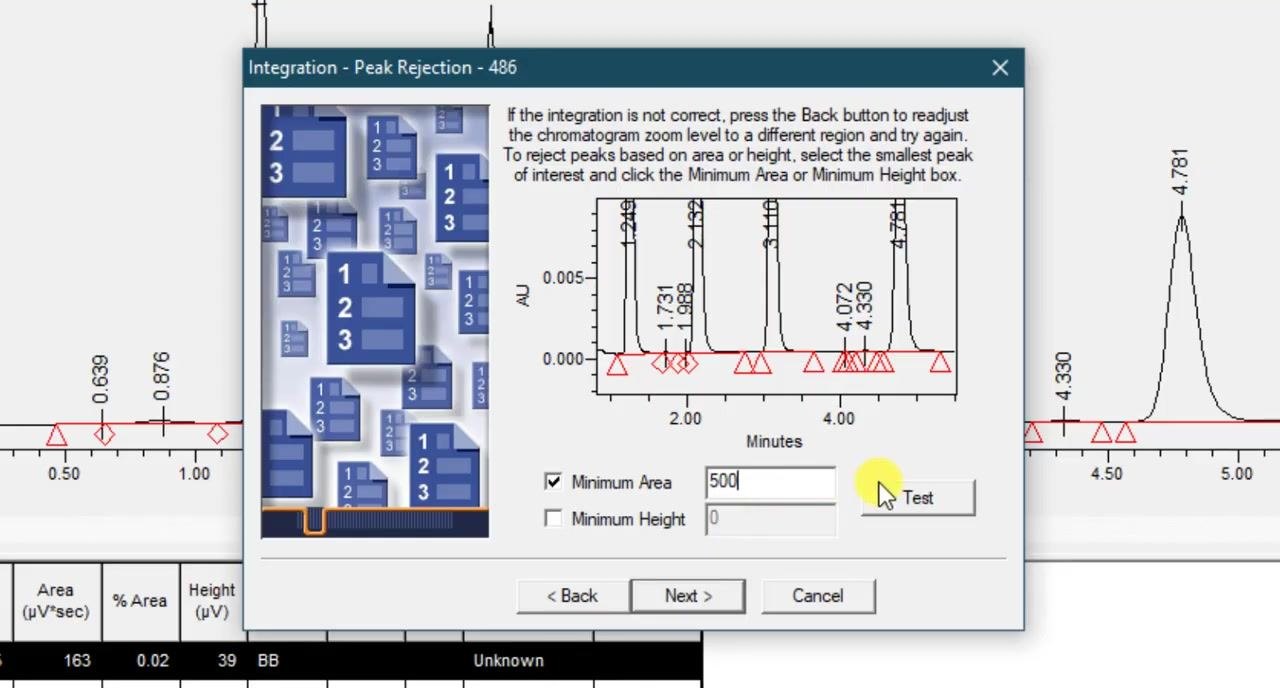
In the Integration - Peak Rejection dialog, the chromatogram preview updates as you adjust the settings. You can reject peaks based on area or height using the following options:
- Minimum Area (checkbox)
- Minimum Height (checkbox)
Check Minimum Area and enter a value of 500. Click Test to apply the rejection criteria and preview the result.
Assign names to chromatogram peaks
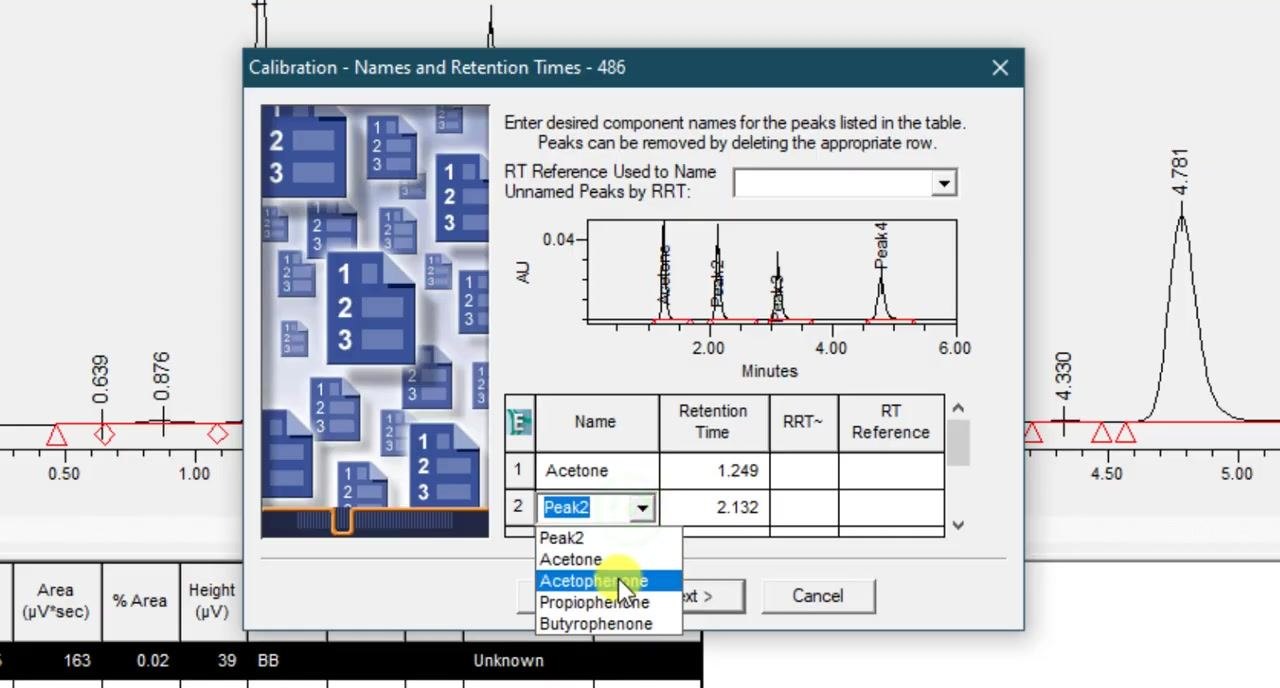
In the Calibration - Names and Retention Times dialog, the chromatogram preview displays the peaks to be named. The table lists each peak's retention time alongside a Name dropdown. For example, the peak at retention time 1.249 is named "Acetone." For the peak at retention time 2.132, open the dropdown and select Acetophenone from the available options (Peak2, Acetone, Acetophenone, Propiophenone, Butyrophenone).
Continue naming additional peaks
For the peak at retention time 3.110 (listed as "Peak3"), open the Name dropdown and select Acetophenone from the available options (Peak3, Acetone, Acetophenone, Propiophenone, Butyrophenone). Repeat this process for each remaining peak to ensure all peaks are assigned the correct chemical names.
Enter default amounts, units, and purity
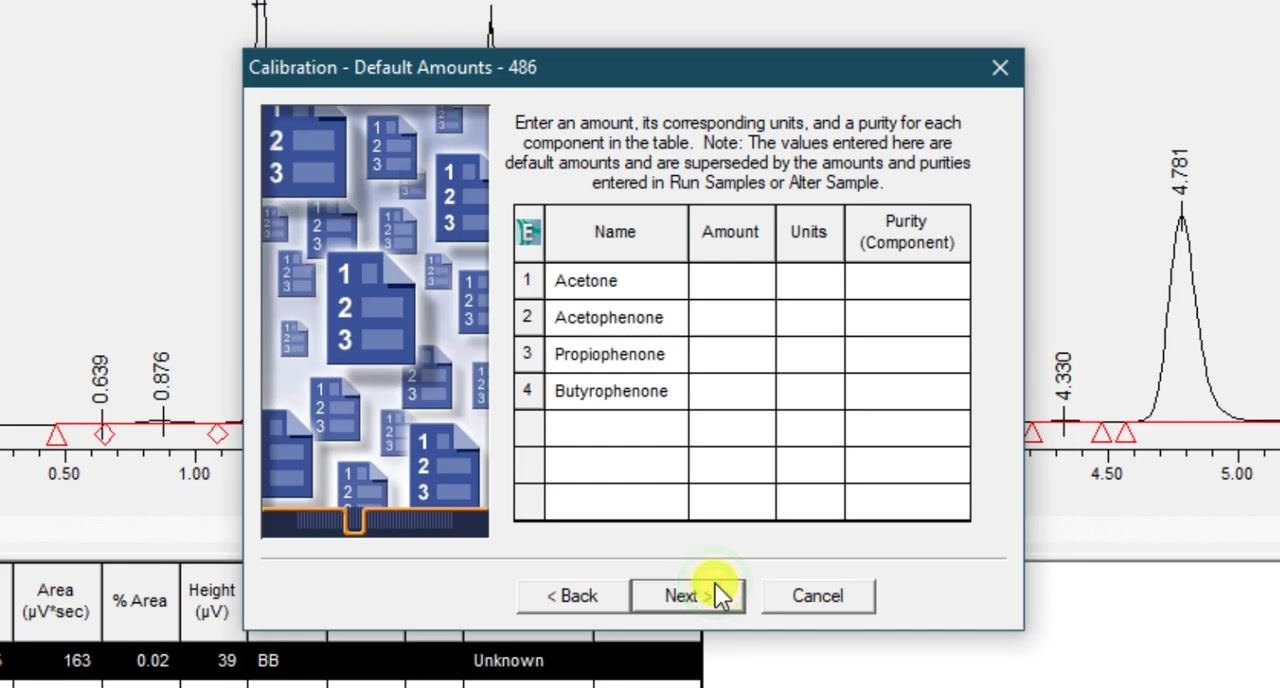
In the Calibration - Default Amounts dialog, the table lists each named component: Acetone, Acetophenone, Propiophenone, and Butyrophenone. Enter an amount, the corresponding units, and a purity value for each component in the Name, Amount, Units, and Purity (Component) columns. Click Next to proceed.
Configure suitability calculation parameters
In the Suitability dialog, check Calculate Suitability Results and Calculate Suitability Results for Unknown Peaks. In the System and Separation Efficiency section, configure the following:
- Void Volume Time (min): 0.82
- Pharmacopoeia: select All (from US, European, Japanese, or All)
- Tangent Percent for USP Resolution: 50
- Tangent Percent for USP Plate Count: 61
Leave the additional options for calculating USP, EP, and JP s/n unchecked, then click Next to continue.
Name the new processing method
In the Processing Method Name dialog, enter a name for the method in the Method Name field — for example, "Training PM." The Default Comments, Comments, Method Comments, and Password fields remain empty at this point.
Complete the method details and save
Still in the Processing Method Name dialog, fill in the Comments and Method Comments fields with "Training PM," and enter your password in the Password field. Click Finish to save the processing method.
Running background processing and reporting
Configure background processing and reporting options
In the Training - Background Processing and Reporting dialog, configure the following sections:
- Processing: check Process, and choose from options for the acquisition method set, a specified method set, a specified processing method, and clear calibration.
- Reporting: check Print, set the output to Adobe PDF, and choose from options for the acquisition method set, a specified method set, and a specified report method.
- Exporting: leave Export unchecked if not required, with options available for the acquisition method set, a specified method set, and a specified export method.
The Default Comments, Comments, and Password fields remain empty at this stage.
Enter comments and password, then run processing
With the Process section enabled, select the specified processing method "Training PM" and set Clear Calibration to Calibrate and Quantitat. Confirm the Reporting section is enabled with Print checked and output set to Adobe PDF. Leave the Export section disabled. Enter a note such as "processing" in the Comments field, and enter your password in the Password field.
Review processed sample results
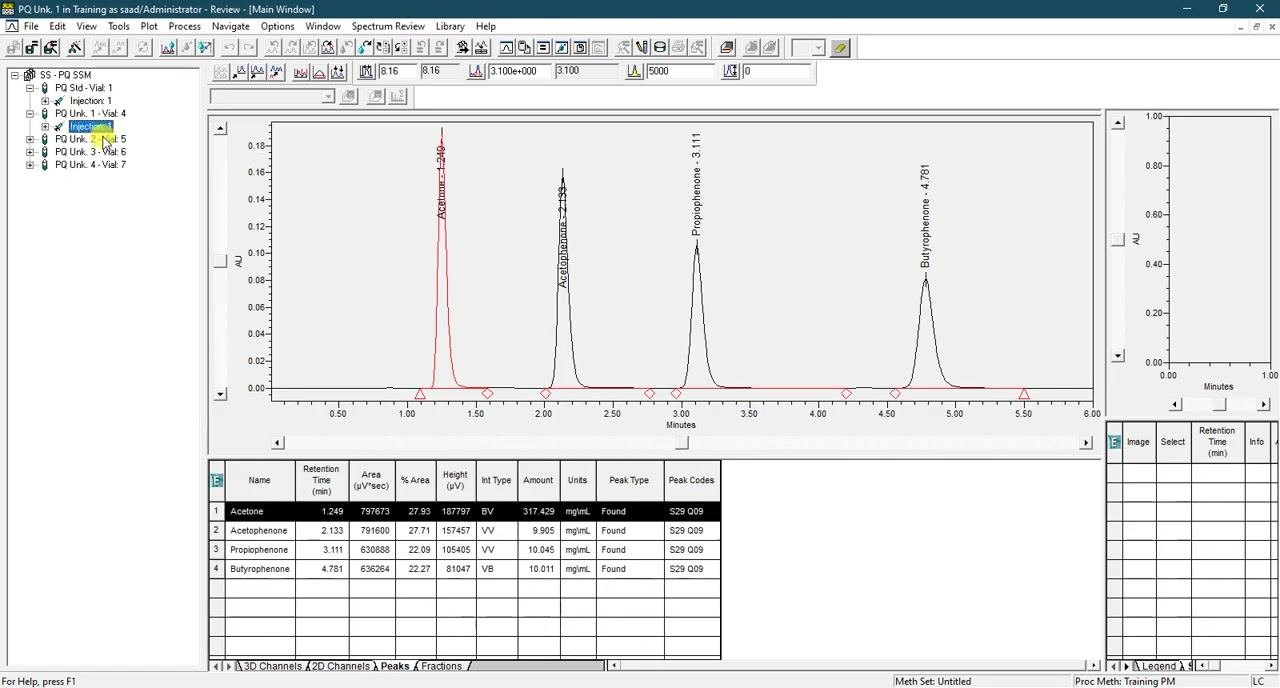
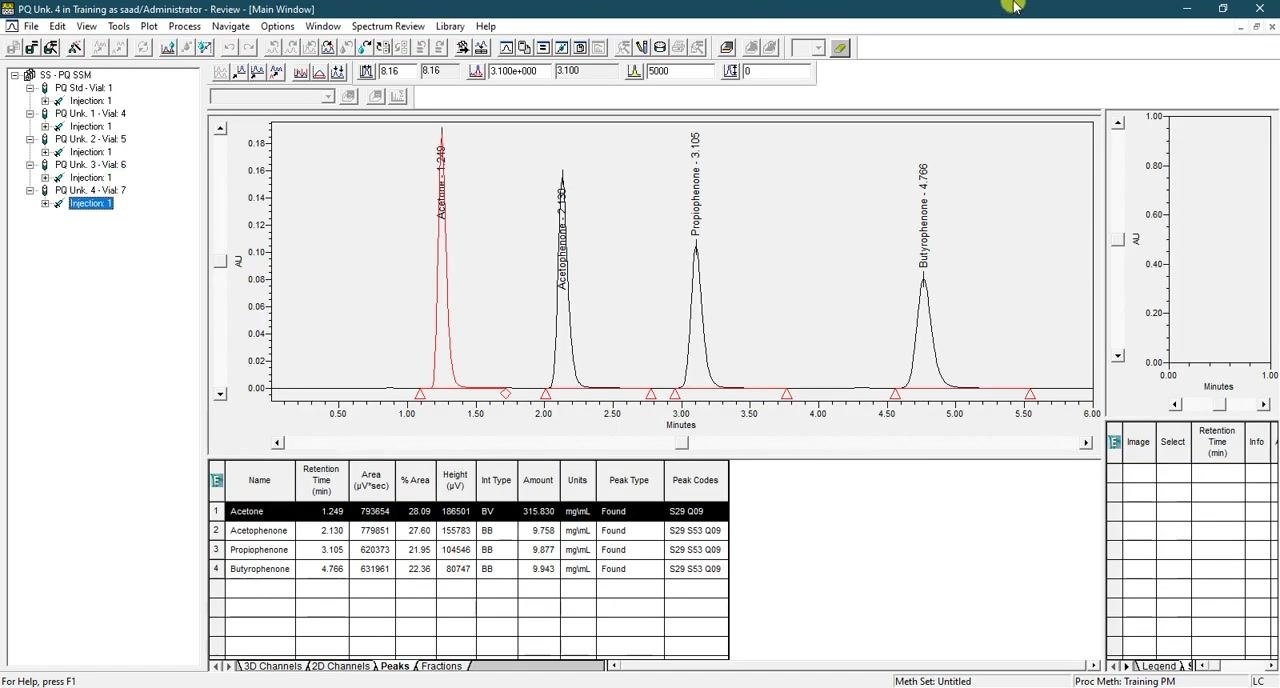
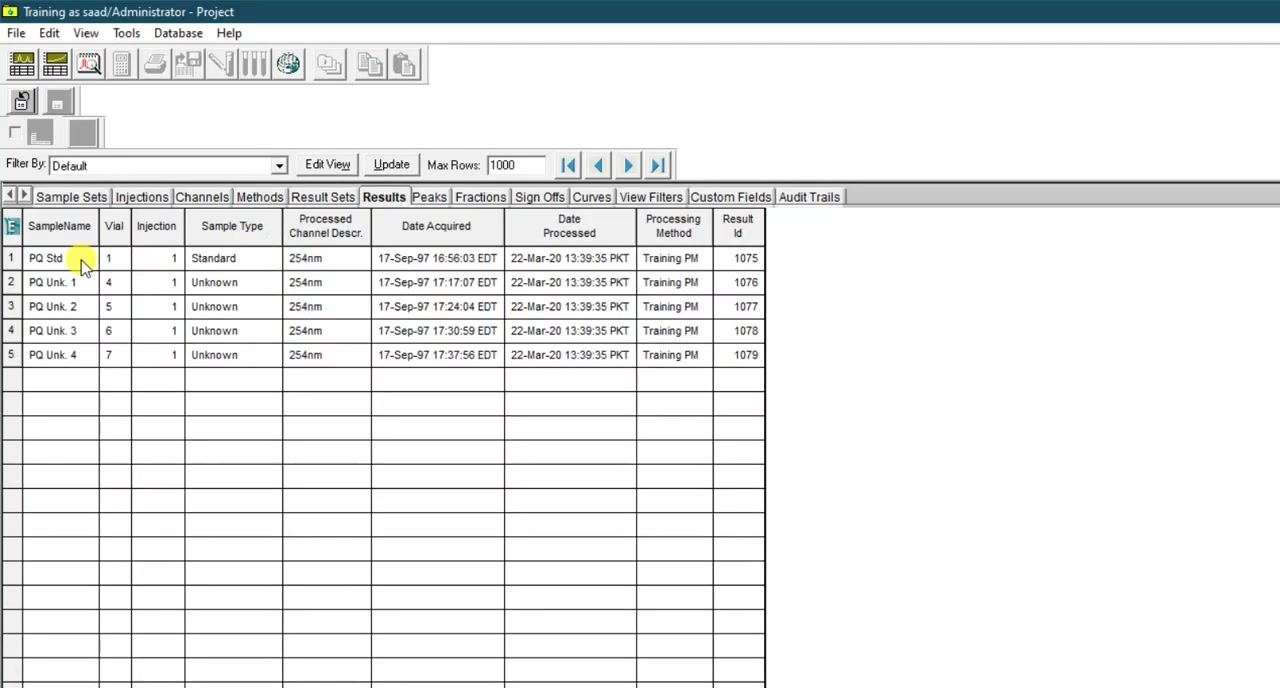
Switch to the Results tab in the main window to review the processed samples. The table lists each sample's name (for example, PQ Std, PQ Unk. 1 through PQ Unk. 4), vial number, injection number, sample type (Standard or Unknown), processed channel description (254nm), date acquired, date processed, processing method ("Training PM"), and result ID. This table provides a summary of all processed results for the selected result set.
Previewing the report
Preview the Default Individual Report and select a printer
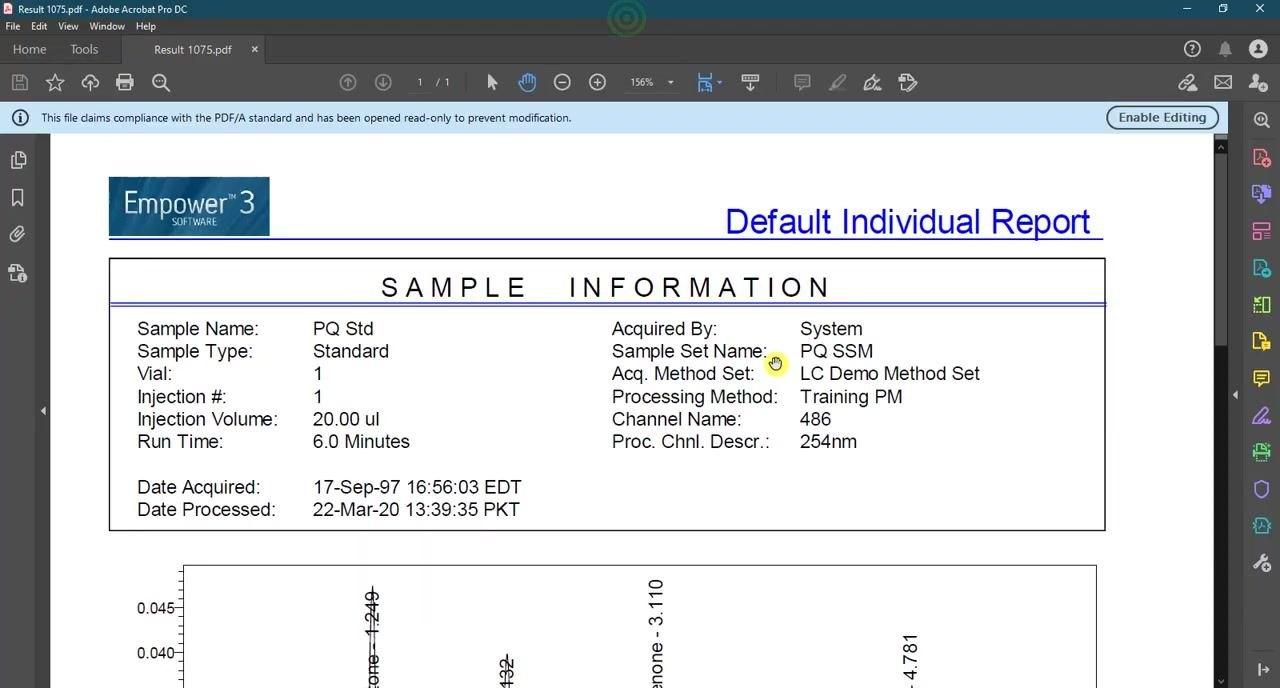
In the Report Publisher Preview window, the Default Individual Report displays sample information including Sample Name, Sample Type, Vial, Injection #, Injection Volume, Run Time, Acquired By, Sample Set Name, Acquisition Method Set, Processing Method, Channel Name, Processed Channel Description, Date Acquired, and Date Processed. The report also includes a chromatogram graph with labeled peaks (for example, Propiophenone at 3.110 and Butyrophenone at 4.781). In the Print dialog, with Adobe PDF currently selected as the printer, open the printer dropdown to choose a different printer.
Confirm the printer selection
In the Print dialog, confirm the selected printer — for example, "Hewlett-Packard HP LaserJet P2035" (Status: Ready; Type: HP LaserJet P2035 Class Driver; Where: USB002). Click Cancel if you do not want to print at this time, or proceed to print the report with your selected printer.
Summary
You have now created a processing method in Empower 3, configured its integration, calibration, and suitability parameters, saved it under a method name, run background processing and reporting against a sample set, and previewed the resulting report. You can reuse this processing method on future sample sets with similar chromatogram characteristics.
Generation details: cost, quality tiers
Docsie billed 2,500 credits ($1.75) to analyze this 5-minute video at standard quality. The rewrite, template fill and Word/PDF exports were included. The same video at each quality tier:
| Quality | Frames sampled | Credits | Approx. cost |
|---|---|---|---|
| Draft | every 16-30 s | 1,250 | $0.88 |
| Standard (this guide) | every 8-15 s | 2,500 | $1.75 |
| Detailed | every 4-7 s | 5,000 | $3.50 |
| Ultra | every 1-3 s | 10,000 | $7.00 |
Credits priced at $0.70 per 1,000; plans include a monthly allowance. Enterprise customers on on-premise or bring-your-own-model deployments run this on their own inference and pay no per-video credits.
Generated by Docsie Video-to-Docs on 2026-10-12 from a 4-minute video. Screenshots are frames from the source video and belong to their creator, Ahmed Saad - Analytical Engineer, whose original is embedded above. If you own this video and want the guide removed or credited differently, contact us and we will act within one business day.