
How to Find Beta in Bloomberg Terminal
Beta measures how sensitive a stock's returns are to movements in a broader market index, and it's a key input for valuation and risk analysis. This guide shows you how to find beta in Bloomberg Terminal, using the dedicated BETA function, and explains how to read and adjust the resulting output.
Video: How to Calculate Beta on Bloomberg? by Finance Lectures. All credit for the demonstration goes to the creator; watch the original on YouTube. The written guide below was generated from this video by Docsie. Creator? Request a change or removal.
Beta measures how sensitive a stock's returns are to movements in a broader market index, and it's a key input for valuation and risk analysis. This guide shows you how to find beta in Bloomberg Terminal, using the dedicated BETA function, and explains how to read and adjust the resulting output.
Prerequisites
- Access to a Bloomberg Terminal with an active login session.
Understand the Bloomberg screen layout
Before you search for beta, it helps to understand how Bloomberg screens are organized. Each screen features two main dropdown menus:
- The first dropdown lets you select the security (for example, a company's stock).
- The second dropdown lets you select the command or function (for example, the Beta calculation).
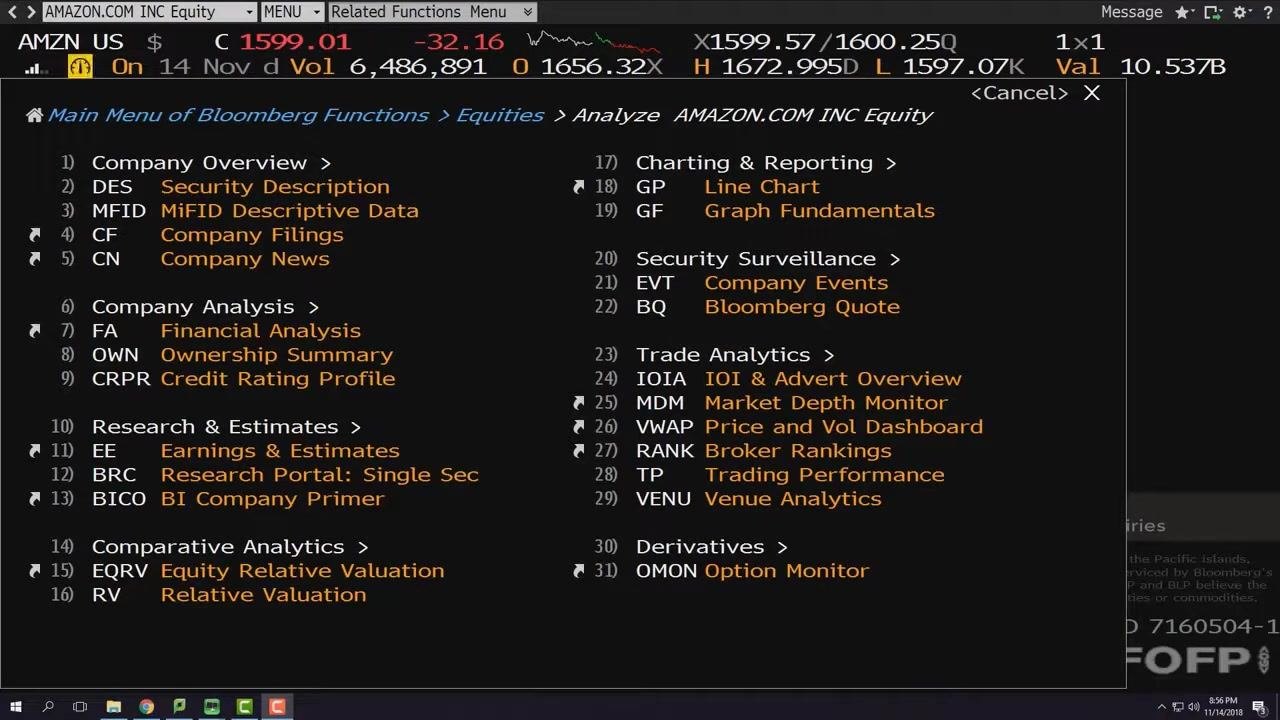
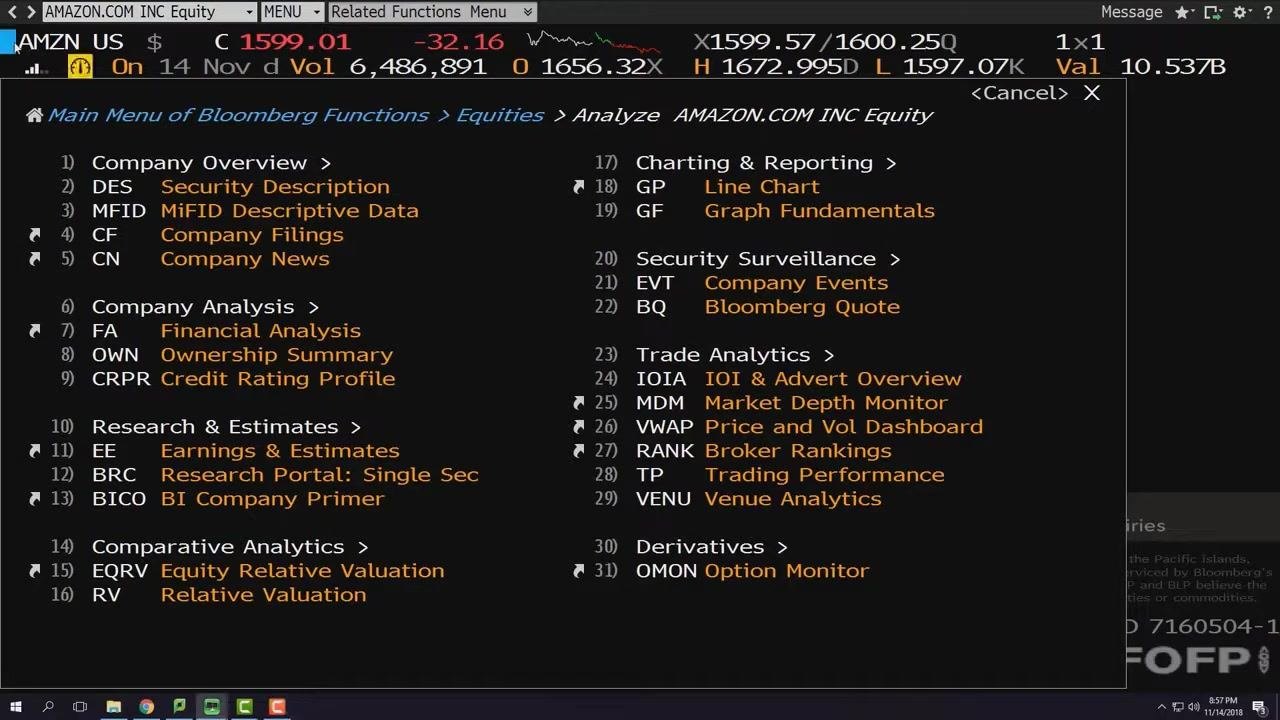
The main menu for Bloomberg Functions for Equities lists available functions such as Company Overview, Financial Analysis, and Earnings & Estimates, organized by categories and function codes (for example, DES for Security Description or FA for Financial Analysis). In the example below, the security selected is "AMAZON.COM INC Equity."
Select the security you want to analyze
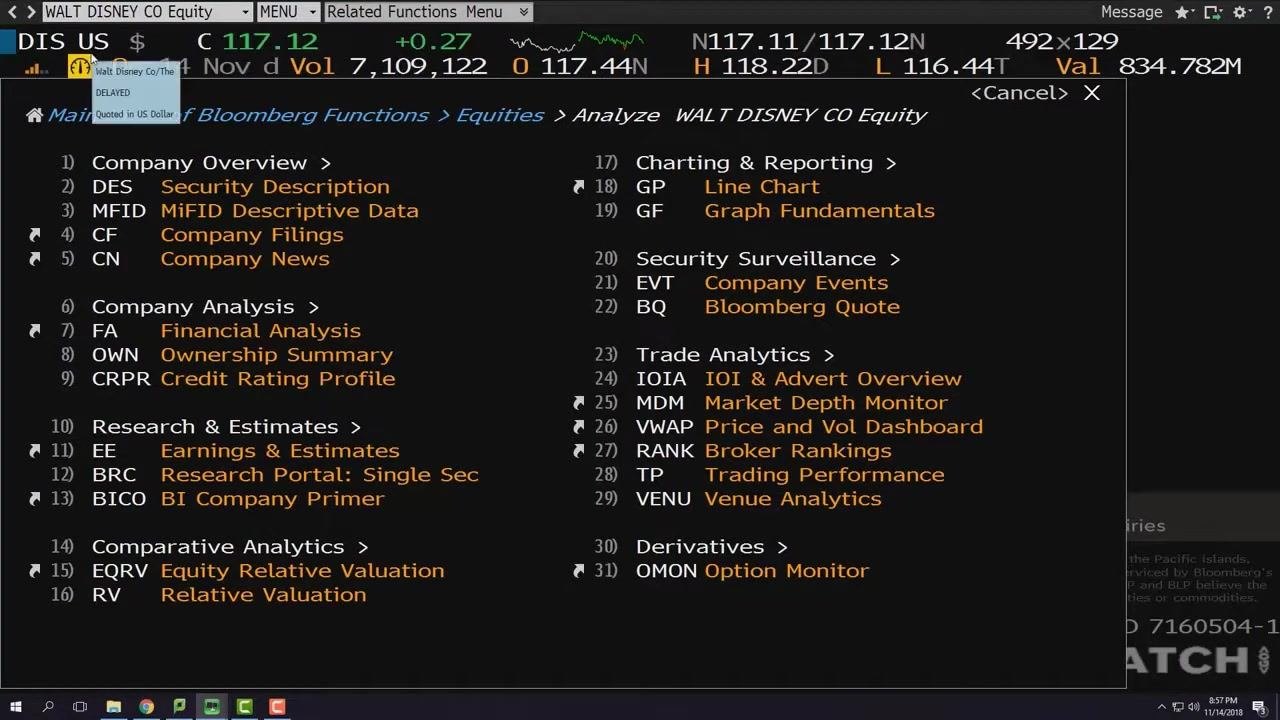
In the first dropdown, type the name of the company you want to analyze. For this example, type "Disney," then select "DIS US Equity" (Walt Disney Co quoted in US Dollar) from the search results. Confirm that the dropdown updates to show "WALT DISNEY CO Equity."
Open the Beta function
In the second dropdown (functions), type "beta" and select the first item in the list, which is the Beta function. The dropdown should now display "BETA," and the screen updates to show the beta calculation for Walt Disney Co.
Read the beta results
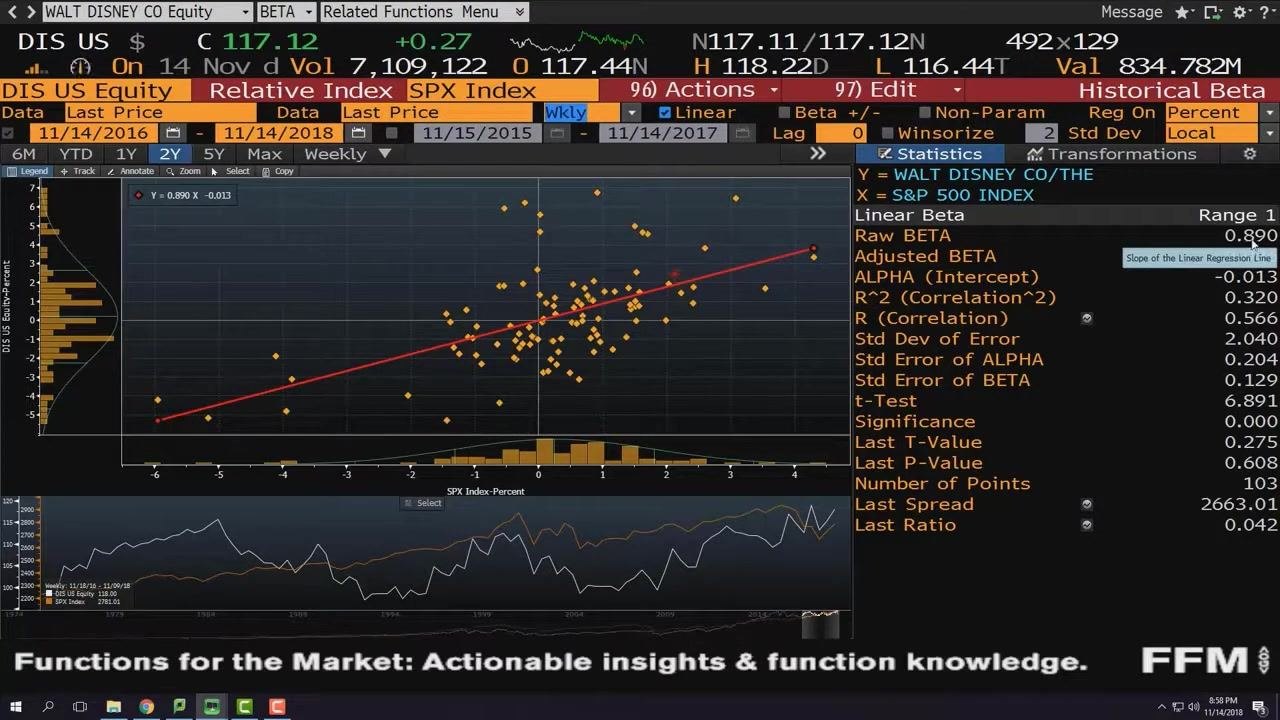
Once the BETA function loads, the beta value for Walt Disney Co is displayed as 0.89. The screen shows a scatter plot with a regression line, along with statistical values and additional metrics, including:
- Y (Dependent Variable): Walt Disney Co/The
- X (Independent Variable): S&P 500 Index (SPX Index)
- Raw Beta: 0.890
- Adjusted Beta: 0.926
- Alpha (Intercept): -0.013
- R² (Correlation²): 0.320
- R (Correlation): 0.566
The beta coefficient (0.89) represents the sensitivity of Disney's stock returns to the S&P 500 Index.
Understand the comparison variables
On the beta screen, Y represents Walt Disney Co (the dependent variable) and X represents the S&P 500 Index (the independent variable). You can change the market index used for comparison by clicking on "SPX Index" and selecting another index, such as Dow Jones Industrial.
Review and adjust the data range
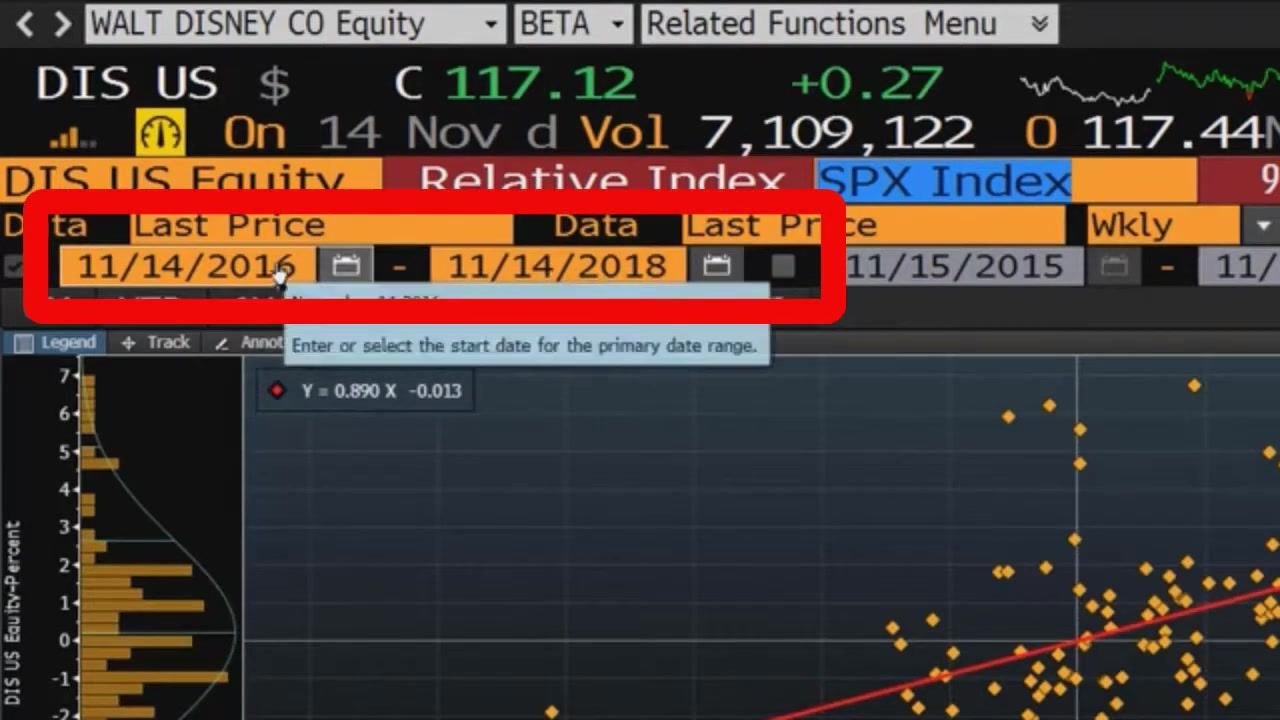
The data range used for the beta calculation is displayed at the top of the screen. In this example:
- Start Date: 11/14/2016
- End Date: 11/14/2018
- Frequency: Weekly (Wkly)
You can adjust the start and end dates by clicking directly on the date fields.
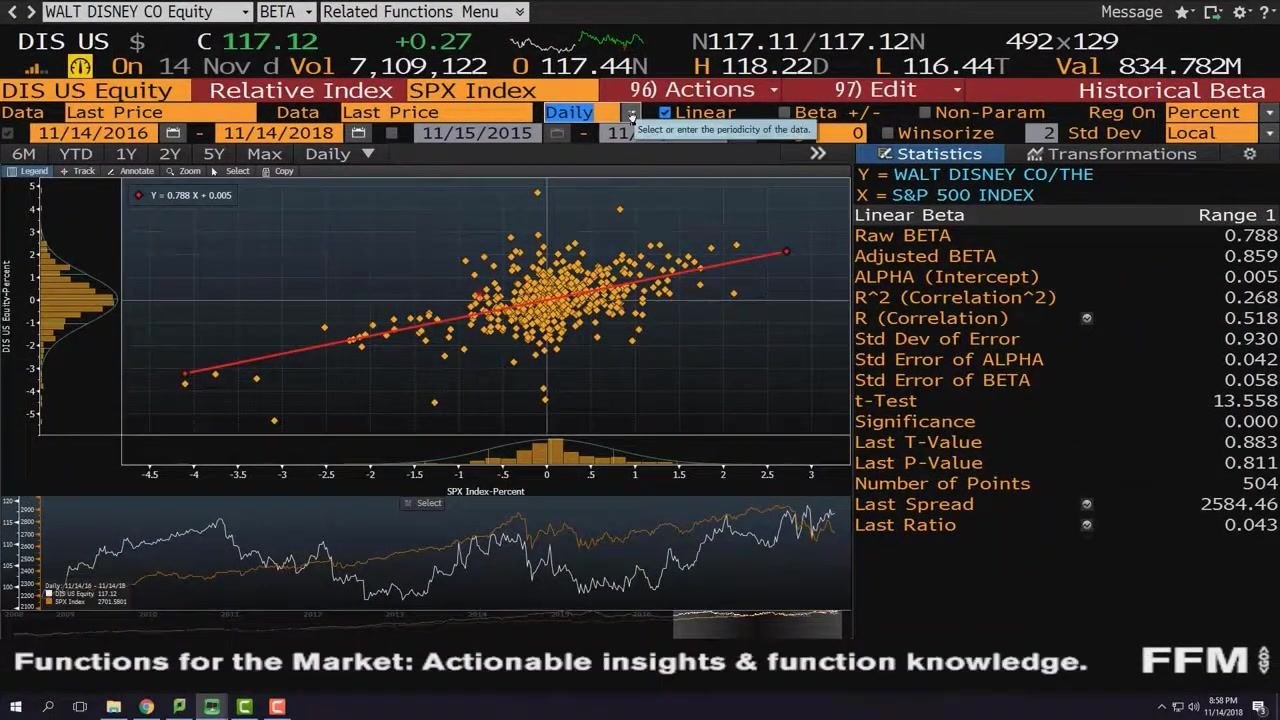
Change the data frequency to Daily
In the frequency dropdown menu, select "Daily" to change the periodicity of the underlying data. The Raw Beta value updates to 0.78. Using daily data introduces more noise into the beta calculation, which can make the results less stable.
Switch back to Weekly data
Change the frequency back to "Weekly" in the dropdown menu. Confirm that the Raw Beta value returns to 0.89. Finance professionals typically prefer weekly data for beta calculations, as it reduces noise and provides a more reliable estimate compared to daily data.
Summary
You've now learned how to find beta in Bloomberg Terminal by selecting a security, loading the BETA function, and reading the resulting scatter plot and statistics. You've also seen how to change the comparison index and adjust the date range and frequency, and why weekly data is generally the standard choice for a stable, reliable beta estimate.
Generation details: cost, quality tiers
Docsie billed 1,500 credits ($1.05) to analyze this 3-minute video at standard quality. The rewrite, template fill and Word/PDF exports were included. The same video at each quality tier:
| Quality | Frames sampled | Credits | Approx. cost |
|---|---|---|---|
| Draft | every 16-30 s | 750 | $0.52 |
| Standard (this guide) | every 8-15 s | 1,500 | $1.05 |
| Detailed | every 4-7 s | 3,000 | $2.10 |
| Ultra | every 1-3 s | 6,000 | $4.20 |
Credits priced at $0.70 per 1,000; plans include a monthly allowance. Enterprise customers on on-premise or bring-your-own-model deployments run this on their own inference and pay no per-video credits.
Generated by Docsie Video-to-Docs on 2026-10-12 from a 2-minute video. Screenshots are frames from the source video and belong to their creator, Finance Lectures, whose original is embedded above. If you own this video and want the guide removed or credited differently, contact us and we will act within one business day.